Photoluminescence study of Sb-doped ZnO films deposited by a closed tube CVT technique -通信作者
氮化镓纳米粒子的制备及光致发光研究

氮化镓纳米粒子的制备及光致发光研究沈龙海;富松;石广立【摘要】采用直接氮化法制备出尺寸不同的GaN纳米粒子,分别利用X射线衍射仪(XRD)、扫描电子显微镜(SEM)和光致发光(PL)谱测试手段对所制样品进行表征和发光特性的研究.结果表明:所制备的两种GaN纳米粒子直径分别为100 nm和300 nm左右.在GaN纳米粒子的PL谱中,中心在357 nm的发射源于本征发光,中心在385 nm的发射带源于浅施主能级到价带的辐射复合,中心在560 nm左右的发射带源于浅施主能级到深受主能级间的施主-受主对辐射发光.【期刊名称】《发光学报》【年(卷),期】2014(035)005【总页数】4页(P585-588)【关键词】GaN纳米粒子;直接氮化法;光致发光【作者】沈龙海;富松;石广立【作者单位】沈阳理工大学理学院,辽宁沈阳110159;沈阳理工大学理学院,辽宁沈阳110159;沈阳理工大学理学院,辽宁沈阳110159【正文语种】中文【中图分类】O471.4;O482.311 引言GaN是一种优异的直接带隙半导体材料,室温下禁带宽度为3.4 eV,具有优良的光电性能、热稳定性及化学稳定性,是制作高亮度蓝绿发光二极管(LED)、激光二极管(LD)以及大功率、高温、高速和恶劣环境条件下工作的光电子器件的理想材料[1-2]。
最近有报道发现GaN基纳米材料具有吸收可见光使水解离产生氢的性能,这使得GaN纳米材料的研究获得了很多的关注[3-4]。
半导体纳米粒子由于小尺寸效应,往往会呈现不同于体材料的发光特性[5]。
但要实现高效可靠的光发射,尤其是可在柔性衬底上制作器件并可供日常使用的光发射材料仍然是个巨大的挑战[6]。
这使得GaN纳米材料的发光特性、能带结构及深能级行为的研究对其在未来纳米器件上的应用具有十分重要的现实意义。
目前,合成GaN纳米粒子方法主要有氨热法[7]、金属有机化合物化学气相沉积(MOCVD)法[8]、高温热解法[9-10]、胶体化学法[11]等。
Enhanced Photocatalytic Hydrogen Evolution over Cu-Doped ZnIn2S4 under Visible Light Irradiation
Enhanced Photocatalytic Hydrogen Evolution over Cu-Doped ZnIn 2S 4under Visible Light IrradiationShaohua Shen,Liang Zhao,*Zhaohui Zhou,and Liejin GuoState Key Laboratory of Multiphase Flow in Power Engineering,Xi’an Jiaotong Uni V ersity,Xi’an,ShaanXi 710049,P.R.ChinaRecei V ed:May 22,2008;Re V ised Manuscript Recei V ed:July 25,2008A series of Cu-doped ZnIn 2S 4photocatalysts has been synthesized by a facile hydrothermal method,with the copper concentration varying from 0wt%to 2.0wt%.The physical and photophysical properties of these Cu-doped ZnIn 2S 4photocatalysts were characterized by X-ray diffraction (XRD),photoluminescence spectroscopy (PL),scanning electron microscopy (SEM),and UV -visible diffuse reflectance spectroscopy (UV -vis).The diffuse reflectance and photoluminescence spectra of Cu-doped ZnIn 2S 4shifted monotonically to longer wavelengths as the copper concentration increased from 0wt%to 2.0wt%,indicating that the optical properties of these photocatalysts greatly depended on the amount of Cu doped.Meanwhile,the layered structure of ZnIn 2S 4would be destructed gradually by Cu doping.The photoactivity of ZnIn 2S 4was enhanced when Cu 2+was doped into the crystal structure.The highest photocatalytic activity was observed on Cu (0.5wt%)–doped ZnIn 2S 4,with the rate of hydrogen evolution to be 151.5µmol/h under visible light irradiation (λ>430nm).On the basis of the calculated energy band positions and optical properties,the effect of copper as a dopant on the photocatalytic activity of Cu-ZnIn 2S 4was studied.1.IntroductionPhotocatalytic water splitting into H 2and O 2using semicon-ductor photocatalysts has been regarded as an attractive solution to resolve the global energy and environmental problems.Many effective photocatalysts have been developed;however,most of them only work in the ultraviolet region because of their wide band gap.1-4Thus,developing highly active photocatalysts with visible light response to use solar energy is important,as the ultraviolet light occupies only 2-3%of solar energy.Over the past few years,considerable effort has been made to narrow the band gap of catalysts to improve visible light response.Recent progress includes single-phase oxide PbBi 2Nb 2O 9for isopropyl alcohol degradation and water de-composition,5GaN-ZnO solid solution,6and titanium disilicide 7for pure water decomposition to H 2and O 2.One effective way to increase the absorption of photocatalyst is to form donor levels in the forbidden band by introducing foreign elements into active photocatalysts with a wide band gap.TiO 2codoped with Ni and Ta,8ZnS doped with Cu or Ni,9,10and ZnS codoped with Pb and halogens 11have been reported as active photocata-lysts under visible-light irradiation.In particular,the InTaO 4doped with Ni was found to be an active photocatalyst for overall water splitting in the visible light region.12On the other hand,chalcogenides such as CdS have been studied extensively,since they have ideal edge positions of the valence and conduction bands for hydrogen production from aqueous electrolyte solutions containing a sacrificial agent (Na 2S or/and Na 2SO 3)under visible light irradiation.13,14Unfortunately,they also have a fatal disadvantage of photocorrosion,i.e.,photogenerated holes in the valence band tend to react with chalcogenides themselves.15Although incorporation of chalco-genides into interlayers 16or mesoporous materials 17,18was efficient for stabilizing the chalcogenides and producing hy-drogen from water,the photocatalytic efficiency is still low.Recently,some multicomponent metal sulfides have been reported to be more stable and show higher photocatalytic activity under visible light.19-21Moreover,the CdZnS doped with Cu showed greatly improved stability and photocatalytic activity even without Pt as a cocatalyst.22Ternary sulfide ZnIn 2S 4,as the only member of the AB 2X 4family semiconductor with a layered structure,has attracted far-ranging interests because of its potential applications in different fields such as charge storage,23thermoelectricity,24and photo-conduction.25In 2003,Lei et al.26synthesized ZnIn 2S 4by a simple hydrothermal method and first treated ZnIn 2S 4as an efficient visible-light-driven photocatalyst for hydrogen produc-tion.In 2006,Gou et al.27hydrothermally prepared the ZnIn 2S 4solid or hollow microspheres in the presence of a surfactant such as cetyltrimethylammonium bromide (CTAB)or poly(eth-ylene glycol)(PEG).In our previous research,28,29the photo-catalytic activity of ZnIn 2S 4could be further enhanced when hydrothermally prepared in the presence of CTAB.Thus,ZnIn 2S 4turned to be a good candidate for hydrogen production from water under visible light.In the present study,a series of ZnIn 2S 4doped with different amounts of Cu was synthesized by a CTAB-assisted hydrothermal method.The effects of Cu doping on the morphology,optical properties,and photocatalytic activities of ZnIn 2S 4were discussed in detail.2.Experimental Section2.1.Synthesis of Cu-Doped ZnIn 2S 4.All chemicals are of analytical grade and used as received without further purifica-tion.ZnIn 2S 4products were prepared by a hydrothermal synthetic method.27In a typical procedure,0.735g of ZnSO 4·7H 2O,1.615g of In(NO 3)3·4H 2O,0.65g of cetyltrimethylam-monium bromide (CTAB),and a double excess of thioacetamide (TAA)were dissolved in 50mL of distilled water.The mixed solution was then transferred into a 70-mL Teflon-lined auto-clave.The autoclave was sealed and kept at 160°C for 12h*To whom correspondence should be addressed.Phone:+86-29-82668287.Fax:+86-29-82669033.E-mail address:lzhao@.J.Phys.Chem.C 2008,112,16148–161551614810.1021/jp804525q CCC:$40.75 2008American Chemical SocietyPublished on Web 09/20/2008and then cooled to room temperature naturally.A yellow precipitate was obtained,which was then filtered and washed with absolute ethanol and distilled water for several times.After being dried in a vacuum at 80°C,ZnIn 2S 4was obtained.For the synthesis of Cu-doped ZnIn 2S 4,a desired amount of 0.1M Cu(NO 3)2solution was added into the mixed solution before transferring into the autoclave.ZnIn 2S 4doped with different amounts of Cu is denoted as Cu(X )-ZnIn 2S 4;the value of X ,from 0wt%to 2.0wt%,is used to describe the weight content of Cu.2.2.Characterization.The X-ray diffraction (XRD)patterns were obtained from a PANalytical X’pert MPD Pro diffracto-meter using Ni-filtered Cu K R irradiation (Wavelength 1.5406Å).The diffuse reflection of the samples was determined by a Hitachi U-4100UV -vis -near-IR spectrophotometer.The analysis of photoluminescence spectra (PL)was carried out at room temperature using a PTI QM-4fluorescence spectropho-tometer.The sample morphology was observed by a JEOL JSM-6700FE scanning electron microscope.2.3.Evaluation of Photocatalytic Activity.Photocatalytic hydrogen evolution was performed in a gas-closed circulation system with a top window Pyrex cell.A 300W Xe lamp was used as the light source,and the UV part of the light was removed by a cutoff filter (λ>430nm).Hydrogen evolved was analyzed by an online thermal conductivity detector (TCD)gas chromatograph (NaX zeolite column,nitrogen as a carrier gas)every 10min.In all experiments,the photocatalyst powder (0.2g)was dispersed by a magnetic stirrer in 150mL of 0.25M Na 2SO 3/0.35M Na 2S aqueous solution.Here,Na 2SO 3/Na 2S mixed sacrificial agent was used to scavenge photogenerated holes.Nitrogen was purged through the cell before reaction to remove oxygen.Pt (1wt%)as a cocatalyst for the promotion of hydrogen evolution was photodeposited in situ on the photocatalysts from the precursor of H 2PtCl 6·6H 2O.The tem-perature for all the photocatalytic reactions was kept at 25(0.5°C.The blank experiments showed no appreciable H 2evolution in the absence of irradiation or photocatalyst.Apparent quantum yield defined by the eq 1was measured using a 420nm band-pass filter and an irradiatometer.A.Q.Y.(%))the number of reacted electronsthe number of incident photons×100)the number of evolved H 2molecules ×2the number of incident photons×100(1)2.4.Band Structure Calculation.The plane-wave-based density functional theory (DFT)calculation was carried out for ZnIn 2S 4with hexagonal structure by employing the CASTEPprogram to obtain further information about the energy structure of the Cu-ZnIn 2S 4photocatalysts.30The core electrons were treated using ultrasoft pseudopotentials,31and the valence electronic configurations for Zn,In,and S are 3d 104s 2,4d 105s 25p 1,and 3s 23p 4,respectively.The kinetic energy cutoff was taken to be 400eV for ZnIn 2S 4.The exchange and correlation interactions were modeled using the generalized gradient approximation (GGA).The calculation was carried out using the primitive unit cell of [ZnIn 2S 4]2,which had 31occupied orbitals.The atomic coordinates of ZnIn 2S 4were obtained from Gou et al.273.Results and Discussion3.1.Crystal Structure.Figure 1A shows X-ray diffraction patterns of Cu(X )-ZnIn 2S 4photocatalysts (X )0wt%to 2.0wt%).Without Cu doping,the diffraction peaks of the obtained ZnIn 2S 4sample can be readily indexed as a pure phase hexagonal ZnIn 2S 4(ICSD-JCPDS card No.01-072-0773,a )3.85Å,c )24.68Å),and no other impurities such as ZnS,In 2S 3,oxides,or organic compounds related to reactants were detected.When ZnIn 2S 4was doped with Cu,the XRD patterns of the obtained Cu(X )-ZnIn 2S 4were almost the same as that of the hexagonal ZnIn 2S 4,except that the diffraction peaks were slightly shifted to higher angles with the amount of Cu doped increasing,as shown in Figure 1B.This observation suggested that Cu 2+was homogeneously incorporated into the lattice of ZnIn 2S 4,because the ionic radius of Cu 2+(0.72Å)is smaller than the radius of Zn 2+(0.74Å)and In 3+(0.81Å).32Furthermore,Cu 2+may occupy the Zn 2+site,since charge compensation was very easy in this case,as deduced by Shionoya et al.33An XRD pattern of CuS around 2θ)30°could be easily observed while the amount of Cu doped was close to 2.0wt%.This was due to the limitation of doping amount in the ZnIn 2S 4lattice.113.2.Morphology.Figure 2shows SEM images for Cu(X )-ZnIn 2S 4with X )0wt%to 2.0wt%.During the hydrothermal process,addition of Cu ion directly affects the morphology of Cu-ZnIn 2S4.When none of the Cu was doped,ZnIn 2S 4exhibited a lot of separate microspheres with diameters of 1-2µm,as shown in Figure 2a.Further observation showed that all the microspheres were composed of numerous petals/sheets.This growth tendency of lamellar structures might be related to the layered feature of hexagonal ZnIn 2S 4.27When X )0.1wt%to 0.5wt %,ZnIn 2S 4products still appeared in the shape of microspheres;however,increasing the amount of Cu doped led to gradual decrease in the diameter of Cu(X )-ZnIn 2S 4micro-spheres.The diameter of microsphere was about 0.5-1µmforFigure 1.X-ray diffraction patterns of Cu(X )-ZnIn 2S 4;the values of X were (a)0.0wt%,(b)0.1wt%,(c)0.3wt%,(d)0.5wt%,(e)0.7wt%;(f)0.9wt%,(g)1.2wt%,(h)1.6wt%,(i)2.0wt%.Enhanced Photocatalytic Hydrogen Evolution J.Phys.Chem.C,Vol.112,No.41,200816149Figure 2.Part 1of 2.16150J.Phys.Chem.C,Vol.112,No.41,2008Shen et al.Cu(0.5wt%)-ZnIn 2S 4.As X increased further,the shape of microspheres for Cu(X )-ZnIn 2S 4was destructed partially and even throughly,as shown in Figure 2e -g,as well as the petals/sheets presented to be more irregular.When X )1.6wt%to 2.0wt %,instead of microspheres and petals/sheets,Cu(X )-ZnIn 2S 4turned out to be a bulky conglomeration with a rough surface,and petals/sheets could be hardly observed.The morphology of the Cu(X )-ZnIn 2S 4samples obtained in the same synthetic condition varies regularly with the increasing amount of Cu doped.That is to say,the layered structure of hexagonal ZnIn 2S 4,as well as the shape of microspheres,could be destructed gradually by the increasing Cu dopant.3.3.Optical Properties.Figure 3shows the UV -vis diffuse reflectance spectra of Cu(X )-ZnIn 2S 4with X )0wt%to 2.0wt%.The onset of the absorption edge of ZnIn 2S 4was at about 495nm,corresponding to the band gap of 2.51eV.Moreover,ZnIn 2S 4had an intense absorption band with a steep edge in the visible-light region.This shape indicated that the UV -vis absorption was due to the band gap transition but not due to the transition from impurity levels to the conduction band of ZnIn 2S4.As X increased,a new absorption shoulder around 500nm was observed,and the absorption edge of Cu(X )-ZnIn 2S 4shifted monotonously from 575to 650nm with an increase inX from 0.1wt%to 1.2wt%,corresponding to the narrowing of the band gap from 2.16to 1.91eV.The absorption shoulder with a long tail on the low energy side,which was characteristic of doped photocatalysts 34,35and indicated that intraband gap states were formed by the dopants in the forbidden band,couldFigure 2.Part 2of 2.Scanning electron microscope images of Cu(X )-ZnIn 2S 4;the values of X were (a)0.0wt%,(b)0.1wt%,(c)0.3wt%,(d)0.5wt%,(e)0.7wt%;(f)0.9wt%,(g)1.2wt%,(h)1.6wt%,(i)2.0wt%.Figure 3.Diffuse reflectance spectra of Cu(X )-ZnIn 2S 4;the values of X were (a)0.0wt%,(b)0.1wt%,(c)0.3wt%,(d)0.5wt%,(e)0.7wt%;(f)0.9wt%,(g)1.2wt%,(h)1.6wt%,(i)2.0wt%.Enhanced Photocatalytic Hydrogen Evolution J.Phys.Chem.C,Vol.112,No.41,200816151be assigned to the transition from the Cu3d level above the valence band to the conduction band of ZnIn 2S 4.In addition,a broad band (λ>750nm)was observed for Cu (1.6wt%to 2.0wt%)-ZnIn 2S 4.This was due to the impurity CuS phase,as indicated by X-ray diffraction.The PL spectra of Cu(X )-ZnIn 2S 4,with X )0wt%to 2.0wt%,were obtained using an excitation wavelength of 330nm,as shown in Figure 4.The PL intensity and response range of Cu(X )-ZnIn 2S 4were influenced by Cu doping.The PL spectra,in company with the diffuse reflect spectra,shifted successively to longer wavelength with the change in the amount of Cu doped,indicating that the energy structure of Cu(X )-ZnIn 2S 4depended on the value of X.Similar phenomena has been reported by Kudo et al.in the (AgIn)x Zn 2(1-x )S 2solid solutions.19However,as shown in Table 1,the emission spectra of Cu(X )-ZnIn 2S 4(X )0.0wt%to 0.7wt%)was somewhat red-shifted vis-a-vis the absorption edge.This is because the PL emission of Cu(X )-ZnIn 2S 4presented here is broadband,36or donor -acceptor defect (such as sulfur vacancy)based,37in nature.In constrast,the absorption edge of Cu(X )-ZnIn 2S 4(X )0.9wt%to 2.0wt%)shifted to longer wavelength when compared to the emission spectra.This may be due to the excess of Cu doping,resulting in the formation of CuS,which has a total absorption in the visible-light region.Thus,as reported by Peng et al.on Cu-ZnS,38the PL emission of Cu(X )-ZnIn 2S 4may arise from the recombination between the shallow donor level (sulfur vacancy)and the t 2level of Cu 2+(splitting from Cu3d).As the energy level of sulfur vacancy relative to the valence band nearly stays constant in these samples despite the variation in Cu 2+concentration,it can be concluded that the t 2energy level ofCu 2+ions is farther from the valence band with increasing Cu 2+concentration.In addition,it could be found from Figure 4that the PL intensity of Cu(X )-ZnIn 2S 4gradually increased as the Cu content increased and arrived at the highest degree when the Cu content was 0.5wt%.While the Cu content continued to increase,namely more than 0.5wt%,the PL intensity began to decrease.In Mn-ZnS 39and Cu-ZnS,38a similar photolumi-nescence phenomenon was also observed,which can be explained by the effect of ion doping.As the foregoing analysis shows,these PL spectra were related to native defects (e.g.,sulfur vacancy).When Cu 2+was doped into ZnIn 2S 4,more defect states would be introduced.Therefore,it is reasonable that the defect-related PL intensities were enhanced for the Cu 2+-doped samples compared with the undoped sample.As for the decrease of the PL intensity with the Cu 2+concentration above 0.5wt%,it may be caused by the formation of CuS,though the XRD measurement did not detect the existence of the copper sulfide phase.In Eu-doped GaN,40a similar concentration quenching phenomenon was also observed,which was mainly attributed to the formation of EuN compound.3.4.Band Structures.Figure 5A shows the band structure and the density of state (DOS)of ZnIn 2S 4.The density contour maps for the lowest unoccupied molecular orbitals (LUMO)and highest occupied molecular orbitals (HOMO)of ZnIn 2S 4are shown in Figure 5B.We can observe clearly that both the top of valence band and the bottom of the conduct band lay at the G point of the Brillouin zone from Figure 5A.So the pure ZnIn 2S 4crystal is a direct gap band semiconductor.The theoretical value of the direct gap at G is 0.4eV,which is less than the experimental value of about 2.51eV.Such an underestimation of the band gap is a well-known artifact of GGA.The density of states (Figure 5A)indicates that the S3p orbitals make a significant contribution to the valence band top of ZnIn 2S 4and that the highest occupied molecular orbital (HOMO)levels are composed mainly of the hybridized S3p and Zn3d orbitals.The In5s orbitals locate at more negative energy levels than that of S3p orbitals and do not contribute much to the valence band top.The lowest unoccupied molecular orbital (LUMO)levels are composed mainly of the In5s5p and S3p orbitals.The Zn4s4p orbitals locate at more positive energy levels and do not contribute much to the conduction band bottom.Based on the optical properties and DFT calculations,the schematic energy level diagram of Cu(X )-ZnIn 2S 4is shown in Figure 6.As for ZnIn 2S 4,upon photoexcitation,electrons would transfer from the valence band (hybridized S3p and Zn3d orbitals)to the conduction band (hybridized In5s5p and S3p orbitals),leaving photogenerated holes in the valence band.As aforementioned,the PL emission has been known to be due to the photoluminescence transition from the sulfur-vacancy-related donor level or the conduction band to the valence band.Therefore,the energy difference between the absorption edge and the emission spectra of ZnIn 2S 4can be explained.Taking the Cu doping into account,the t 2state,splitting from discrete Cu3d levels,will form above the edge of valence band of ZnIn 2S 4,which is consistent with those reported by Peng 38and Xu 41in Cu-ZnS.A similar orbital-splitting phenomenon has been observed by Ye 42and Zou 43for Cr-3d and Ni-3d orbtials in In 12NiCr 2Ti 10O 42and Ca 2NiWO 6.The t 2(Cu3d)level,pro-duced by doping Cu 2+into ZnIn 2S 4,works as the donor level and acceptor level for photoexcitation and PL emission,respec-tively,44as shown in Figure 6.With the amount of Cu doped increasing,the t 2(Cu3d)level will be elevated farther fromtheFigure 4.Photoluminescence spectra of Cu(X )-ZnIn 2S 4;the values of X were (a)0.0wt%,(b)0.1wt%,(c)0.3wt%,(d)0.5wt%,(e)0.7wt%;(f)0.9wt%,(g)1.2wt%,(h)1.6wt%,(i)2.0wt%,excited at 330nm.TABLE 1:Band Gap,Absorption Edge,PL Emission and Emission Intensity of Cu(X )-ZnIn 2S 4,with X )0.0wt%to 2.0wt%X (wt%)band gap a (eV)absorption edge (nm)PL emission (nm)emission intensity(normalized,a.u.)0.0 2.514955600.330.1 2.165755970.720.3 2.115876110.760.5 2.05604617 1.000.7 2.026146260.740.9 1.946396320.561.2 1.916506390.421.6 1.737156550.202.01.657506660.19aCalculated from absorption edge.16152J.Phys.Chem.C,Vol.112,No.41,2008Shen et al.valence band,which results in the redshift of absorption edge and PL emission for Cu(X )-ZnIn 2S 4.3.5.Photocatalytic Activities of Cu(X )-ZnIn 2S4.Figure 7shows the dependence of photocatalytic H 2evolution from an aqueous Na 2SO 3/Na 2S solution over Cu(X )-ZnIn 2S 4under visible-light irradiation (λ>430nm).Either nondoped orCu-Figure 5.(A)Band structure and density of states for ZnIn 2S 4calculated by the density functional method.(B)Density contour maps for the LUMO and HOMO of ZnIn 2S 4.Figure 6.Schematic energy level diagram of Cu(X )-ZnIn 2S 4.Vs stands for sulfurvacancy.Figure 7.Photocatalytic H 2evolution under visible-light irradiation over Cu(X )-ZnIn 2S 4;the values of X were (a)0.0wt%,(b)0.1wt%,(c)0.3wt%,(d)0.5wt%,(e)0.7wt%,(f)0.9wt%,(g)1.2wt%,(h)1.6wt%,(i)2.0wt%.Enhanced Photocatalytic Hydrogen Evolution J.Phys.Chem.C,Vol.112,No.41,200816153doped ZnIn 2S 4was active and stable for splitting water to hydrogen.The rate of H 2evolution over nondoped ZnIn 2S 4was 26.1µmol ·h -1.The apparent quantum yield at 420nm was calculated to be 9.6%by eq 1.As the amount of doped Cu was increased,the photocatalytic activity of Cu(X )-ZnIn 2S 4was increased,because the visible-light absorption band of Cu(X )-ZnIn 2S 4grew.11The highest activity was obtained when 0.5wt %of Cu was doped,the rate of hydrogen evolution reached at 151.5µmol ·h -1,with the apparent quantum yield determined to be 14.2%.As the concentration of Cu doped was above 0.5wt%,the activity was decreased,though the visible-light absorption band grew further.Such a similar dependence of photocatalytic H 2evolution upon the amount of dopant has been observed for several other photocatalysts.11,44,45These observa-tions indicated that the photocatalytic activites depended upon not only the visible-light absorption (i.e.,band gap)but also some other factors.One of the reasons for the decrease in photocatalytic activity may be due to the impurity phase of CuS,resulted from the excess of Cu doping,as proved by XRD results.The CuS impurity may work as recombination sites between photogenerated electrons and holes.Another possible inactivation factor for the ZnIn 2S 4doped with excessive Cu is that the layered structure could be destructed gradually with the amount of Cu increased further,as revealed by SEM images.Some perovskite photocatalysts with layered structure have also shown good photocatalytic activity for splitting water to hydrogen,as the dipole moment along layers seems to enhance the charge separation,resulting in high activity.46,47Figure 8shows the photocatalytic activity and photolumi-nescence intensity as a function of Cu content in the Cu(X )-ZnIn 2S 4.The change in photoluminescence intensity was concurrent to that in photocatalytic activity,as both photolu-minescence intensity and photocatalytic activity reached the highest level when 0.5wt %of Cu was doped.Photolumines-cence depends on various factors such as the densities of photoexcited charges and recombination centers,the extent of nonradiation process,and the mobility of photoexcited charges.44It is difficult to determine which process is mainly responsible for changes in photoluminescence intensity with Cu content.However,in association with the change in photocatalytic activity,a plausible explanation can be made as follows.During the PL process,vacancies (such as sulfur vacancy)and defects can easily bind photoinduced electrons to form excitons,so that the PL signal can easily occur.48When Cu 2+ions were doped into ZnIn 2S 4,more vacancies (such as sulfur vacancy)or defect states would be introduced.38The larger the content of vacancy or defect,the stronger the PL signal.Meanwhile,an increasein Cu content not only raised the t 2(Cu3d)level to narrow the band gap of Cu(X )-ZnIn 2S 4,which has been demonstrated by the UV -vis diffuse reflectance spectra,but also enhanced the density of the t 2(Cu3d)levels and increased the concentration and the mobility of the photoexcited electrons.44These could be related to the enhancement of photocatalytic activity.However,further increase in the amount of Cu doped would result in the increased absorption to longer wavelength,which was likely due to the formation of CuS,as discussed previously.Thus,the CuS impurity weakened the photoluminescence,40as well as lowered photocatalytic activity of Cu-doped ZnIn 2S 4.114.ConclusionsIn summary,we have synthesized a series of Cu-doped ZnIn 2S 4photocatalysts by a simple hydrothermal method.The photocatalytic activity of ZnIn 2S 4was remarkably enhanced by Cu doping.The optimized Cu (0.5wt%)-doped ZnIn 2S 4photocatalyst showed the highest activity for splitting water into H 2,with the rate of hydrogen evolution to be 151.5µmol ·h -1.With increasing concentration of Cu doped,the UV -vis spectra and PL emission peak were systematically shifted to longer wavelength.Moreover,there were certain intrinsic relationships between the PL emission intensity and photocatalytic activity of Cu-doped ZnIn 2S 4.That is to say,the change in photolumi-nescence intensity was concurrent to that in photocatalytic activity,both depending on the increasing concentration of Cu doped.Acknowledgment.The authors gratefully acknowledge the financial support of the National Natural Science Foundation of China (No.50521604)and National Basic Research Program of China (No.2003CB214500).The authors also would like to thank the molecular simulating platform and National High Performance Computing Center (Xi’an)at Xi’an Jiaotong University for the calculation resource support.References and Notes(1)Domen,K.;Kudo,A.;Ohnishi,T.J.Catal.1986,102,92.(2)Hwang,D.W.;Kim,H.G.;Kim,J.;Cha,K.Y.;Kim,Y.G.;Lee,J.S.J.Catal.2000,193,40.(3)Kato,H.;Asakura,K.;Kudo,A.J.Am.Chem.Soc.2003,125,3082.(4)Sato,J.;Saito,N.;Yamada,Y.;Maeda,K.;Takata,T.;Kondo,J.N.;Hara,M.;Kobayashi,H.;Domen,K.J.Am.Chem.Soc.2005,127,4150.(5)Kim,H.G.;Hwang,D.W.;Lee,J.S.J.Am.Chem.Soc.2004,126,8912.(6)Maeda,K.;Teramura,K.;Lu,D.;Takata,T.;Saito,N.;Inoue,Y.;Domen,K.Nature 2006,440,295.(7)Ritterskamp,P.;Kuklya,A.;Wu ¨stkamp,M.;Kerpen,K.;Weidentha-ler,C.;Demuth,M.Angew.Chem.,Int.Ed.2007,46,7770.(8)Niishiro,R.;Kato,H.;Kudo,A.Phys.Chem.Chem.Phys.2005,7,2241.(9)Kudo,A.;Sekizawa,M.Catal.Lett.1999,58,241.(10)Kudo,A.;Sekizawa,mun.2000,15,1371.(11)Tsuji,I.;Kudo,A.J.Photochem.Photobiol.A 2003,156,249.(12)Zou,Z.G.;Ye,J.H.;Sayama,K.;Arakawa,H.Nature 2001,414,625.(13)Bubler,N.;Meier,K.;Reber,J.F.J.Phys.Chem.1984,88,3261.(14)Naman,S.A.;Gra ¨tzel,M.J.Photochem.Photobiol.A 1994,77,249.(15)Inoue,T.;Watanabe,T.;Fujishima,A.;Honda,K.J.Electrochem.Soc.1977,124,719.(16)Shangguan,W.;Yoshida,A.J.Phys.Chem.B 2002,106,12227.(17)Shen,S.;Guo,L.J.Solid State Chem.2006,179,2629.(18)Shen,S.;Guo,L.Mater.Res.Bull.2008,43,437.(19)Tsuji,I.;Kato,H.;Kobayashi,H.;Kudo,A.J.Am.Chem.Soc.2004,126,13406.(20)Tsuji,I.;Kato,H.;Kudo,A.Angew.Chem.,Int.Ed.2005,44,3565.(21)Jang,J.S.;Choi,S.H.;Shin,N.;Yub,C.;Lee,J.S.J.Solid State Chem.2007,180,1110.Figure 8.Dependence of photocatalytic activity for H 2evolution and PL emission intensity over Cu(X )-ZnIn 2S 4,with X )0.0wt%to 2.0wt%.16154J.Phys.Chem.C,Vol.112,No.41,2008Shen et al.(22)Liu,G.;Zhao,L.;Ma,L.;Guo,mun.2008,9,126.(23)Romeo,N.;Dallaturca,A.;Braglia,R.;Sberveglieri,G.Appl.Phys. Lett.1973,22,21.(24)Seo,W.S.;Otsuka,R.;Okuno,H.;Ohta,M.;Koumoto,K.J.Mater. Res.1999,14,4176.(25)Romeo,N.;Tarricone,L.;Zanotti,L.Il Nuo V o Cim.D1983,2, 2007.(26)Lei,Z.;You,W.;Liu,M.;Zhou,G.;Takata,T.;Hara,M.;Domen, K.;Li,mun.2003,17,2142.(27)Gou,X.;Cheng,F.;Shi,Y.;Zhang,L.;Peng,S.;Chen,J.;Shen, P.J.Am.Chem.Soc.2006,128,7222.(28)Shen S.;Zhao L.;Guo L.Mater.Res.Bull.,2008,doi:10.1016/ j.materresbull.2008.03.027.(29)Shen S.;Zhao L.;Guo L.Int.J.Hydrogen Energy,2008, doi:10.1016/j.ijhydene.2008.05.043.(30)Segall,M.D.;Lindan,P.J.D.;Probert,M.J.;Pickard,C.J.;Hasnip, P.J.;Clark,S.J.;Payne,M.C.J.Phys.:Condens.Matter2002,14,2717.(31)Vanderbilt,D.Phys.Re V.B1990,41,7892.(32)Lei,Z.;Ma,G.;Liu,M.;You,W.;Yan,H.;Wu,G.;Takata,T.; Hara,M.;Domen,K.;Li,C.J.Catal.2006,237,322.(33)Shionoya,S.;Tamoto,Y.J.Phys.Soc.Jpn.1964,19,1142.(34)Konta,R.;Ishii,T.;Kato,H.;Kudo,A.J.Phys.Chem.B2004, 108,8992.(35)Miyauchi,M.;Takashio,M.;Tobimatsu,ngmuir2004,20, 232.(36)Spanhel,I.;Anderson,M.A.J.Am.Chem.Soc.1991,113,2826.(37)Castro,S.L.;Bailey,S.G.;Raffaelle,R.P.;Banger,K.K.;Hepp,A.F.J.Phys.Chem.B2004,108,12429.(38)Peng,W.Q.;Cong,G.W.;Qu,S.C.;Wang,Z.G.Opt.Mater. 2006,29,313.(39)Ghosh,P.K.;Ahmed,Sk.F.;Jana,S.;Chattopadhyay,K.K.Opt. Mater.2007,29,1584.(40)Bang,H.;Morishima,S.;Sawahata,J.;Seo,J.;Takiguchi,M.; Tsunemi,M.;Akimoto,K.;Nomura,M.Appl.Phys.Lett.2004,85,227.(41)Xu,S.J.;Chua,S.J.;Liu,B.;Gan,L.M.;Chew,C.H.;Xu,G.Q. Appl.Phys.Lett.1998,73,478.(42)Wang,D.;Zou,Z.;Ye,J.Chem.Phys.Lett.2005,411,285.(43)Li,D.;Zheng,J.;Zou,Z.J.Phys.Chem.Solids2006,67,801.(44)Arai,N.;Saito,N.;Nishiyama,H.;Domen,K.;Kobayashi,H.;Sato, K.;Inoue,Y.Catal.Today2007,129,407.(45)Nishimoto,S.;Matsuda,M.;Miyake,M.Chem.Lett.2006,35, 308.(46)Kudo,A.;Kato,H.;Nakagawa,S.J.Phys.Chem.B2000,104, 571.(47)Hwang,D.W.;Kim,H.G.;Lee,J.S.;Kim,J.;Li,W.;Oh,S.H. J.Phys.Chem.B2005,109,2093.(48)Jing,L.;Qu,Y.;Wang,B.;Li,S.;Jiang,B.;Yang,L.;Fu,W.;Fu,H.;Sun,J.Sol.Energy Mater.Sol.Cells2006,90,1773.JP804525QEnhanced Photocatalytic Hydrogen Evolution J.Phys.Chem.C,Vol.112,No.41,200816155。
铝掺杂钛酸锶光催化剂的合成

收稿日期:2020-12-08基金项目:四川省教育厅科研项目(JG2018-477)作者简介:陆春海(1968—),博士,教授,从事三废治理与处置、多尺度模拟研究、核燃料循环与材料檽檽檽檽檽檽檽檽檽檽檽檽檽檽殦殦殦殦。
科研与开发铝掺杂钛酸锶光催化剂的合成任金秋1,苏静倩1,吴凯霖1,陆春海1,2(1.地学核技术四川省重点实验室(成都理工大学),四川成都 6100592.国家环境保护水土污染协同控制与联合修复重点实验室(成都理工大学),四川成都 610059)摘要:具有独特钙钛矿结构的钛酸锶由于其独特的光学性能已经受到广泛关注。
本文尝试以廉价、无毒的铝化合物作为掺杂剂,进行铝掺杂钛酸锶光催化剂的合成。
合成的干凝胶于500℃环境下煅烧3h合成SrTiO3光催化剂,表征结果显示:合成的光催化剂以立方钛酸锶型为主、部分无定形和部分金红石型TiO2。
Al元素掺杂改进了形貌且出现部分片状形貌。
关键词:钛酸锶;铝;光催化;合成中图分类号:O643.3 文献标识码:A 文章编号:1008-021X(2021)06-0001-03SynthesisofAlDopedStrontiumTitanatePhotocatalystRenJinqiu1,2,SuJingqian1,2,WuKailin1,2,LuChunhai1,2(1.SichuanKeyLaboratoryofAppliedNuclearTechniquesinGeosciences(ChengduUniversityofTechnology),Chengdu 610059,China;2.StateEnvironmentalProtectionKeyLaboratoryofSynergisticControlandJointRemediationforSoilandWaterPollution(ChengduUniversityofTechnology),Chengdu 610059,China)Abstract:Strontiumtitanate(STO)hasauniqueperovskitestructure.STOattractesmuchattentionduetoitsuniqueopticalproperties.Inthispaper,wetrytosynthesizealuminumdopedstrontiumtitanatephotocatalystbyusingcheapandnon-toxicaluminumcompoundsasdopants.STOphotocatalystwassynthesizedbycalcinationat500℃for3hours.ThecharacterizationresultsshowedthattheSTOwascubicstrontiumtitanatewithpartofamorphousSTOandrutileTiO2.Aldopingimprovesthemorphologyandsomelamellarmorphologyappears.Keywords:strontiumtitanate;aluminum;photocatalysis;synthesis 钛酸锶(SrTiO3,STO)具有独特钙钛矿结构,由于其独特的结构、良好的物理和化学稳定性、强烈的可见光发光和优异的光学性能而受到人们的关注。
First-principles calculations of electronic

First-principles calculations of electronic structure and optical properties of Boron-doped ZnO with intrinsicdefectsYen-Chun Peng,Chieh-Cheng Chen,Hsuan-Chung Wu ⇑,Jong-Hong LuDepartment of Materials Engineering,Ming Chi University of Technology,New Taipei 24301,Taiwana r t i c l e i n f o Article history:Received 11August 2014Received in revised form 27October 2014Accepted 27October 2014Available online 15November 2014Keywords:First principles B-doped ZnO Intrinsic defectElectronic structure Optical propertya b s t r a c tThis study adopted first-principles calculations to evaluate the effects of intrinsic defects on the elec-tronic structure and optical properties of Boron-doped ZnO (BZO).Four types of defect were considered:non-defective (B Zn ),Zn vacancies (V Zn ),O vacancies (V O ),and interstitial Zn (Zn i ).Calculations of forma-tion energy illustrate that O-rich conditions tend to induce V Zn ,while O-poor conditions tend to induce V O and Zn i .With respect to electric properties,V Zn defects in BZO decrease carrier concentration as well as mobility,which consequently decreases the conductivity of BZO.The existence of V O or Zn i defects in BZO leads to n-type conductive characteristics and increases the optical band gap.The existence of Zn i defects in BZO also increases the effective mass,which decreases the mobility and conductivity of BZO.As for the optical properties,the introduction of V Zn to BZO leads to an increase in transmittance in the visible light region,but a decrease in the UV region.The introduction of intrinsic V O and Zn i defects to BZO leads to a significant decrease in transmittance in the visible as well as UV regions.The calculated results were also compared with experimental data from the literature.Ó2014Elsevier B.V.All rights reserved.1.IntroductionZnO is an abundant,non-toxic material with a wide band gap (3.37eV)and transparent properties under visible light.ZnO has recently attracted considerable attention as an alternative for Tin-doped In 2O 3(ITO),which is currently the most common choice of transparent conductive oxide for a variety of applications [1,2].The resistivity of pure ZnO is on the order of 10À2X -cm,which is far higher than that of ITO (10À4X -cm order).A great deal of research has gone into enhancing the conductivity of ZnO through the addition of various dopants,which can mainly be divided into metals [3–5]and non-metals [6,7].B-doped ZnO (BZO)thin film shows considerable promise for its superior photoelectric proper-ties and stability [8,9].Many groups have investigated the effects of process parameters on the electric and optical properties of BZO thin film,with the aim of optimizing performance [7–13].Miyata et al.[7]indicated that the transmittance of BZO thin film could be improved through the introduction of O 2gas from 0sccm to 10sccm.David et al.[10]reported that annealing temperature and atmosphere strongly affect the conductivity of BZO.Yang et al.[11]concluded that the low oxygen partial pressure during deposition increases the carrier density of oxygen vacancies,which leads to a strong decline in resistivity.However,resistivity in sam-ples produced under the high oxygen partial pressure is far higher than in samples deposited under low oxygen partial pressure,which suggests the existence of p-type carriers of Zinc vacancies in films grown under high oxygen partial pressure.Patil et al.[12]synthesized B-doped ZnO powders using a mechanochemical method.The photoluminescence (PL)spectra at room temperature is an indication that a greater number of oxygen vacancies exist in nonmetal-doped ZnO,compared to pure ZnO.In the fabrication of BZO microrods,Yılmaz et al.[13]investigated the influence of B diffusion doping on optical emission and defect formation.PL spec-tra results revealed that the intensity of the deep level visible band emission increases with an increase in annealing time,which implies a significant increase in the concentration of intrinsic defects.As outlined above,various process conditions influence the type and number of intrinsic defects with a subsequent influence on the electric and optical properties of BZO.Gaining a comprehensive understanding of the electric and optical characteristics of BZO would require in-depth study into the effects of intrinsic defects on the properties of BZO.First-principles calculations can provide information concerning materials at the microscopic scale to eluci-date the connection between structure and properties.It is well known that the use of conventional density functional theory/10.1016/j.optmat.2014.10.0580925-3467/Ó2014Elsevier B.V.All rights reserved.⇑Corresponding author at:Department of Materials Engineering,Ming Chi University of Technology,84Gungjuan Road,Taishan,New Taipei 24301,Taiwan.Tel.:+8862290898994675;fax:+886229084091.E-mail address:hcwu@.tw (H.-C.Wu).(DFT)leads to a considerable underestimation of the calculated band gap in ZnO [14–16].In our previous study [17],we used the DFT plus Hubbard U (DFT +U)method to avoid underestimat-ing the band gap.This approach reduced the differences in calcu-lated band gap and lattice constant to within 1%of the experimental values.The current study extended the utilization of the DFT +U method to calculate and analyze the effects of intrin-sic defects (V Zn ,V O ,and Zn i )on the formation energy,crystal struc-ture,electronic structure,and optical properties of BZO.These results clarify the connections among the fabrication process,structure,and properties of BZO,for use in determining the criteria for future material designs.2.Calculation methodsThis study considered a 2Â2Â2supercell of a Wurtzite ZnO,including 16Zn atoms and 16O atoms,as shown in Fig.1.A B-monodoping model was constructed by substituting one Zn atom (number 1site)with one B atom (B Zn model),which correspond to the B concentrations of 6.25at.%.We also considered three intrinsic defects in the B Zn structure,in which Zn vacancies(B Zn V Zn ),O vacancies (B Zn V O ),and interstitial Zn (B Zn Zn i )are repre-sented as 2,3,and 4,respectively.The V Zn ,V O ,and Zn i concentra-tions corresponds to doping levels of 6.25, 6.25,and 5.88at.%,respectively.The defect concentration could be reduced using a larger supercell for the real systems;however,this study was lim-ited with regard to computer resources.Therefore,the properties of the defects calculated from a 2Â2Â2ZnO supercell such as this could be used as qualitative analysis.1432ZnO BTable 1Formation energy and optimized structure of BZO with varying intrinsic defects.Formation energy (eV)Optimized structure O-richO-poor Zn–O (Å)B–O (Å)4V (%)ZnO –– 1.981––B Zn3.750.39 1.996 1.526À3.1B Zn V Zn 5.68 5.81 1.993 1.530À3.3B Zn V O 7.550.70 1.995 1.521À5.3B Zn Zn i10.513.662.0031.5174.74.5 eV2.15 eV3.25 eV4.68 eV4.41 eV(a)(b)(c)(d)Band structures of B-doped ZnO for (a)B Zn ,(b)B Zn V Zn ,(c)B Zn V O models.Y.-C.Peng et al./Optical Materials 39(2015)34–3935All models presented in this study were developed using CASTEP software [18].Structural optimization was performed on each model before calculating properties.The Monkhorst–Pack scheme [19]K-points grid sampling in the supercells was set at 4Â4Â2.Electron–ion interactions were modeled using the ultrasoft pseudo-potential method [20].The valence configurations of the atoms were 4s 23d 10for Zn,2s 22p 4for O,and 2s 22p 1for B.The elec-tron wave functions were expanded in plane wave with an energy cutoff of 380eV.In the structural optimization process,the change in energy,maximum force,maximum stress,and maximum displacement tolerances were set at 10À5eV/atom,0.03eV/Å,0.05GPa,and 0.001Å,respectively.The energy convergence crite-rion for the self-consistent field was set at 10À6eV.To describe the electronic structures more accurately,we adopted the DFT +U d +U p method [21],in which the U d value for Zn-3d and the U p value for O-2p orbitals were set at 10and 7eV,respectively.The band structures,band gaps,and Zn-3d orbital locations of pure ZnO,which were used for the selection of U d and U p values,can be referenced in our previous research [17,22].3.Results and discussion 3.1.Optimized structureThe average bond lengths and volume difference ratio,as obtained from geometric optimization,are summarized in Table 1.In pure ZnO,each Zn atom is bonded to its three horizontal and one vertical oxygen neighbors.The average bond length of Zn-O is 1.981Åand optimized lattice constants are a =b =3.249Åandc =5.232Å,which are in agreement with the experimental values of a =b =3.249,c =5.206Å[23].Following the substitution of one B atom for one Zn atom (B Zn model),the Zn–O bond length is longer than that of B–O (1.526Å).This is because the B 3+radius (0.27Å)is smaller than that of Zn 2+(0.74Å)[24].Therefore,the cell volume of B Zn model shrinks,which is consistent with the experi-mental results [25].Clearly,the presence of Zn or O vacancies in BZO also leads to a shrinkage in volume.Conversely,the presence of interstitial Zn leads to a longer Zn–O length and expansion in volume.3.2.Formation energyTo examine the relative stability of BZO with intrinsic defects in neutral charge state,the defect formation energy can be expressed as follows:[26,27]E f ðD Þ¼E tot ðD ÞÀE tot ðZnO ÞþXn i l ið1Þwhere E tot (ZnO)and E tot (D )are the total energy in pure ZnO and in the defective systems,respectively.n i is the number of i atoms removed from or added to the supercell.If an atom is removed from the supercell,n i is positive,otherwise is negative.l i is the chemical potential of atom i .Formation energy depends on the growth envi-ronment during the preparation process,which can be O-rich or O-poor (Zn-rich).In thermo-dynamic equilibrium,D l Zn +D l O =D H f (ZnO),where D H f (ZnO)represents the formation enthalpy of ZnO.For the chemical potential of B,this study adopted the relation of 2D l B +3D l O 6D H f (B 2O 3)under O-rich conditions and l B =l B(bulk)under O-poor conditions,where D H f (B 2O 3)represents the(a)(b)(c)(d)V ZnV OZn iBZnOO density difference for (a)B Zn ,(b)B Zn V Zn ,(c)B Zn V O ,and (d)B Zn Zn i models.The red,orange,yellow,green,and interpretation of the references to color in this figure legend,the reader is referred to the web version 36Y.-C.Peng et al./Optical Materials 39(2015)34–39formation enthalpy of B2O3.D l i represents the chemical potential of atom i referred to as the elemental solid/gas of l i(bulk/molecule).It is well known that a defective structure with lower formation energy forms more readily and denotes an increased occurrence of defects.Table1presents a summary of the calculated formation energy of BZO with various intrinsic defects,based on the neutral charge state.With the existence of B Zn,E f(B Zn V Zn)<E f(B Zn V O)<E f (B Zn Zn i)under O-rich conditions,implying that O-rich conditions are more likely to induce the formation of V Zn,followed by V O and Zn i.Under O-poor conditions,E f(B Zn V O)<E f(B Zn Zn i)<E f (B Zn V Zn),which implies that O-poor conditions are more likely to induce the formation of V O.As a result,process conditions,such as O2gasflow rate and substrate temperature,largely determine the type of intrinsic defects that form in BZO during preparation. The occurrence of V O is far more likely under a low-O atmosphere, and V Zn is more likely to occur under a high-O atmosphere.For the sake of comparison,we also calculated the formation energy of a single intrinsic defect(V Zn and V O)in pure ZnO.The calculated values of E f(V Zn)and E f(V O)are3.09and4.33eV under O-rich conditions and6.58and0.84eV under O-poor conditions. Thus,we can see that the formation energy of a Zn vacancy from pure ZnO(E f(V Zn))is greater than that obtained from BZO(E f(B Zn V Zn)ÀE f(B Zn)=1.93eV under O-rich conditions and5.42eV under O-poor conditions).This demonstrates that Zn vacancies form more easily in BZO than in ZnO.These results are similar to those calculated for O vacancies,which implies that B-doping facilitates the formation of V Zn and V O.Previous studies [12]obtained similar results,indicating that a greater number of oxygen vacancies or defects exist in BZO than in pure ZnO.3.3.Electronic structureTo clarify the influence of intrinsic defects on the electronic structure of BZO,we calculated the band structure,difference in charge density,and density of states(DOS),as shown in Figs.2–4,respectively.In our previous study[17,22],the calculated band structure revealed a band gap of3.37eV in pure ZnO,which is in excellent agreement with values obtained in experiments.In the present study,we focus on the properties of BZO with intrinsic defects.Fig.2presents the band structures for BZO with various intrin-sic defect models.The Fermi level indicated by the dotted line was set to zero.Fig.2(a)shows the situation in which a Zn atom in pure ZnO is replaced by a B atom,in which the Fermi level shifts from the valence band(VB)maximum to the bottom of the conduction band(CB),resulting in a shallow donor level at the bottom of the CB.The shallow donor level at B doping causes an increase in the optical band gap to4.5eV at B concentration of6.25at.%,which is well known as the Burstein-Moss effect[28].The definitionof Fig.4.Density of states for(a)B Zn,(b)B Zn V Zn,(c)B Zn V O,and(d)B Zn Zn i models.optical band gap is from the top offor n-type semiconducting materials and the bottom of conduction band for materials.Similar tendencies were experiment-based studies[29,30].Asin the vicinity of B impurities appears atoms.The calculated Mulliken bond and B–O bonds are0.371and0.658, that a B–O bond is more covalent than Mulliken bond population represents characteristics).As shown in Fig.4(a),to the bottom of CB are the Zn-4s anda few O-2s and O-2p orbitals.The main extra electron tofill up the CBM.According to the results calculated regarded as an intrinsic defect under the B Zn V Zn model(Fig.2(b)),when donor levels coexist,the empty states produced trons from the B Zn donor level,resulting level as well as the formation of p-type band gap of B Zn V Zn can be narrowed to eration of conduction electrons requires energy from the Fermi level to the CB, be required in the B Zn model.Thus,in may lead to a decrease in the carrier known that mobility is related to the time.The relaxation time could not be software and was assumed as a defects in BZO.The followingeffects of the effective mass on thenear the Fermi level appear nearlyof carriers with a smaller curvature The larger effective mass is related toTherefore,V Zn defects in BZO reduce both carrier concentration as well as mobility,which consequently increases the resistivity of BZO.Fig.3(b)shows that the O atoms surrounding a Zn vacancy gain fewer electrons(green color),implying the occurrence of a number of empty states of O atoms.These empty states are O-2p orbitals near the Fermi level,as shown in Fig.4(b).V O and Zn i can be regarded as intrinsic defects in an O-poor environment.Fig.2(c)and(d)show the band structures in B Zn V O and B Zn Zn i models,in which n-type conductive characteristics appear and the optical band gap increases to4.68eV and4.41eV, respectively.One shallow donor state and one deep donor state occur in these two models.In the B Zn V O model,the deep donor level is probably the charge remaining in the oxygen vacancy (Fig.3(c));in the B Zn Zn i model,it is probably the covalence charge in the vicinity of the interstitial Zn atom(Zn i)(Fig.3(d)).Fig.4(c) and(d)show that the shallow donor level in both models origi-nated from B doping,whereas the deep donor level in the B Zn V O and B Zn Zn i models originated from the addition of V O and Zn i, respectively.The deep donor level in the B Zn V O model comprises mainly Zn and O atoms;however,in the B Zn Zn i model,it also includes B atom(B-2s and B-2p states).The shallow donor states provide conduction electrons;however,the deep donor states may contribute less to the increase in carrier concentration.Qual-itatively,the curvature of the energy band near the Fermi level in the B Zn Zn i model is smaller than that in the B Zn V O model.There-fore,Zn i defects present in BZO increase the effective mass,which may consequently decrease the mobility and conductivity of BZO.3.4.Optical propertiesThe optical properties can be described via the dielectric func-tion e(x)=e1(x)+i e2(x)[31].The imaginary part of the dielectric function e2(x)is calculated as follows:e2¼2e2pX e0Xk;v;cu ckuÁrj j u v k2d E ckÀE vkÀxÀÁð2Þwhere e is the electronic charge;X is the unit cell volume;u is the vector defining the polarization of the incident electricfield;x is the frequency of light;and u c k and u v k are the wave functions of the conduction and valence bands,respectively.Fig.5(a)shows the e2(x)of BZO with various intrinsic defects. In the B Zn model,a blue-shift in the intrinsic absorption edge occurred due to an enlarged optical band gap as compared with ZnO.The shallow donor levels mentioned in Section3.3resulted in an absorption peak at1.2eV.The absorption peaks in the intrin-sic defect models were as follows:B Zn V Zn(0.3eV),B Zn V O(1.5eV), and B Zn Zn i(0.9eV).These peaks resulted in enhanced absorption in the visible range.The peak of B Zn V Zn is the lowest,which can probably be attributed to the transition between occupied states and unoccupied states near the Fermi level.In the B Zn V O,and B Zn Zn i models,the absorption in the visible range may be the result of a shift from the shallow and deep donor occupied states to the unoccupied states of the conduction band.Fig.5(b)presents the transmittance of BZO under various defec-tive models.Table2presents the calculated values for average transmittance associated with each model under UV and visible light.It is should be noted that the calculated results were based on the doping levels of B(6.25at.%),V Zn(6.25at.%)V O(6.25at.%), and Zn i(5.88at.%).The average transmittance of pure ZnO is89.2 %in the visible region and65.6%in the UV region.Fig.5(b)shows that the incorporation of B into ZnO decreased transmittance in the range of800–1200nm(infrared region)and400–800nm(visible light region),but increased transmittance in the range of200–400nm(UV region),compared with pure ZnO.When V Zn was introduced to BZO,transmittance in the visible light region was Optical properties of BZO with varying intrinsic defects.(a)Imaginary dielectric function,(b)Transmittance.38increased,but transmittance in the UV region decreased,compared with BZO.When V O or Zn i was introduced to BZO,the transmit-tance of visible as well as UV light declined significantly,which implies that transmittance could be reduced by employing a low-O environment for fabrication.This may explain why trans-mittance is enhanced by an increase in oxygen pressure during processing[7].4.ConclusionsThis study used the DFT+U method to investigate the influence of intrinsic defects on the formation energy,crystal structure,elec-tronic structure,and optical properties of BZO.Our results revealed that the formation energy of V Zn is lowest under O-rich conditions and the formation energy of V O is lowest under O-poor conditions. V Zn defects in BZO may decrease carrier concentration as well as mobility,which increases transmittance in the visible light region but decreases transmittance in the UV region.V O or Zn i defects in BZO lead to the appearance of n-type conductive characteristics, increasing the optical band gap,and decreasing transmittance in the visible light and UV regions.In addition,Zn i defects increase the effective mass,which may consequently decrease the mobility and conductivity of BZO.Conflict of interestsThe authors declare that there is no conflict of interests regard-ing the publication of this article.AcknowledgementsThis work was supported by the National Science Council in Taiwan(NSC102-2221-E-131-008),for which the authors are grateful.We also acknowledge the National Center for High-performance Computing for computer time and the use of its facilities.Reference[1]T.Minami,Semicond.Sci.Technol.20(2005)S35–S44.[2]L.Zhao,G.Shao,S.Song,X.Qin,S.Han,Rare Metals30(2011)175–182.[3]V.Bhavanasi,C.B.Singh,D.Datta,V.Singh,K.Shahi,S.Kumar,Opt.Mater.35(2013)1352–1359.[4]C.Huang,M.Wang,Z.Deng,Y.Cao,Q.Liu,Z.Huang,Y.Liu,W.Guo,Q.Huang,J.Mater.Sci.–Mater.Electron21(2010)1221–1227.[5]J.L.Zhao,X.W.Sun,H.Ryu,Y.B.Moon,Opt.Mater.33(2011)768–772.[6]L.Cao,L.P.Zhu,W.F.Chen,Z.Z.Ye,Opt.Mater.35(2013)1293–1296.[7]T.Miyata,Y.Honma,T.Minami,J.Vac.Sci.Technol.A25(2007)1193–1197.[8]X.L.Chen,B.H.Xu,J.M.Xue,Y.Zhao,C.C.Wei,J.Sun,Y.Wang,X.D.Zhang,X.H.Geng,Thin Solid Films515(2007)3753–3759.[9]D.W.Kang,J.Y.Kwon,D.J.Lee,M.K.Han,J.Electrochem.Soc.159(2012)H61–H65.[10]C.David,T.Girardeau, F.Paumier, D.Eyidi, croix,N.Papathanasiou,B.P.Tinkham,P.Gu´erin,M.Marteau,J.Phys.:Condens.Matter23(2011)334209.[11]H.Yang,X.Xu,X.Zhou,Y.Ma,J.Dong,T.Wang,J.Miao,Y.Jiang,J.Mater.Sci.47(2012)6513–6516.[12]A.B.Patil,K.R.Patil,S.K.Pardeshi,J.Solid State Chem.184(2011)3273–3279.[13]S.Yılmaz,J.Nisar,Y.Atasoy,E.McGlynn,R.Ahuja,M.Parlak,E.Bacaksız,Ceram.Int.39(2013)4609–4617.[14]L.Li,W.Wang,H.Liu,X.Liu,Q.Song,S.Ren,J.Phys.Chem.C113(2009)8460–8464.[15]X.Qu,W.Wang,S.Lv,D.Jia,Solid State Commun.151(2011)332–336.[16]G.Ji,Z.Gu,M.Lu,J.Zhou,S.Zhang,Y.Chen,Physica B405(2010)4948–4950.[17]H.C.Wu,Y.C.Peng,C.C.Chen,Opt.Mater.35(2013)509–515.[18]M.D.Segall,P.J.D.Lindan,M.J.Probert,C.J.Pickard,P.J.Hasnip,S.J.Clark,M.C.Payne,J.Phys.:Condens.Matter.14(2002)2717–2744.[19]H.J.Monkhorst,J.D.Pack,Phys.Rev.B13(1976)5188–5192.[20]D.Vanderbilt,Phys.Rev.B41(1990)7892–7895.[21]X.Ma,B.Lu,D.Li,R.Shi,C.Pan,Y.Zhu,J.Phys.Chem.C115(2011)4680–4687.[22]H.C.Wu,Y.C.Peng,T.P.Shen,Materials5(2012)2088–2100.[23]R.D.Vispute,V.Talyansky,S.Choopun,R.P.Sharma,T.Venkatesan,Appl.Phys.Lett.73(1998)348–350.[24]D.R.Lide,CRC Handbook of Chemistry and Physics,87th ed.,Taylor andFrancis,Philadelphia,2006.[25]X.G.Xu,H.L.Yang,Y.Wu,D.L.Zhang,S.Z.Wu,Appl.Phys.Lett.97(2010)232502.[26]A.Janotti, C.G.Van de Walle,Phys.Rev.B:Condens.Matter.76(2007)165202.[27]T.Guo,G.Dong,Q.Chen,X.Diao,F.Gao,J.Phys.Chem.Solids75(2014)42–47.[28]P.V.Kamat,N.M.Dimitrijevic, A.J.Nozik,J.Phys.Chem.93(1989)2873–2875.[29]L.Gao,Y.Zhang,J.M.Zhang,K.W.Xu,Appl.Surf.Sci.257(2011)2498–2502.[30]B.N.Pawar,S.R.Jadkar,M.G.Takwale,J.Phys.Chem.Solids66(2005)1779–1782.[31]R.Chowdhury,S.Adhikari,P.Rees,Physica B405(2010)4763–4767.Table2Average transmittance of BZO with varying intrinsic defects.UV region(%)Visible region(%)ZnO65.689.2B Zn91.175.6B Zn V Zn68.186.8B Zn V O52.053.2B Zn Zn i59.256.9Y.-C.Peng et al./Optical Materials39(2015)34–3939。
PhysRevB.81.153104
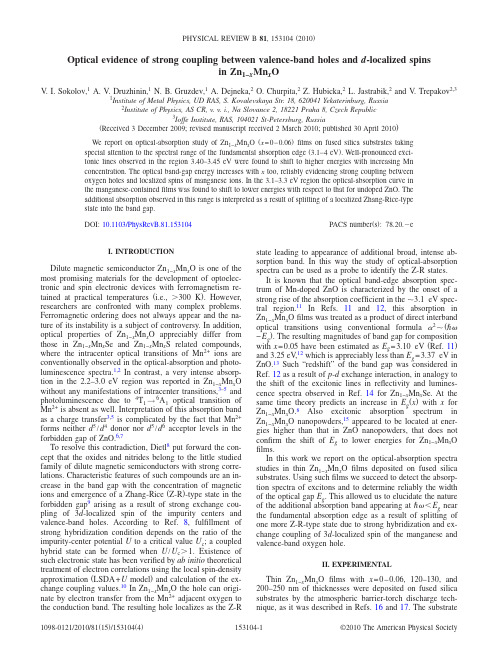
Optical evidence of strong coupling between valence-band holes and d-localized spinsin Zn1−x Mn x OV.I.Sokolov,1A.V.Druzhinin,1N.B.Gruzdev,1A.Dejneka,2O.Churpita,2Z.Hubicka,2L.Jastrabik,2and V.Trepakov2,3 1Institute of Metal Physics,UD RAS,S.Kovalevskaya Str.18,620041Yekaterinburg,Russia2Institute of Physics,AS CR,v.v.i.,Na Slovance2,18221Praha8,Czech Republic3Ioffe Institute,RAS,194021St-Petersburg,Russia͑Received3December2009;revised manuscript received2March2010;published30April2010͒We report on optical-absorption study of Zn1−x Mn x O͑x=0–0.06͒films on fused silica substrates takingspecial attention to the spectral range of the fundamental absorption edge͑3.1–4eV͒.Well-pronounced exci-tonic lines observed in the region3.40–3.45eV were found to shift to higher energies with increasing Mnconcentration.The optical band-gap energy increases with x too,reliably evidencing strong coupling betweenoxygen holes and localized spins of manganese ions.In the3.1–3.3eV region the optical-absorption curve inthe manganese-containedfilms was found to shift to lower energies with respect to that for undoped ZnO.Theadditional absorption observed in this range is interpreted as a result of splitting of a localized Zhang-Rice-typestate into the band gap.DOI:10.1103/PhysRevB.81.153104PACS number͑s͒:78.20.ϪeI.INTRODUCTIONDilute magnetic semiconductor Zn1−x Mn x O is one of themost promising materials for the development of optoelec-tronic and spin electronic devices with ferromagnetism re-tained at practical temperatures͑i.e.,Ͼ300K͒.However,researchers are confronted with many complex problems.Ferromagnetic ordering does not always appear and the na-ture of its instability is a subject of controversy.In addition,optical properties of Zn1−x Mn x O appreciably differ fromthose in Zn1−x Mn x Se and Zn1−x Mn x S related compounds,where the intracenter optical transitions of Mn2+ions areconventionally observed in the optical-absorption and photo-luminescence spectra.1,2In contrast,a very intense absorp-tion in the2.2–3.0eV region was reported in Zn1−x Mn x Owithout any manifestations of intracenter transitions,3–5and photoluminescence due to4T1→6A1optical transition of Mn2+is absent as well.Interpretation of this absorption bandas a charge transfer3,5is complicated by the fact that Mn2+forms neither d5/d4donor nor d5/d6acceptor levels in the forbidden gap of ZnO.6,7To resolve this contradiction,Dietl8put forward the con-cept that the oxides and nitrides belong to the little studiedfamily of dilute magnetic semiconductors with strong corre-lations.Characteristic features of such compounds are an in-crease in the band gap with the concentration of magneticions and emergence of a Zhang-Rice͑Z-R͒-type state in theforbidden gap9arising as a result of strong exchange cou-pling of3d-localized spin of the impurity centers andvalence-band holes.According to Ref.8,fulfillment ofstrong hybridization condition depends on the ratio of theimpurity-center potential U to a critical value U c;a coupledhybrid state can be formed when U/U cϾ1.Existence of such electronic state has been verified by ab initio theoretical treatment of electron correlations using the local spin-density approximation͑LSDA+U model͒and calculation of the ex-change coupling values.10In Zn1−x Mn x O the hole can origi-nate by electron transfer from the Mn2+adjacent oxygen to the conduction band.The resulting hole localizes as the Z-R state leading to appearance of additional broad,intense ab-sorption band.In this way the study of optical-absorptionspectra can be used as a probe to identify the Z-R states.It is known that the optical band-edge absorption spec-trum of Mn-doped ZnO is characterized by the onset of astrong rise of the absorption coefficient in theϳ3.1eV spec-tral region.11In Refs.11and12,this absorption inZn1−x Mn x Ofilms was treated as a product of direct interbandoptical transitions using conventional formula␣2ϳ͑ប−E g͒.The resulting magnitudes of band gap for composition with x=0.05have been estimated as E g=3.10eV͑Ref.11͒and3.25eV,12which is appreciably less than E g=3.37eV inZnO.13Such“redshift”of the band gap was considered inRef.12as a result of p-d exchange interaction,in analogy tothe shift of the excitonic lines in reflectivity and lumines-cence spectra observed in Ref.14for Zn1−x Mn x Se.At thesame time theory predicts an increase in E g͑x͒with x for Zn1−x Mn x O.8Also excitonic absorption spectrum in Zn1−x Mn x O nanopowders,15appeared to be located at ener-gies higher than that in ZnO nanopowders,that does not confirm the shift of E g to lower energies for Zn1−x Mn x O films.In this work we report on the optical-absorption spectrastudies in thin Zn1−x Mn x Ofilms deposited on fused silicaing suchfilms we succeed to detect the absorp-tion spectra of excitons and to determine reliably the widthof the optical gap E g.This allowed us to elucidate the natureof the additional absorption band appearing atបϽE g near the fundamental absorption edge as a result of splitting of one more Z-R-type state due to strong hybridization and ex-change coupling of3d-localized spin of the manganese and valence-band oxygen hole.II.EXPERIMENTALThin Zn1−x Mn x Ofilms with x=0–0.06,120–130,and 200–250nm of thicknesses were deposited on fused silica substrates by the atmospheric barrier-torch discharge tech-nique,as it was described in Refs.16and17.The substratePHYSICAL REVIEW B81,153104͑2010͒temperature during deposition was kept at ϳ200°C.Mn content was controlled by measurements of Mn and Zn emis-sion ͑em =4031Åand 4810Å,respectively ͒of plasma during deposition and crosschecked by the postgown EPMA ͑JEOL JXA-733device with Kevex Delta Class V mi-croanalyser ͒analysis with accuracy Ϯ0.3%.X-ray diffrac-tion ͑XRD ͒studies were performed with a Panalytical X’PertMRD Pro diffractometer with Eulerian cradle using Cu K ␣radiation ͑em =1.5405Å͒in the parallel beam ge-ometry.XRD profiles were fitted with the Pearson VII func-tion by the DIFPATAN code.18Correction for instrumental broadening was performed using NIST LaB6standard and V oigt function method.19Optical absorption within the 1.2–6.5eV spectral region was measured in unpolarized light at room temperature using a Shimadzu UV-2401PC spectrophotometer.The bare silica substrate and Zn 1−x Mn x O film on silica substrate were mounted into the reference and test channel,respectively.The optical density ␣d ͑product of optical-absorption coeffi-cient and film thickness ͒was calculated without taking into account multiple reflections as ␣d =ln ͑I 0/I ͒,where I 0and I are intensities of light passed through bare substrate and film/substrate structure.III.RESULTS AND DISCUSSIONFigure 1presents XRD pattern for ZnO and Zn 0.95Mn 0.05O films,as an example.All obtained films re-vealed crystalline block structure with dominant ͑002͒orien-tation of blocks’optical C -axes aligned normal to substrate.Observed reflexes correspond to wurtzite structure evi-dencing absence of extraneous phases.Both pure and Mn-doped ZnO films appeared to be compressively strained with 0.2%of strain,s =͑a 0−a S ͒/a 0,where a 0and a S are the lattice parameters of nonstrained and strained films.The analysis reveals that the value of compressive strain is controlled pre-dominantly by stresses,but not by presence of Mn ͑at least for Mn concentrations used ͒.Figure 2presents the optical-absorption spectra for Zn 1−x Mn x O films.A wide absorption line is seen in the re-gion of the band edge ͑Fig.2͒,whose energy appears to be shifted by about 100meV to higher energies in comparison with the excitonic line in ZnO ͓ϳ3.31eV at T =300K ͑Ref.13͔͒.The line shift is very likely connected with the com-pressive strain of Zn 1−x Mn x O films mentioned above.The wide and shifted line has been observed earlier in ZnO film on sapphire substrate 20,21and was identified as a shift of the excitonic line due to compressive strain of Zn 1−x Mn x O films.21The inset represents spectra of this line obtained in ZnO at T =300K and 77.3K.It is seen that the excitonic line is narrowed,split into two components and shifted to higher energies on lowering the temperature,clearly evidenc-ing its excitonic nature.The first line is a sum of A and B excitons,the second one is the C exciton appearing due to disorientation of blocks forming the film.16Analogous tem-perature evolutions have been reported for a wide excitonic line in ZnO nanocrystals.15As the concentration of Mn impurity increases,the exci-tonic line additionally broadens and shifts to higher energies.Figure 3shows the actual Mn concentration shift of the ex-citonic line energy បexc .It is seen that the increase in Mn concentration leads to not only changes in the excitonic spec-trum but also exhibits enhancement of the band-gap energy in Zn 1−x Mn x O films ͑band-gap magnitude can be estimated as E g =បexc +E exc ,where E exc =60meV is the excitonic binding energy 13͒.It is known that the band-gap magnitude in ZnO-MnO system varies from 3.37eV in ZnO up to 3.8eV in MnO.22According to the theoretical analysis 8per-formed taking into account inversion of ⌫7and ⌫9valence subbands in ZnO,23,24strong coupling of manganese spin and p states of valence band leads to appearance of a positiveI n t e n s i t y (c o u n t )2θ(degree)FIG.1.XRD pattern of ZnO ͑left scale ͒and Zn 0.95Mn 0.05O ͑right scale ͒films.E n e r g y (eV)αdFIG.2.Exciton absorption spectra of compressed Zn 1−x Mn x O films:1—x =0%,2—x =1.8%,and 3—x =5%;film thickness:d =͑120–130͒nm;and T =300K.Inset shows excitonic absorption lines for compressed ZnO:1—T =300K and 4—T =77.3K.01234563.403.413.423.433.44E n e r g y (e V )X (%)FIG.3.Mn-concentration dependence of the excitonic line en-ergies for Zn 1−x Mn x O films.additive in optical absorption of Zn 1−x Mn x O at small x val-ues.The sum of two contributions at sufficiently small x results in an increase in E g magnitude.The rise of the band-gap magnitude with the admixture of the second component E g ͑x ͒has been observed in Zn 1−x Co x O ͑Ref.25͒for exci-tonic lines registered in the reflection spectra at 1.6K.The shift of the excitonic line to higher energies was observed in Zn 0.99Fe 0.01O,too.20In the case of weak d -p coupling the additive into the band gap change appeared to be negative.8In this case the band-gap value E g decreases with x for x Յ0.1,as it was found for Zn 1−x Mn x Se ͑Fig.6in Ref.14͒and for Cd 1−x Mn x S.26Therefore,the observed rise of the E g ͑x ͒value with Mn addition provides the reliable experimental proof that the strong hybridization condition U /U c Ͼ1in Zn 1−x Mn x O is fulfilled.Figure 4presents optical absorption in Zn 1−x Mn x O films recorded in the spectral region 3.1–3.3eV .It is seen that the onset of optical absorption in Zn 1−x Mn x O films emerges at lower energies than that for ZnO ones.Analogous shift had been observed earlier in the spectrum of the photoluminescence excitation over deep im-purity centers in Zn 1−x Mn x O for Ref.15.Unlike authors of Refs.11and 12,we assume that addi-tional absorption of Zn 1−x Mn x O ͑in comparison with ZnO ͒in the 3.1–3.3eV range is a result of pushing the Z-R-type states out of valence band to the forbidden gap.9The essence of this state consists of localization of the valence-band hole within the first coordination sphere on the oxygen ions as a result of strong exchange interaction of manganese and hole spins.Such electronic state is similar to the Z-R-type state originally considered for La 2CuO 4oxidesuperconductor.9This state is a singlet one,because in La 2CuO 4the spins of d 9configuration of Cu 2+ion and oxy-gen holes are equal but of opposite direction.The situation is more complex in the case of Zn 1−x Mn x O since the top of valence band is formed by three close subbands:⌫7,⌫9,and ⌫7.23,24In such case we have serious reasons to assume that not only the presence of one deep Z-R-type state is respon-sible for optical absorption in the 2.2–3.0eV spectral region.We assume the presence of another,relatively shallow Z-R-type state too,which has been split off into the gap providing additional absorption in the 3.1–3.3eV region of Zn 1−x Mn x O.Tentatively,using results 11,12,15we estimate the splitting of the second Z-R level from the valence band as 0.12–0.27eV .More reliable determination of the split energy can be performed using more sensitive methods of absorp-tion spectra, e.g.,modulation methods,which are in progress.IV .CONCLUSIONThin Zn 1−x Mn x O films ͑x =0–0.06͒have been sintered and their optical-absorption spectra were investigated.The well-pronounced excitonic absorption lines in the fundamen-tal absorption spectral regions were observed.Position of excitonic absorption lines in Zn 1−x Mn x O films shifts to higher energies with increasing Mn content.This evidences an increase in the E g magnitude with x for small values x and reliably corroborates fulfillment of the strong coupling crite-rion ͑U /U c Ͼ1͒in Zn 1−x Mn x O.The last effect leads to emer-gence of an intense optical-absorption band in the 2.2–3.0eV region due to the presence of the band-gap Z-R-type state.The additional absorption observed in the range of 3.1–3.3eV is interpreted as a result of splitting of one more Z-R-type states into the band gap.ACKNOWLEDGMENTSAuthors thank T.Dietl,V .I.Anisimov,and A.V .Lukoy-anov for useful discussions and V .Valvoda for kind assis-tance in XRD experiments.This work was supported by Czech Grants No.A V0Z10100522of A V CR,No.KJB100100703of GA A V ,No.202/09/J017of GA CR,No.KAN301370701of A V CR,and No.1M06002of MSMT CR and Russian Grants No.08-02-99080r-ofiof RFBR,PP RAS “Quantum Physics of Condensed Matter”,and State Contract No.5162.nger and H.J.Richter,Phys.Rev.146,554͑1966͒.2T.Hoshina and H.Kawai,Jpn.J.Appl.Phys.19,267͑1980͒.3F.W.Kleinlein and R.Helbig,Z.Phys.266,201͑1974͒.4R.Beaulac,P.I.Archer,and D.R.Gamelin,J.Solid State Chem.181,1582͑2008͒.5T.Fukumura,Z.Jin,A.Ohtomo,H.Koinuma,and M.Kawasaki,Appl.Phys.Lett.75,3366͑1999͒.6K.A.Kikoin and V .N.Fleurov,Transition Metal Impurities in Semiconductors:Electronic Structure and Physical Properties ͑World Scientific,Singapore,1994͒,p.349.7T.Dietl,J.Magn.Magn.Mater.272-276,1969͑2004͒.8T.Dietl,Phys.Rev.B 77,085208͑2008͒.9F.C.Zhang and T.M.Rice,Phys.Rev.B 37,3759͑1988͒.10T.Chanier,F.Virot,and R.Hayn,Phys.Rev.B 79,205204͑2009͒.11V .Shinde,T.Gujar,C.Lokhande,R.Mane,and S.-H.Han,3.1253.2500.00.40.8αdEnergy (eV)12FIG.4.Spectral dependence of the optical density ␣d in the 3.1–3.3eV spectral region for Zn 1−x Mn x O,1—ZnO;2—x =0.3–0.5%;film thickness 200–250nm;and T =300K.Mater.Chem.Phys.96,326͑2006͒.12Y.Guo,X.Cao,n,C.Zhao,X.Hue,and Y.Song,J.Phys. Chem.C112,8832͑2008͒.13Zh.L.Wang,J.Phys.:Condens.Matter16,R829͑2004͒.14R.B.Bylsma,W.M.Becker,J.Kossut,U.Debska,and D. Yoder-Short,Phys.Rev.B33,8207͑1986͒.15V.I.Sokolov,A.Ye.Yermakov,M.A.Uimin,A.A.Mysik,V.A.Pustovarov,M.V.Chukichev,and N.B.Gruzdev,J.Lumin.129,1771͑2009͒.16M.Chichina,Z.Hubichka,O.Churpita,and M.Tichy,Plasma Processes Polym.2,501͑2005͒.17Z.Hubicka,M.Cada,M.Sicha,A.Churpita,P.Pokorny,L. Soukup,and L.Jastrabík,Plasma Sources Sci.Technol.11,195͑2002͒.18http://www.xray.cz/priv/kuzel/dofplatan/19R.Kuzel,Jr.,R.Cerny,V.Valvoda,and M.Blomberg,ThinSolid Films247,64͑1994͒.20Z.Jin,T.Fukumura,M.Kaasaki,K.Ando,H.Saito,T.Skiguchi, Y.Z.Yoo,M.Murakami,Y.Matsumoto,T.Hasegawa,and H. Koinuma,Appl.Phys.Lett.78,3824͑2001͒.21J.-M.Chauveau,J.Vives,J.Zuniga-Perez,ügt,M.Teis-seire,C.Deparis,C.Morhain,and B.Vinter,Appl.Phys.Lett.93,231911͑2008͒.d and V.E.Henrich,Phys.Rev.B38,10860͑1988͒. 23K.Shindo,A.Morita,and H.Kamimura,J.Phys.Soc.Jpn.20, 2054͑1965͒.24W.Y.Liang and A.D.Yoffe,Phys.Rev.Lett.20,59͑1968͒. 25W.Pacuski,D.Ferrand,J.Gibert,C.Deparis,J.A.Gaj,P.Ko-ssacki,and C.Morhain,Phys.Rev.B73,035214͑2006͒.26M.Ikeda,K.Itoh,and H.Sato,J.Phys.Soc.Jpn.25,455͑1968͒.。
高温固相法制备ZnMoO_(4):Eu^(3+)荧光粉及其发光性质研究

(b)
5D0 → 7F2
ZnMoO4:xEu3+ λem=617nm
x=0.01 x=0.02 x=0.03 x=0.04 x=0.05
ZnMoO4 在此条件下成功地被制备出来,并且没有杂相生成。 此外,Eu3+ 的引入并没有引起基质晶格明显的改变,这是因 为 Zn2+(0.88Å)和 Eu3+(1.087Å)离子半径和配位环境相似, 以及掺杂浓度并不是很高,所以稀土 Eu3+ 能够成功掺杂到基 质 ZnMoO4 中。
收稿日期 :2021–03–16 基金项目 :2021 年 度 吉 林 省 教 育 厅“ 十 四 五 ” 科 研 规 划 项 目
(JJKH20210542KJ) 作者简介 :吴宏越(1987—),男,吉林龙井人,讲师,主要研究方
向为稀土发光材料。 通讯作者 :李琳琳(1987—),女,吉林通化人,副教授,主要研究
此仪器装备的氙灯是 150W。所有测试都在室温下进行。 ·95·
第47卷第6期
2021年6月
研究与开发
Research and Development
化工设计通讯
Chemical Engineering Design Communications
3 结果与讨论 3.1 所制备样品的物相分析
图 1 为 最 大 掺 杂 浓 度 样 品 ZnMoO4 :0.05Eu3+ 和 ZnMoO4 标准粉末 X 射线衍射数据(PDF#72-1486)的 XRD 图谱。将 合 成 的 样 品 ZnMoO4 :0.05Eu3+XRD 衍 射 峰 图 谱 与 ZnMoO4 的标准衍射图谱进行对比,可以看出两者匹配得很好,得知
在近些年的研究中,制备荧光粉的方法日渐多样化,目 前常用的方法有 :高温固相合成法、微波热合成法、共沉淀 合成法等。不同的制备条件和方法会直接影响制备出发光材 料的使用效果和决定它是否可以普遍应用。本文选用的是高 温固相法来制备荧光粉,应用该方法制备的荧光粉优点很多 性能稳定,发光强度高,且制备方法既简单环保又利于工业 上大批生产,因此得到了广泛应用 [4]。
玻璃纤维织物表面Ni-P合金涂层的制备及其导电性能研究

玻璃纤维织物表面Ni-P合金涂层的制备及其导电性能研究秦文峰;郭荣辉;梁科;唐庆如【摘要】采用化学镀的方法在玻璃纤维织物试样表面制备了Ni-P合金沉积的非晶镀层.利用扫描电子显微镜和X射线观察及分析了镀层的表面形貌与表面结构,研究了硫酸镍的浓度对非晶镀层的沉积速率、沉积量以及导电性能的影响.结果表明,随着硫酸镍浓度的增加,沉积速率和沉积量逐渐升高,而镀层方阻值逐渐降低,导电性增加.当硫酸镍浓度20 g/L时,玻璃纤维织物镀层方阻值为1.35方,具有良好的导电性.【期刊名称】《科学技术与工程》【年(卷),期】2015(015)035【总页数】4页(P149-152)【关键词】玻璃纤维;化学镀;Ni-P合金;无钯活化;导电性【作者】秦文峰;郭荣辉;梁科;唐庆如【作者单位】中国民航飞行学院航空工程学院,广汉618307;四川大学轻纺与食品学院,成都610065;中国民航飞行学院航空工程学院,广汉618307;中国民航飞行学院航空工程学院,广汉618307【正文语种】中文【中图分类】TG153.1玻璃纤维具有耐高温、抗化学腐蚀、强度高、模量高等一系列优良性能,作为树脂基复合材料重要的增强材料,已在航空、航天、舰船、化工冶金等领域得到了充分应用[1—3]。
通过现代化学物理方法改性玻璃纤维,赋予玻璃纤维新的功能,如导电、色彩、发光、传感等,可以进一步拓展玻璃纤维的应用领域[4—8]。
导电玻璃纤维是通过物理或化学的方法在玻璃纤维表面涂覆一层导电层,使其具有优异的导电性,在屏蔽材料、电热材料、隐身材料等方面具有潜在的应用[9—11]。
碳纤维增强复合材料由于具有高的比强度、比刚度和抗疲劳性能在飞机上应用越来越广泛,然而其差的导电性能更容易遭受雷击损失,导电玻璃纤维常铺覆在碳纤维增强复合材料结构表面以抗雷击。
通常导电玻璃纤维可通过纤维中混入抗静电剂使纤维表面具有离子性而提高其导电性,或对纤维表面改性镀上一层导电金属涂层,以提高导电率。
2016-Crystallization Behavior and Properties of B-Doped ZnO Thin Films Prepared by Sol-Gel Method

CHINESE JOURNAL OF CHEMICAL PHYSICS JANUARY25,2016ARTICLECrystallization Behavior and Properties of B-Doped ZnO Thin Films Prepared by Sol-Gel Method with Different Pyrolysis Temperatures Bin Wen a,Chao-qian Liu a∗,Nan Wang a,Hua-lin Wang a,Shi-min Liu a,Wei-wei Jiang a,Wan-yu Ding a,Wei-dong Fei b,c∗,Wei-ping Chai aa.Engineering Research Center of Optoelectronic Materials&Devices,School of Materials Science andEngineering,Dalian Jiaotong University,Dalian116028,Chinab.School of Materials Science and Engineering,Harbin Institute of Technology,Harbin150001,Chinac.School of Mechanical Engineering,Qinghai University,Xining810016,China(Dated:Received on June11,2015;Accepted on August14,2015)Boron-doped zinc oxide transparent(BZO)films were prepared by sol-gel method.The effectof pyrolysis temperature on the crystallization behavior and properties was systematicallyinvestigated.XRD patterns revealed that the BZOfilms had wurtzite structure with apreferential growth orientation along the c-axis.With the increase of pyrolysis temperature,the particle size and surface roughness of the BZOfilms increased,suggesting that pyrolysistemperature is the critical factor for determining the crystallization behavior of the BZOfilms.Moreover,the carrier concentration and the carrier mobility increased with increasingthe pyrolysis temperature,and the mean transmittance for everyfilm is over90%in thevisible range.Key words:Transparent conduction oxide,Thinfilm,Boron-doped ZnO,Pyrolysis tem-perature,Sol-gelI.INTRODUCTIONZinc oxide(ZnO)is a direct wide band gap semicon-ductor with E g=3.37eV,and is naturally an n-type semiconductor due to oxygen vacancies and interstitial zinc atoms.In addition,ZnO is abundant,nontoxic, and stable in reducing atmosphere.It is considered as a promising candidate to replace indium tin oxide as transparent conducting electrodes in solar cell devices andflat panel display[1−3].To enhance the electri-cal properties of ZnO,various atoms(e.g.Al,In,Ga, B,F)have been employed as donors[4−7].Wherein, boron-doped ZnO has not only high transparency over the visible and near-infrared range,and low electrical resistivity,but also excellent light scattering property [8,9].Therefore,B-doped ZnO thinfilm has attracted some attention in recent years.Generally,B-doped zinc oxide(BZO)thinfilms were primarily synthesized by chemical vapor deposition [10−15]and spray pyrolysis[16,17].Also,there are a few studies on the BZO thinfilms deposited by sol-gel method[18−23].The sol-gel process has many advan-tages in preparing thinfilms,including low cost,excel-lent compositional control,easy handling and feasibility of deposition on large-area substrate[24].In previous studies on the BZOfilms prepared by sol-gel process,∗Authors to whom correspondence should be addressed.E-mail: cqliu@,wdfei@ the effects of annealing temperature[18],doping con-centration of boron[19−23],and pH of precursor sol [1]on the crystallization,microstructure,electrical and optical properties of BZOfilms were reported system-atically.To the best of our knowledge,the effect of py-rolysis temperature on the properties of BZOfilm has not been reported.In this work,BZOfilms were pre-pared by sol-gel spin coating and pyrolyzed at different temperatures,and the dependence of the properties of the BZOfilms on the pyrolysis temperatures was inves-tigated.II.EXPERIMENTSBoron-doped ZnO precursor solution was prepared from zinc acetate di-hydrate(Zn(Ac)2·2H2O,AR)and boric acid(H3BO3,GR)as sources for Zn and B,where the B/Zn atomic ratio wasfixed at0.5at.%.The de-tailed solution preparation was described in our previ-ous work[23].Thefilms were prepared by spin-coating the solution onto cleaned quartz glass substrates under 2000r/min for10s atfirst.Then,each layer was di-rectly put into a homemade tube furnace at350−500◦C for2min to evaporate the solvent and pyrolyze organ-ics,where the heating time from room temperature to pyrolysis temperature was0.5min.The details of the homemade tube furnace were also described in our pre-vious work[25].The spin-coating pyrolyzing procedure was repeated5times for eachfilm.Finally,the de-positedfilms were annealed at500◦C for5min in ArDOI:10.1063/1674-0068/29/cjcp1506116c⃝2016Chinese Physical SocietyChin.J.Chem.Phys.Bin Wen et al. atmosphere.The thickness of all thefilms was about160nm measured by a step profiler(Veeco Dektak6M).The crystal structure of thefilms was analyzed byan X-ray diffractometer(PANalytical Empyrean)withCu Kα1radiation(λ=1.54056˚A)and a G¨o bel mirror at40kV and40mA,where the step size and the count-ing time were0.05◦and0.5s respectively.The surfacemorphologies of the thinfilms were characterized usingan atomic force microscope(AFM,Bruker Multimode8).A Hall effect measurement system(Swing HALL8800)was employed to measure the electrical propertiesof thefilms.Optical transmittance measurements wereperformed by an ultraviolet-visible spectrophotometer(Hitachi U-3310)in the wavelength range from300nmto900nm.III.RESULT AND DISCUSSIONA.StructureThe XRD scan patterns of the BZO thinfilms py-rolyzed at different temperatures are shown in Fig.1(a).It is clear that thefilms exhibit a single-phase hexagonalstructure(wurtzite ZnO JCPDS No.36-1451)and havethe preferred orientation of(002)(i.e.,c-axis preferredorientation).Moreover,the intensity of(002)reflectionwas enhanced with increasing the pyrolysis tempera-ture,suggesting that the pyrolysis temperature is thecritical factor determining the crystallization behaviorof the BZOfilms in the present work.To estimate theaverage grain size of the samples,the Scherers equationis employed:D=0.89λβcosθ(1)where D is the grain size,λis the X-ray wavelength of1.54056˚A,θis Bragg diffraction angle,andβis the full-width at half-maximum(FWHM)of the diffraction peak corresponding to2θ.The FWHM values and cal-culated average grain sizes of thefilms pyrolyzed at dif-ferent temperatures are shown in Fig.1(b).It is clear that the grain size increased with increasing the pyrol-ysis temperature.B.MorphologyIn order to understand deeply the influence of pyrol-ysis temperature on the crystallization behavior of the BZOfilms,the surface morphologies of thefilms were characterized by AFM in contact mode and are shown in Fig.2.From the two-dimensional AFM images,the combined tendency of the particles in thefilms can be clearly observed with increasing pyrolysis temperature. This result also suggests that the pyrolysis temperature is the critical factor for determining the crystallization behavior of the BZOfilms.FIG.1(a)XRD2θscan patterns and(b)FWHM valuesand average crystallite sizes of the BZOfilms deposited atdifferent pyrolysis temperatures.The influence of the pyrolysis temperature on thegrowth behavior of the sol-gel derived BZOfilms canbe understood on the basis of the understanding ofthe pyrolysis process.Primarily,the source material ofZn(Ac)2·2H2O involved in two chemical reaction pro-cesses in the precursor solution[26].Thefirst was areversible hydrolysis reaction:Zn(CH3COO)2·2H2O↔(ZnCH3COO)++CH3COO−+2H++2OH−(2) Then hydrolysis products reacted with mo-noethanolamine in the solvent of2-methoxyethanol through the following chemical reaction:CH3COOZn++CH3COO−+2H++2OH−+NH2CH2CH2OH→Zn(OH)2+CH3COONH2+CH3COOCH2CH3+H2O(3) Evidently,the reaction resultant of Zn(OH)2in the precursor solution is the source of the primary sol par-ticles,and then can form the gel network in the spin-coating processes and can be adsorbed onto the sub-strate to form precursorfilm.According to the previ-ous studies[27,28],it can be known that the organic solvents and reaction resultants in the precursorfilmDOI:10.1063/1674-0068/29/cjcp1506116c⃝2016Chinese Physical SocietyChin.J.Chem.Phys.B-doped ZnO Thin Films(a)(c)(e)(b)(d)(g)(f)(h)0.0 1.0 µm-12.3 nm11.6 nm-20.0 nm12.9 nm13.1 nm16.0 nm-12.3 nm-12.2 nm0.0 1.0 µm0.0 1.0 µm0.0 1.0 µm−0.411.6 0.20.40.60.80.312.9 0.20.40.60.80.20.40.60.80.20.40.60.80.413.1 -0.2 16.0 nm µmµmµmµm0.20.40.60.80.20.40.60.80.20.40.60.80.20.40.60.8nm nm nm FIG.2Two-and three-dimensional AFM images of the BZO films deposited at (a,b)350◦C,(c,d)400◦C,(e,f)450◦C,(g,h)500◦Ccan be entirely evaporated or pyrolyzed at the pyrolysis temperature below 350◦C.Moreover,the decomposi-tion temperatures of Zn(OH)2and H 3BO 3are about 125and 185◦C,respectively.The above discussion in-dicates that there should not be any residual organic component or other volatile matter in the as-pyrolyzed films.Kang et al .[29]considered that the residual or-ganic components in the as-pyrolyzed films would sup-press the crystal growth of the films.Therefore,in our present work,the effect on the particle size in the an-nealed films should be controlled mainly by the pyroly-sis temperature.As for the further understanding about the effect of the pyrolysis temperature on the growth behavior of the sol-gel derived BZO films,it is described as the follow-ing.It is clear that the particle size is very small and less than 20nm in diameter in the film pyrolyzed at 350◦C shown in Fig.2(a).Thus it can be reasonably deduced that the sol particle size in the precursor solu-tion should be smaller than 20nm.As is well known,generally,the smaller the nanoparticle size is,the higher the specific surface energy of the nanoparticle is.There-fore,in the pyrolysis process for preparing the BZO films,the sol particles in the precursor films were easy to merge,and the merging process was susceptible to the pyrolysis temperature.However,the grain growth in the as-pyrolyzed films was difficult in the post anneal-ing process at 500◦C for 5min.Generally,the grain growth due to post annealing corresponds to a recrys-tallization process.When the annealing temperature and time is not high or long enough,the grain growth is difficult.Therefore,although the as-pyrolyzed BZO films were annealed at 500◦C for 5min,the particle size in the films was still mainly controlled by thepyrolysisFIG.3RMS roughness of the BZO films deposited at dif-ferent pyrolysis temperatures.temperature.From that discussed above,we think the pyrolysis temperature is the critical factor affecting the crystallization behavior of the BZO films.The root-mean-square (RMS)roughness of the BZO thin films is shown in Fig.3.It can be seen that the RMS roughness of the thin films increased with increasing py-rolysis ly,the RMS roughness value of the BZO film pyrolyzed at 350◦C was about 2.5nm,and then that of the BZO film pyrolyzed at 500◦C in-creased to about 4.9nm.Evidently,the increase of the RMS roughness originated from the grain growth with increasing pyrolysis temperature.C.Electrical propertiesHall measurements were carried out at room tem-perature to investigate the electrical properties of BZODOI:10.1063/1674-0068/29/cjcp1506116c ⃝2016Chinese Physical SocietyChin.J.Chem.Phys.Bin Wen et al.FIG.4Electrical properties of the BZOfilms as a function of the pyrolysis temperature.films.The resistivity,Hall carrier concentration,and mobility of thefilms as a function of the pyrolysis tem-peratures are presented in Fig.4.When the pyrolysis temperature was raised from350◦C to500◦C,the carrier concentration of the BZOfilms increased from 5.27×1018cm−3to1.77×1019cm−3,and the carrier mo-bility increased from2.04cm2/(V·s)to7.58cm2/(V·s). The increases in the carrier concentration and mobility should be attributed to the crystallization enhancement with increasing pyrolysis temperature.Logically,when the crystalline state of the sample of B-doped ZnO is poor,there will be a large amount of amorphous ZnO and boron oxide in the sample.The crystallization en-hancement means more B atoms were doped into the crystal lattice of ZnO to replace the Zn2+,and then more free charge carrier was released.As a result,the carrier concentration increased with increasing pyroly-sis temperature.Moreover,the crystallization enhance-ment also means the defect concentration in thefilms decreased with increasing pyrolysis temperature.Cor-respondingly,the carrier mobility of the BZOfilms in-creased with increasing pyrolysis temperature.At the pyrolysis temperature of500◦C,the BZOfilm has the lowest resistivity(4.64×10⁻²Ω·cm)in the present work.D.Optical propertiesThe transmittance spectra(T)of the BZOfilms were measured at room temperature by an ultraviolet-visible spectrophotometer,and are shown in Fig.5(a).All the transmittance spectra show mean values higher than 90%in the visible range.Moreover,it can be observed that the mean transmittances of thefilms in the visi-ble range arefluctuant with pyrolysis temperature.The mean transmittance of thefilm pyrolyzed at350◦C was lower than that of thefilm pyrolyzed at400◦C in the visible range,which may be attributed to the difference in the crystalline states of the twofilms.According to the calculated grain size shown in Fig.1(b)and the two-dimensional AFM images shown in Fig.2,the crystalline state of thefilm pyrolyzed at350◦C was slightly weaker than that of thefilm pyrolyzed at400◦C.Therefore, the defect concentration in the former was higher than that in the latter,and then the mean transmittance of the former was lower than that of the latter in the visible range.When the the pyrolysis temperature ex-ceeded400◦C,the mean transmittance decreased with increasing pyrolysis temperature,which should be due to the increase of carrier concentration with increasing pyrolysis temperature.Generally,the higher the free carrier concentration is,the more serious the free car-rier absorption and reflection in the visible range are. Therefore,according to the Hall measurement results, the mean transmittance of transmittance of thefilms pyrolyzed at higher temperature is lower in the visible range.Generally,boron-doped ZnO is considered as a direct energy gap semiconductor,thus the relationship among absorption coefficient,photon energy,and optical band gap is(αhν)2=A(hν−E g)(4) where A is a constant for a direct transition,hνis pho-ton energy,αis the optical absorption coefficient,and E g is the optical energy gap.To identifyαfor the BZO films,Lambert’s law is used:α=1dln1T(5)where d is thefilm thickness and T is the transmit-tance spectra.The E g was obtained by extrapolating downwards the corresponding straight lines till the in-tersection with energy axis,as shown in Fig.5(b).The determined optical band gaps are shown in the inset of Fig.5(b).The slight blue-shift in optical energy gap is clear with increasing the pyrolysis temperature.The in-crease in optical band gap of the BZO thinfilms should be attributed to Burstein-Moss effect.IV.CONCLUSIONWe have investigated the effect of pyrolysis temper-ature on the crystallization behavior,electrical and optical properties of sol-gel-derived boron-doped ZnO (BZO)films,and found that pyrolysis temperature was a critical factor affecting the crystallization behavior of the sol-gel-derived BZOfilms.XRD patterns revealed that all the BZOfilms had wurtzite structure with a preferential growth orientation along the c-axis.With increasing the pyrolysis temperature,the grain size ofDOI:10.1063/1674-0068/29/cjcp1506116c⃝2016Chinese Physical SocietyChin.J.Chem.Phys.B-doped ZnO Thin FilmsFIG.5(a)Transmittance spectra and(b)(αhν)2versus hνplot of the BZOfilms deposited at different pyrolysis temperatures.Inset:the optical band gap of thefilms.the BZOfilms increased,and the RMS roughness of thefilms also increased.The mean transmittance for everyfilm was over90%in the visible range,and the optical band edge of the BZOfilms exhibited blue shift with increasing pyrolysis temperature.Moreover,with increasing pyrolysis temperature,the carrier concentra-tion and the carrier mobility increased.V.ACKNOWLEDGMENTSThis work was supported by the National Natural Sci-ence Foundation of China(No.51302024,No.51002018 and No.51472039),the Program for Liaoning Excel-lent Talents in University(No.LJQ2012038),the Higher Specialized Research Fund for the Doctoral Program (No.20122124110004),the Project of Education Depart-ment of Liaoning Province(No.L2013179),the Project of Open Research Foundation of State Key Laboratory of Advanced Technology for Float Glass(No.KF1301-01),the Dalian Science and Technology Plan Project (No.2011A15GX025),the Dalian Science and Technol-ogy Plan Project(No.2010J21DW008),and the Qinghai Province Science and Technology Project(No.2012-Z-701).[1]B.Houng, C.L.Huang,and S.Y.Tsai,J.Cryst.Growth307,328(2007).[2]A.Banejee and G.Guha,J.Appl.Phys.69,1030(1991).[3]J.Y.Liu,X.X.Yu,G.H.Zhang,Y.K.Wu,K.Zhang,N.Pan,and X.P.Wang,Chin.J.Chem.Phys.26,225 (2013).[4]Y.S.Kim and W.P.Tai,Appl.Surf.Sci.253,4911(2007).[5]J.C.Wang,F.C.Cheng,Y.T.Liang,H.I.Chen,C.Y.Tsai,C.H.Fang,and T.E.Nee,Nanoscale Res.Lett.7,270(2012).[6]N.A.Estrich,D.H.Hook,A.N.Smith,J.T.Leonard,ughlin,and J.P.Maria,J.Appl.Phys.113,233703(2013).[7]J.Wen,C.Y.Zuo,M.Xu,C.Zhong,and K.Qi,Eur.Phys.J.B80,25(2011).[8]S.Fa¨y,J Steinhauser,N.Oliveira,E.V.Sauvain,andC.Ballif,Thin Solid Films515,8558(2007).[9]X.G.Xu and H.L.Yang,Appl.Phys.Lett.97,232502(2010).[10]G.Kim,J.Bang,Y.Kim,and S.K.Rout,Appl.Phys.A97,821(2009).[11]X.L.Chen,B.H.Xu,J.M.Xue,Y.Zhao,C.C.Wei,J.Sun,Y.Wang,X.D.Zhang,and X.H.Geng,Thin Solid Films515,3753(2007).[12]S.Y.Myong,J.Steinhauser,R.Schluchter,S.Fay,E.V.Sauvain,A.Shah,C.Ballif,and A.Rufenacht,Sol.Energy Mater.Sol.Cells91,1269(2007).[13]J.Hu and R.G.Gordon,J.Electrochem.Soc.139,2014(1992).[14]W.W.Wenas,A.Yamada,and K.Takahashi,J.Appl.Phys.70,7119(1991).[15]W.W.Wenas,A.Yamada,M.Konagai,and K.Taka-hashi,Jpn.J.Appl.Phys.30,L441(1991).[16]B.N.Pawar,S.R.Jadkar,and M.G.Takwale,J.Phys.Chem.Solids66,1779(2005).[17]B.J.Lokhande,P.S.Patil,and M.D.Uplane,PhysicaB302,59(2001).[18]V.Kumar,R.G.Singh,F.Singh,and L.P.Purohit,J.Alloy Compd.544,120(2012).[19]M.Caglara,S.Ilican,Y.Caglar,and F.Yakuphanoglu,pd.509,3177(2011).[20]R.B.H.Tahar and N.B.H.Tahar,J.Mater.Sci.40,5285(2005).[21]S.Jana, A.S.Vuk, A.Mallick, B.Orel,and P.K.Biswas,Mater.Res.Bull.46,2392(2011).[22]V.Kumar,R.G.Singh,L.P.Purohit,and R.M.Mehra,J.Mater.Sci.Technol.27,481(2011).[23]B.Wen,C.Q.Liu,W.D.Fei,H.L.Wang,S.M.Liu,N.Wang,and W.P.Chai,Chem.Res.Chin.Univ.30, 509(2014).[24]H.H.Huang,B.Orler,and G.L.Wilkes,Polym.Bull.14,557(1985).[25]N.Wang,C.Q.Liu,B.Wen,H.L.Wang,S.M.Liu,and W.P.Chai,Mater.Lett.122,269(2014).[26]A. E.Jim´e nez-Gonz´a lez,J. A.Soto Urueta,and R.Su´a rez-Parra,J.Cryst.Growth192,430(1998). [27]S.Ilican,Y.Caglar,and M.Caglar,J.Optoelectron.Adv.Mater.10,2578(2008).[28]Y.Liao,X.Zhou,X.Xie,and Q.Yu,J.Mater.Sci.Mater.Electron.24,4427(2013).[29]B.A.Kang,K.S.Hwang,and J.H.Jeong,J.Sol-GelSci.Technol.43,145(2007).DOI:10.1063/1674-0068/29/cjcp1506116c⃝2016Chinese Physical Society。
- 1、下载文档前请自行甄别文档内容的完整性,平台不提供额外的编辑、内容补充、找答案等附加服务。
- 2、"仅部分预览"的文档,不可在线预览部分如存在完整性等问题,可反馈申请退款(可完整预览的文档不适用该条件!)。
- 3、如文档侵犯您的权益,请联系客服反馈,我们会尽快为您处理(人工客服工作时间:9:00-18:30)。
Photoluminescence study of Sb-doped ZnO films deposited by a closed tube CVT techniqueHeqiu Zhang *,Lizhong Hu,ZiWen Zhao,Jinxue Ma,Yu Qiu,Bin Wang,Hongwei Liang,Jiming BianSchool of Physics and Optoelectronic Technology,Dalian University of Technology,Dalian 116024,Chinaa r t i c l e i n f oArticle history:Received 21September 2010Received in revised form 8November 2010Accepted 8November 2010Keywords:Sb-doped Zinc oxidePhotoluminescence Closed tubea b s t r a c tSb-doped ZnO film was obtained by CVT technique in a closed tube,and the temperature dependence of its photoluminescence spectrum was also investigated.The Sb-related photoluminescence peaks were observed.The peaks occurred at 3.352,3.312,3.240and 3.168eV were respectively assigned to the neutral acceptor-bound excition,free electron to acceptor transitions,and the first-and second-longi-tudinal optical phonon replicas emissions.The acceptor binding energy was determined to be 125meV,aided by free electron to acceptor transition.Ó2010Elsevier Ltd.All rights reserved.1.IntroductionZnO has been extensively studied for its promising application in optoelectronic devices such as ultraviolet light emitting and laser diodes because of its wide band gap of 3.37eV and large exciton binding energy of 60meV at room temperature [1,2].However,owing to the self-compensation effect resulting from various naturally occurring or spontaneously generated donor defects such as oxygen vacancies or zinc interstitials [3]or hydrogen impurities from the crystal growth environment [4],the ef ficient and reproducible p-type doping is dif ficult and has become the bottleneck limiting the development of ZnO-based devices.Low solubility of the dopant in the ZnO matrix is another obstacle to achieving p-type ZnO.In order to synthesis p-type ZnO,the group I elements (Li,Na,K)[5e 8]and the group-V elements (N,P,As and Sb)[9e 15]have been used as p-type dopants and certain effects have been achieved.Despite these prog-resses,the inexplicit doping mechanism and the inferior stability are still the key issues that hinder the development of ZnO-based opto-electronic devices.Since S.Limpijumnong presented a model for large-sized-mismatched group-V dopant such as arsenic(As)and antimony(Sb),in which an Sb Zn e 2V Zn (or As Zn e 2V Zn )complex was thought to be a shallow acceptor instead of deep Sb O (or As O )acceptor [16].Many groups have made certain progress in ZnO p-type doping with P and As by various growth techniques [12e 15].The Sb-doped p-ZnO thin films have also been grown by electron-cyclotron-reso-nance-assisted molecular-beam epitaxy [15],pulsed laser deposition[17,18],metalorganic chemical vapor deposition [19],sol e gel [20],RF magnetron sputtering [21].In this paper,we fabricated Sb-doped ZnO thin films on c-plane sapphires by a closed tube CVT technique and investigated their low temperature photoluminescence (PL).2.ExperimentSb-doped ZnO thin films were grown on sapphire (001)substrates using CVT technique in closed quartz tube.A mixture of ZnO powder (4N purity)and Sb 2O 3powder (4N purity)with a weight ratio of 1g:0.05g was used as the growth source.During the growth,the temperatures of source and substrate were kept at 1000 C and 700 C respectively.The growing process lasted for an hour.The detailed growth procedures were reported in another article [22].The low temperature PL measurements at different temperatures were performed using a He e Cd laser (325nm).3.Results and discussionPL spectroscopy is a very sensitive and nondestructive method to study the energy states of acceptor and donor [23,24].Temperature dependent PL spectra can provide useful information about the dissociation processes of impurity bound excitons induced by doping.Fig.1shows the PL spectrum at T ¼10K for Sb-doped ZnO thin film.Five emission peaks can be clearly observed.Among them the peak at 3.363eV is usually attributed to neutral donor-bound exciton (D 0X)recombination of ZnO,and the other four peaks at 3.312,3.240,3.168and 3.096eV ought to be related to Sb doping,because the four peaks*Corresponding author.Tel./fax:þ8641184707865.E-mail address:hqzhang@ (H.Zhang).Contents lists available at ScienceDirectVacuumjournal homepa ge:/locate/vacuum0042-207X/$e see front matter Ó2010Elsevier Ltd.All rights reserved.doi:10.1016/j.vacuum.2010.11.006Vacuum 85(2011)718e 720are usually not observed in the PL spectrum of undoped ZnO [24e 27].Further analysis shows that they may be closely related to Sb-related acceptor transitions.The emission located at about 3.312eV could be assigned to the transitions from free electron to neutral acceptor (FA)[19]or donor-acceptor pair (DAP)[26].The other three peaks near 3.240,3.168and 3.096eV could be first-,second-and third-longi-tudinal optical phonon replicas of the 3.312eV emission with a phonon energy of about 72meV (the longitudinal optical (LO)phonon replicas separated by 71e 73meV [14]).Generally the inten-sities of phonon replica are weakened in order [14,19,25,28,29].However the peak intensity at 3.096eV is not lower than that of 3.168eV peak in Fig.1.It is noticed that the line width at 3.096eV is much larger than that of 3.168eV line,so it should be reasonable to consider that there are other unknown emissions in the wide emis-sion line of 3.096eV.These unknown emissions may be related with the preparing method of Sb-doped ZnO film,which needs further investigation.The inset in Fig.1shows 3.352and 3.376eV emission peaks which correspond to a neutral acceptor-bound excition (A 0X)[15,19,29]and a free excition (FX)[14,25,26,29].The temperature dependence of PL spectra was shown in Fig.2.As can be seen in the figure,the intensities of D 0X decreased withthe increase of temperature.With the decrease of this initially dominant peak,an additional peak emerged at a higher energy position of 3.368eV at 80K.This can be interpreted as the decomposition of bound exciton to free exciton with increasing thermal energy.The emission around 3.312eV showed a red shift with the increase of temperature.According to Ref.[14,15,19],acceptor binding energy can be estimated from the peak positions of the DAP and FA transition,respectively:E A ¼E gap ÀE D ÀE DAP þe 24p330r(1)E A ¼E gap ÀE FA þk B T 2(2)where E gap is the band gap energy,E D ,E A ,and E FA are the donor,acceptor binding energies and free electron acceptor level transi-tion,30is the permittivity of vacuum,3is the dielectric constant,k B is the Boltzmann constant,and r is the pair separation,which can be estimated by (3/4p N A )1/3(N A is the acceptor density).For ZnO material,the donor energy E D is generally about 60meV,e 2/4p330r is about 30e 60meV With N A ¼1018e 1019cm À3,and the band gap E gap is 3.437eV at 10K.So for the same acceptor,the E DAP and E FA can be calculated by:E DAP ¼E gap ÀE A ÀE D þe 24p330r¼E gap ÀE A Àð30w 0meV Þ(3)E FA ¼E gap ÀE A þk B T 2(4)The energy difference between DAP and FA which mainly depends on the acceptor density ranges from about 0to 30meV at 10K,and this difference is much smaller than 72meV.Therefore the peak at 3.240eV in Fig.1should be the first-longitudinal optical phonon replicas of the 3.312eV emission,but not from the DAP recombination reported in Refs.[19,29].According to Ref.[27]the relation between E gap and temperature T can be shown as:E gap ðT Þ¼E gap ðT ¼0ÞÀ5:05$10À4$T 2(5)Obviously,as the temperature increases,the E gap is redshifted,but the k B T /2is blueshifted.Therefore,the E DAP is always redshifted with increasing temperature as the E gap ,but for the DAP transitions,2.6 2.7 2.8 2.93.0 3.1 3.2 3.3 3.4 3.5P L I n t e n s i t y (a r b . u n i t s )Energy (eV)Fig.1.PL spectrum at 10K for the Sb-doped ZnO sample obtained by a CVT technique in a closed tube.Inset:Zoom of excitonic peak with the individual components of excitonic peak clearly shown.3.0 3.1 3.2 3.3 3.4P L I n t e n s i t y (a r b . u n i t s )Energy (eV)Fig.2.PL spectra of Sb-doped ZnO sample obtained by a CVT technique in a closed tube measured as a function of temperature.Inset:Zoom of FA peak.2.7 2.8 2.93.0 3.1 3.2 3.33.4P L I n t e n s i t y (a r b . u n i t s )Energy(eV)Fig.3.The excitation intensity dependent PL spectra Sb-doped of ZnO sample at 10K.H.Zhang et al./Vacuum 85(2011)718e 720719the blue shift will be shown because a new peak emerges as a result of FA transitions at its higher energy side with the increase in temperature[14,26,30,31];the E FA isfirst slightly blueshifted and then redshifted,with the transition temperature being about60K. From Fig.2,it can be observed that the temperature dependence of the peaks at3.312,3.240and3.168eV is in agreement with that of FA transition.These peaks can be confirmed to be the FA transition and itsfirst-and second-longitudinal optical phonon replicas. Consequently,the acceptor binding energy E A can be easily calcu-lated to be about125meV at10K,which corresponds well to theoretical predictions for Sb Zn e2V Zn acceptor complex[16].Fig.3exhibits the excitation intensity dependent PL spectra taken at10K.The emission peaks located at3.363eV(D0X)and 3.312eV are independent of the excitation intensity.It is well known that ZnO doped by group-V elements has an FA emission centre around3.310eV[23,27].This further proves that the emis-sion peak located at3.312eV is from the free electrons to neutral acceptor(FA)transition.4.ConclusionIn summary,we observed the acceptor-related emission peaks from the PL spectrum of Sb-doped ZnOfilm grown by a closed tube CVT method.In particular,from the temperature dependent PL,we found that the blue and red shift transition of3.312eV emission corresponded to FA transition.This is different from the tempera-ture dependence of DAP emission.AcknowledgmentsThis work was supported by the Key Laboratory Projects of the Education Department of Liaoning Province(No.20060131),and the Doctoral Project by the China Ministry of Education(No. 20070141038).References[1]Wong EM,Searson PC.Applied Physics Letters1999;74(20):2939.[2]Look DC.Materials Science and Engineering B-Solid State Materials forAdvanced Technology2001;80(1e3):383.[3]Zhang SB,Wei SH,Zunger A.Physical Review B2001;63(7).[4]Van de Walle CG.Physical Review Letters2000;85(5):1012.[5]Wang XH,Yao B,Zhang ZZ,Li BH,Wei ZP,Shen DZ,et al.SemiconductorScience and Technology2006;21(4):494.[6]Wang DY,Zhou J,Liu GZ.Journal of Alloys and Compounds2009;481(1e2):802.[7]Lin SS,Ye ZZ,Lu JG,He HP,Chen LX,Gu XQ,et al.Journal of Physics D-AppliedPhysics2008;41(15):155114.[8]Jun W,Yang YT.Materials Letters2008;62(12e13):1899.[9]Sun J-C,Liang H-W,Zhao J-Z,Bian J-M,Feng Q-J,Wang J-W,et al.ChinesePhysics Letters2008;25:4345.[10]Xiao ZY,Liu YC,Mu R,Zhao DX,Zhang JY.Applied Physics Letters2008;92:052106.[11]Ruiqin D,Huiqun Z,Yi W.Materials Letters2008;62:498.[12]Wang SP,Shan CX,Li BH,Zhang JY,Yao B,Shen DZ,et al.Journal of CrystalGrowth2009;311(14):3577.[13]Kumar M,Choi SY.Applied Surface Science2008;255(5):2173.[14]Pan XH,Guo W,Ye ZZ,Liu B,Che Y,He HP,et al.Journal of Applied Physics2009;105:113516.[15]Xiu FX,Yang Z,Mandalapu LJ,Zhao DT,Liu JL,Beyermann WP.Applied PhysicsLetters2005;87(15):152101.[16]Limpijumnong S,Zhang SB,Su-Huai W,Park CH.Physical Review Letters2004;92(15).155504/1.[17]Guo W,Allenic A,Chen YB,Pan XQ,Che Y,Hu ZD,et al.Applied Physics Letters2007;90(24):242108.[18]Pan XH,Ye ZZ,Li JS,Gu XQ,Zeng YJ,He HP,et al.Applied Surface Science2007;253(11):5067.[19]Zhao JZ,Liang HW,Sun JC,Feng QJ,Bian JM,Zhao ZW,et al.Electrochemicaland Solid State Letters2008;11(12):H323.[20]Benelmadjat H,Boudine B,Halimi O,Sebais M.Optics and Laser Technology2009;41(5):630.[21]Dong K,Nam C,Kyoung K,Seungho H,Ho K.Journal of Electroceramics2009;22:82.[22]Qiang F,Lizhong H,Dongqi Y,Jingchang S,Heqiu Z,Bingzhi H,et al.MaterialsLetters2009;63:316.[23]Dongqi Y,Lizhong H,Shuangshuang Q,Heqiu Z,Len SEA,Len LK,et al.Journalof Physics D:Applied Physics2009;42:055110(6pp.).[24]Teke A,Ozgur U,Dogan S,Gu X,Morkoc H,Nemeth B,et al.Physical ReviewB2004;70:195207.[25]Hamby DW,Lucca DA,Klopfstein MJ,Cantwell G.Journal of Applied Physics2003;93(6):3214.[26]Zhang BP,Binh NT,Segawa Y,Wakatsuki K,Usami N.Applied Physics Letters2003;83(8):1635.[27]Hwang DK,Kim HS,Lim JH,Oh JY,Yang JH,Park SJ,et al.Applied PhysicsLetters2005;86(15):151917.[28]Meyer BK,Alves H,Hofmann DM,Kriegseis W,Forster D,Bertram F,et al.Physica Status Solidi B-Basic Research2004;241(2):231.[29]Przezdziecka E,Kaminska E,Pasternak I,Piotrowska A,Kossut J.PhysicalReview B,(Condensed Matter and Materials Physics)2007;76:193303.[30]Lee W,Jeong MC,Myoung JM.Applied Physics Letters2004;85(25):6167.[31]Shan CX,Liu Z,Hark SK.Applied Physics Letters2008;92(7):073103.H.Zhang et al./Vacuum85(2011)718e720 720。