Petrel地震解释-M1_2_Data_Import_Cube_handling_and_QC
Petrel地震地质解释和建模使用技巧
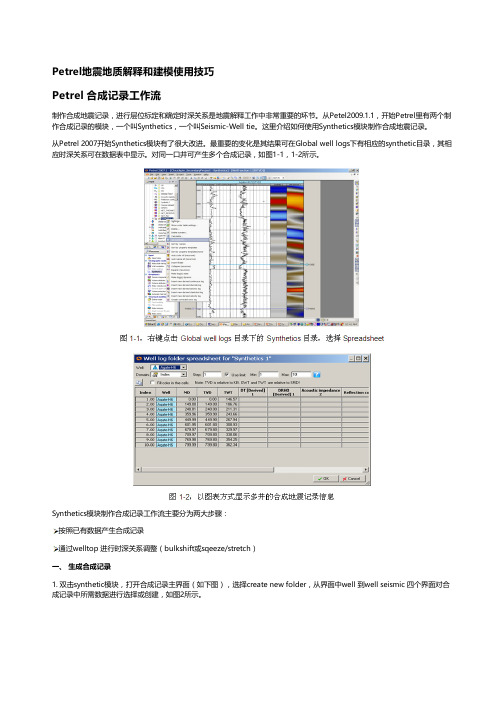
Petrel地震地质解释和建模使用技巧Petrel 合成记录工作流制作合成地震记录,进行层位标定和确定时深关系是地震解释工作中非常重要的环节。
从Petel2009.1.1,开始Petrel里有两个制作合成记录的模块,一个叫Synthetics,一个叫Seismic-Well tie。
这里介绍如何使用Synthetics模块制作合成地震记录。
从Petrel 2007开始Synthetics模块有了很大改进。
最重要的变化是其结果可在Global well logs下有相应的synthetic目录,其相应时深关系可在数据表中显示。
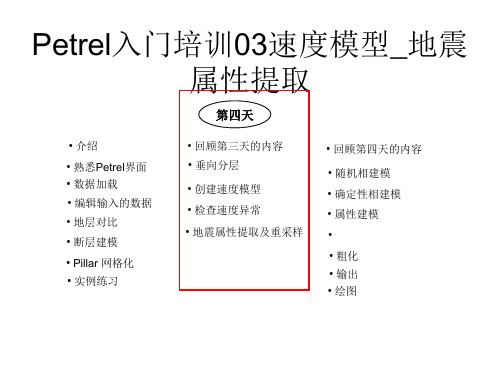
对同一口井可产生多个合成记录,如图1-1,1-2所示。
Synthetics模块制作合成记录工作流主要分为两大步骤:按照已有数据产生合成记录通过welltop 进行时深关系调整(bulkshift或sqeeze/stretch)一、 生成合成记录1. 双击synthetic模块,打开合成记录主界面(如下图),选择create new folder,从界面中well 到well seismic 四个界面对合成记录中所需数据进行选择或创建,如图2所示。
Well:选择要做合成记录的井,可多选,但每口井必须有相应的数据(DT和子波)。
Sonic and time:确定原始输入数据及时深关系。
根据实际数据品质,如果有checkshot,可用来做DT曲线校正;所有井上时深关系以工区井目录,以及每口井的Settings界面里Time界面下设置为准,Synthetics界面里的Overwrite global time log项不启用。
Create synthetic seismogram:创建合成记录选择创建合成记录所需数据:Density、Acoustic Impedence、Reflectiotion coefficients和Wavelet。
如果这些数据都不存在,或者希望修改参数重新创建,则点击黄色星状按钮创建新数据。
Petrel地震地质解释和建模使用技巧2013

Schlumberger Private
Trademark Information Software application names used in this publication are trademarks of Schlumberger. Certain other products and product names are trademarks or registered trademarks of their respective companies or organizations.
Schlumberger Private
ห้องสมุดไป่ตู้
Petrel 地震地质解释和建模使用技巧
I
2.1 Petrel 合成记录工作流
Schlumberger
2.1 Petrel 合成记录工作流
制作合成地震记录,进行层位标定和确定时深关系是地震解释工作中非常重要的环 节。从 Petel2009.1.1,开始 Petrel 里有两个制作合成记录的模块,一个叫 Synthetics,一 个叫 Seismic-Well tie。这里介绍如何使用 Synthetics 模块制作合成地震记录。
Petrel 地震地质解释和建模 使用技巧 2013
斯伦贝谢科技服务(北京)有限公司
Copyright Notice © 2009 Schlumberger. All rights reserved. No part of this manual may be reproduced, stored in a retrieval system, or translated in any form or by any means, electronic or mechanical, including photocopying and recording, without the prior written permission of Schlumberger Information Solutions, 5599 San Felipe, Suite 1700, Houston, TX 77056-2722.
Petrel入门培训03速度模型_地震属性提取
插入小层 Layering
创建层面
Petrel入门培训03速度模型_地震 属性提取
过程: • 在表格中添加数据项 • 使用“同时加入多项数据” • 选择要输入的数据。 • 用蓝色箭头加载数据 • 定义类型
Petrel入门培训03速度模型_地震
设置: • 设置到断层的距离
属性提取
Petrel入门培训03速度模型_地震
设置: • 设置井矫正
属性提取
速度模型
Petrel入门培训03速度模型_地震 属性提取
Petrel入门培训03速度模型_地震 属性提取
地震属性提取 及重采样
加载地震特型数据*.sgy
1、Input-insert-new seismic survey folder→SEGY Import with presetparameters (*.*)
• 随机相建模 • 确定性相建模 • 属性建模 • • 粗化 • 输出 • 绘图
创建层面、层和小层的学习目标
学习如何在地质沉积条件下逐步细化垂向分
辨率
Petrel入门培训03速度模型_地震
属性提取
断层建模
网格化
垂向小层划分
Petrel入门培训03速度模型_地震 属性提取
插入层面 Make Horizons
Petrel入门培训03速度模型_地震 属性提取
第四天
• 介绍
• 熟悉Petrel界面 • 数据加载 • 编辑输入的数据 • 地层对比 • 断层建模 • Pillar 网格化 • 实例练习
• 回顾第三天的内容 • 垂向分层 • 创建速度模型 • 检查速度异常 • 地震属性提取及重采样
• 回顾第四天的内容
Petrel分模块详细介绍
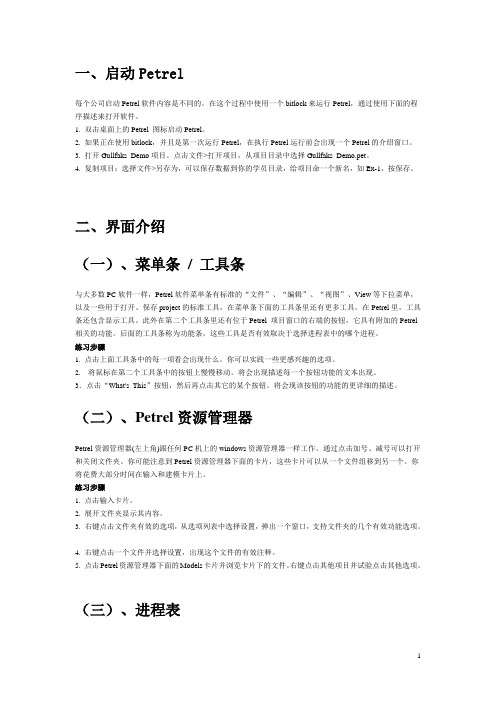
Petrel是Schlumberger公司研发的以三维地质模型为中心的一体化油藏工作平台。
Petrel 一体化油藏工作平台实现了以地质模型为中心的,从地震综合解释到油藏数值模拟的工作流程。
面对当今日益复杂的油气藏的勘探开发技术挑战,Petrel创造了一个允许地质、地震、测井、油藏、钻井、数据管理多专业共享知识和成果的开放环境,Petrel也成为国际油公司解决油气藏勘探开发技术难题的首选。
Petrel平台使用了国际石油勘探开发领域的先进技术,包括断裂系统自动提取、复杂构造建模、多点相建模、裂缝系统分析、全三维可视化显示和解释、不确定性分析、模型自动更新工作流等功能。
Petrel以其友好的界面、强大的显示功能、无缝的数据整合为研究人员提供了多用户、多学科协同工作环境。
使各学科研究人员更好地共享知识和经验、提高工作效率和成果的准确性。
Petrel作为受到业界广泛应用和认可的软件平台,其一体化的工作理念、开放的研发环境和先进的技术功能已经引领软件发展的潮流。
Petrel平台分地学核心系统、地球物理系统、地质建模系统、油藏工程系统等共20多个功能模块,在地学核心系统和高级核心系统的支持下,系统中的每个模块均可独立运行,用户可以根据工作需求合理组合所需功能模块。
2.1核心模块Geoscience Core地学核心系统,是运行Petrel和其它模块的最基本的必要条件包括基本系统和三维网格建立。
应用它进行三维断层建模、生成层面图以及加载井数据和井的分层数据。
它能用于生成/编辑多边形,同时还可以作为一种方便宜的查询工具。
例如,浏览管理、质量检查以及查询PETREL TM工区等,所有信息的在线帮助系统也是这个模块功能的一部分。
2.2地球物理(1) SEISMIC INTERPRETATION地震解释Seismic Interpretation模块提供了主要的地震解释功能。
包括地震数据体二、三维显示和浏览,使解释人员快速浏览地震数据体,优选研究目标区;断层手工解释和自动解释(Automatic Fault Picking功能);层位的二、三维手工解释和自动解释追踪功能;构造模型与地震数据体的同时显示,提高对地下地层和构造的了解。
petrel中文手册
一、启动Petrel每个公司启动Petrel软件内容是不同的。
在这个过程中使用一个bitlock来运行Petrel,通过使用下面的程序描述来打开软件。
1. 双击桌面上的Petrel 图标启动Petrel。
2. 如果正在使用bitlock,并且是第一次运行Petrel,在执行Petrel运行前会出现一个Petrel的介绍窗口。
3. 打开Gullfaks_Demo项目。
点击文件>打开项目,从项目目录中选择Gullfaks_Demo.pet。
4. 复制项目:选择文件>另存为,可以保存数据到你的学员目录,给项目命一个新名,如Ex-1,按保存。
二、界面介绍(一)、菜单条/ 工具条与大多数PC软件一样,Petrel软件菜单条有标准的“文件”、“编辑”、“视图”、View等下拉菜单,以及一些用于打开、保存project的标准工具,在菜单条下面的工具条里还有更多工具。
在Petrel里,工具条还包含显示工具。
此外在第二个工具条里还有位于Petrel 项目窗口的右端的按钮,它具有附加的Petrel 相关的功能。
后面的工具条称为功能条,这些工具是否有效取决于选择进程表中的哪个进程。
练习步骤1. 点击上面工具条中的每一项看会出现什么。
你可以实践一些更感兴趣的选项。
2.将鼠标在第二个工具条中的按钮上慢慢移动。
将会出现描述每一个按钮功能的文本出现。
3.点击“What's This”按钮,然后再点击其它的某个按钮。
将会现该按钮的功能的更详细的描述。
(二)、Petrel资源管理器Petrel资源管理器(左上角)跟任何PC机上的windows资源管理器一样工作。
通过点击加号、减号可以打开和关闭文件夹。
你可能注意到Petrel资源管理器下面的卡片,这些卡片可以从一个文件组移到另一个。
你将花费大部分时间在输入和建模卡片上。
练习步骤1. 点击输入卡片。
2. 展开文件夹显示其内容。
3. 右键点击文件夹有效的选项,从选项列表中选择设置,弹出一个窗口,支持文件夹的几个有效功能选项。
Petrel官方地震解释培训MDataImportCubehandlingandQC
Facies Modeling
Petrophysical Modeling
Plotting
Volume Calculation
Well Design
Petrel Seismic Visualization and Interpretation
Course contents
Day 1
Day 2
Day 3
Loading seismic data - Import with preset parameters
1. Right click on a survey folder and use ‘Import (on selection)’
2. Select the file, set ‘Files of type’ and click Open
Generate Attribute cubes Generate Ant-tracking cube Auto generate fault patches Edit fault patches Convert fault patches to fault
interpretation Volume extraction Train Estimation Model
5. It is possible to scan a specified number of traces to QC the parameter selection
6. In the Input Data Dialog window, select the desired color template and correct domain
3. Right click or use the Insert menu to add seismic survey folders
Petrel官方地震解释培训M3_Reconnaissance
1
2
3
Display multiple seismic views on the same screen
Options to tile horizontally or vertically
Interpretation is updated interactively between windows
line under 3D grid settings sub-tab
Settings for SEG-Y seismic data (2D and 3D)
1. Settings for SEG-Y seismic data displayed in a 3D window, Style tab, activates a SEGY style sub-tab
1. Well data display can be controlled by a distance
limit. Wellbores (or part of the wellbore) and tops
2
beyond the limit will not be posted
1
2. Display style of 3D grid data is set for the selected
4. Enable transparency for intersections combined with editing of the opacity curve under the colors tab to see through the seismic sections
1 2
3
4
Settings for ZGY seismic data (3D)
Petrel官方地震解释培训MPreliminaryInterpretation
• A Variance or Chaos cube needs to be generated to be used as input to the Anttracking process.
• Any other input that enhances discontinuities can be used (e.g. Coherency® ). Needs to be imported through SEG-Y loader or Open-Spirit connectivity.
Patch surface area. Click
on the histogram
representing the small
areas and click Apply
3. The small faults will be hidden
Settings for Fault patches – Stereonet filtering
1
(Chaos) and go to Volume attributes
2
2. Choose the AntTracking under
Structural methods
3
3. Select Passive or Aggressive Ants
and check the Ant-tracking setting
Petrel官方地震解释培训MReconnaissance
Objectives
• Selecting and manipulate seismic lines • Create Interpretation windows • Manipulating an Interpretation window • Display wiggle traces • Posting data in an Interpretation widow • Settings for SEG-Y seismic data • Settings for ZGY seismic data • Create and edit color palettes • Display multiple seismic views on the same screen • Linking windows • Random intersections • Composite intersections • Create a Well section fence diagram • Volume rendering
To change lines
4
3. Check box in front of a different seismic line
4. LMB on triangle above seismic or drag to new position
12 3
Manipulating an Interpretation window
4. Enable transparency for intersections combined with editing of the opacity curve under the colors tab to see through the seismic sections
Petrel官方地震解释培训M5_Preliminary Interpretation 共22页
- Illegal step distance
Legal Step parameter defines how many legal step advances must be taken after an illegal step and before another illegal step is taken.
- Distance to search off track direction
• Search until discontinuity is found or exceed step distance plus illegal step distance • Search for next discontinuity (when found it defines direction of travel) • Search for next discontinuity in tracking direction within defined distance of that
The Ant-tracking attribute cube will be put in the Input tab
Ant-tracking parameters
2D example of ants path through voxels
- Discontinuity - Initial ant agents - Tracking Ant agent - Tracking direction - Step advance distance
- 1、下载文档前请自行甄别文档内容的完整性,平台不提供额外的编辑、内容补充、找答案等附加服务。
- 2、"仅部分预览"的文档,不可在线预览部分如存在完整性等问题,可反馈申请退款(可完整预览的文档不适用该条件!)。
- 3、如文档侵犯您的权益,请联系客服反馈,我们会尽快为您处理(人工客服工作时间:9:00-18:30)。
Import data
Petrophysical Modeling
Plotting
Volume Calculation
Well Design
Process Manager
Location
Schlumberger Rø a Fire safety plan Cross the main road Restrooms
1 2 3
Units must be set correct when importing data. There is no automatic unit conversion except when importing data. Since Petrel recognizes the import data just as numbers, i.e. depths, changing the units will not change the data itself
2 1
Seismic data visualization in 3D windows
1. Expand the seismic cube to display the default Inline and Crossline 2. To add additional Inlines, Crosslines, Random lines and time slices, right click and select from the drop down menu. 3. To view the outline of a 3D volume, click on the check box in front of the volume name 4. To display seismic 2D lines, click on the check box in front of the line name
Loading seismic data - Import with preset parameters
1. Right click on a survey folder and use Import (on selection) 2. Select the file, set Files of type and click Open 3. Set corresponding data type (2D/3D), define vintage and Line detection method
Surface operations Fault operations Geobody interpretation Train estimation model Genetic inversion Velocity modeling Domain conversion Set up scaled plots
3
4. Vintages are mainly used to display the same seismic line from different seismic cube versions in an interpretation window
Full Offset Stack
4
Near Offset Stack
Setting reference datums
1. Open Settings for SRD found under Datums in Templates pane 1 2. Specify the distance SRD is from MSL (depth project units) 3. Right click on Datums, use Insert new datum
3
1
2
Note: If selecting Line detection method – Automatic, trace headers will be analyzed and the most likely line/inline and trace/crossline headers are selected. When the automatic method is selected, scanning is unavailable since the headers are undetermined until the SEGY file is read.
Base map in 2D window
1. Double click on the Survey folder(s) 2. Under the Style tab specify the Base map annotation 3. Open a 2D Window and display the seismic lines (e.g. Inlines, Crosslines, Random lines and 2D lines)
Attribute cubes Ant-tracking workflow Workflow editor Automatic fault extraction Fault interpretation Horizon interpretation Interpretation manager Make surfaces
4
5
6
Note: Messages related to import of seismic data is added to the Petrel messages log
Seismic vintages
1. Expand the Vintages folder found in the Seismic main folder 1
2
3
2
CRD CRD
Using reference datums
1. CRD is a well specific reference and is defined during Check shot import 2. Time datum in velocity modeling is normally SRD, but can be user defined if needed
1 2
3
Base map in 3D window
1. Open a 3D Window and display the seismic lines (e.g. Inlines, Crosslines, Random lines and 2D lines) 2. Double click on 2D lines folder. 3. Under the Style tab Z level is active and the depth of 2D Base map can be set.
SEG-Y settings
1. Open Settings for the imported seismic, go to the SEG-Y Settings tab 2. The three sub tabs contain loading parameters, and listing of the binary and ASCII headers
2
1
2
Seismic bulk data storage – the seismic main folder
1. Insert New seismic main folder 2. The Seismic main folder appears in Input pane with a predefined hierarchy 3. Right click or use the Insert menu to add seismic survey folders
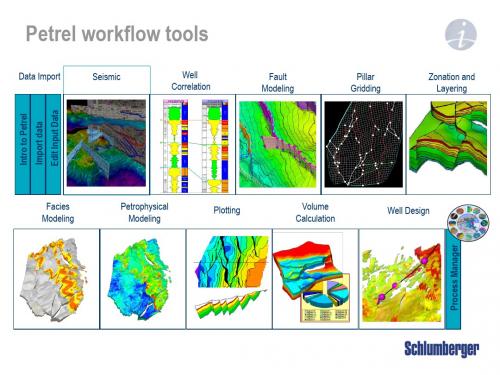
Petrel workflow tools - Seismic
Data Import
Seismic Well Correlation Fault Modeling Pillar Gridding Zonation and Layering
Facies Modeling
Edit Input Data
Intro to Petrel
Data Import, Cube handling and QC
Objectives
• • • • • • • • • • • • • • Specify project unit system Set reference datums Import seismic data Check SEGY-settings Set Base map annotations (2D/3D Windows) Use the 2D survey manager Mis-tie handling Crop seismic data Realize seismic data Prefetch to cache Use seismic calculator Display volume walls Transfer data through the Reference project tool Export options
Men WomenFra bibliotekAslakveien 14E Lunch 12 pm Locked department Visitor badge visible Fire: call 110
Petrel Seismic Visualization and Interpretation
Course contents
2
3
1
Note: The seismic main folder contains by default a Vintage folder (to be explained later), Interp survey inclusion filters and an Interpretation folder with an active seismic horizon. Only one Seismic main folder can exist in a project.