414 Genome Informatics 14 414–415 (2003) Detect of Novel Alternative Form at Development S
miR414和TOE1调控植物表皮毛及NbGIS调控烟草腺毛发育的功能研究

miR414和TOE1调控植物表皮毛及NbGIS调控烟草腺毛发育的功能研究表皮毛(腺毛)是大多数陆生植物地上部分表皮常见的一种结构,形态大小各异,常作为植物物种识别的重要依据。
表皮毛是植物表面的第一层防护系统,可以保护植物免受温度、干旱、紫外线和病虫害等不良外界环境影响。
其中,烟草腺毛代谢产物不仅有助于植物驱逐有害病虫,吸引昆虫授粉,也可作为生产香料、化妆品、药物等的重要原材料。
拟南芥表皮毛的发育调控是研究植物细胞命运分化、器官形态建成及不同发育过程相互作用的重要模型,同时可以为研究烟草和青蒿等多细胞腺毛植物的调控机制以及和表皮毛细胞发育和调控机制相似的棉花纤维细胞提供理论基础。
拟南芥的表皮毛形成主要受多种转录因子、miRNAs以及植物激素的共同调控。
本论文主要对拟南芥miR414和转录因子TARGET OF EARLY ACTIVATION TAGGED 1(TOE1)在调控表皮毛发育方面的功能进行研究。
并利用拟南芥表皮毛的研究方法和研究成果,探究烟草腺毛的发育和调控机制,克隆了拟南芥表皮毛调控因子GIS在烟草中的同源基因NbGIS,研究其在烟草腺毛发育方面的功能。
本论文的所取得主要研究成果如下;1、miR414介导GA信号途径通过靶定目标基因GL3,调控拟南芥表皮毛的发育。
我们通过生物信息学分析预测GL3基因的表达可能受miR414的靶定。
通过构建拟南芥miR414的过量表达载体、STTM干扰载体及启动子与GUS融合的表达载体,验证了拟南芥miR414的功能及表达模式。
定量分析和表皮毛观察统计进一步证明了miR414通过抑制GL3的表达量来调控拟南芥表皮毛发育。
对GA处理后拟南芥野生型、GA缺失突变体ga1-3和GA不敏感突变体gai进行表达量分析,发现miR414在GA处理后表达量显著下调,在GA突变体中的表达量显著上调。
同时GL3的表达量变化趋势与miR414相反。
结果证明GA信号通过抑制miR414的表达,从而释放对GL3的表达抑制信号,促进表皮毛起始。
2024特发性矮小症多组学生物标志物的研究进展(全文)
2024特发性矮小症多组学生物标志物的研究进展(全文)摘要特发性矮小症(idiopathic short stature,ISS)是一类没有明确病因的矮小症的统称,其病因存在异质性和复杂性,多为遗传和环境因素共同作用所致。
由于缺乏特异性的症状、体征以及生物标志物,目前ISS主要依靠排除性诊断。
近年来,随着各种高通量检测技术的发展,与ISS相关的转录组学、蛋白质组学、代谢组学、微生物组学等研究逐渐成为热点,为阐明ISS的病因、进行早期诊断和指导治疗提供了新的思路。
该文综述了与多组学相关的生物标志物在ISS的发病机制和早期诊断中的研究进展。
特发性矮小症(idiopathic short stature,ISS)是指在出生体重正常且没有全身性、内分泌性、营养性或染色体异常性疾病的情况下,个体的身高低于相应年龄、性别和人群组的平均身高两倍标准差以上的状态,是一组不明原因所致身材矮小的统称[1]。
ISS在多因素和多基因的影响下发生,近年来的研究表明ISS的发病与矮小同源盒基因、生长激素受体基因、成纤维细胞生长因子受体-3基因、C型利钠肽受体-2基因、聚集蛋白聚糖基因、染色体微阵列拷贝数变异等相关。
然而基因突变的检出率并不高,例如矮小同源盒基因的突变检出率为2%~3%[2],生长激素受体基因为2%~5%[3],C型利钠肽受体-2基因为5.7%~12.5%[4,5]。
生物标志物作为一种可测量的生物信号,在揭示发病机制、进行早期诊断、判断预后、指导治疗、提供新的治疗靶点等方面发挥着重要作用。
目前,与ISS相关的转录组学、蛋白质组学、代谢组学和微生物组学等的研究正在兴起,该文就与ISS多组学相关的生物标志物的最新研究作一综述,以期进一步阐明ISS的发病机制,实现ISS的早期诊断。
1 转录组学研究进展转录组学是一门在整体水平上研究细胞中基因转录及调控规律的学科[6]。
转录组即一个活细胞所能转录出来的所有RNA的总和,其有助于了解特定过程中相关基因的表达情况,进而从转录水平揭示该过程的代谢网络及调控机制[7]。
Analysis of Genetic Diversity and Population Structure
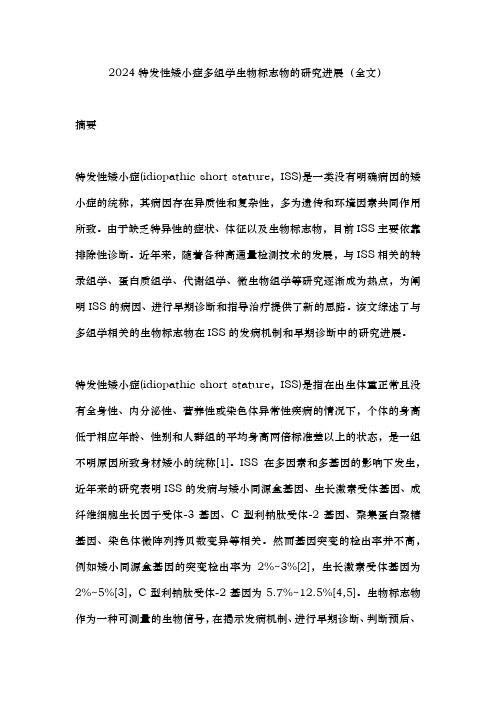
Agricultural Sciences in China2010, 9(9): 1251-1262September 2010Received 30 October, 2009 Accepted 16 April, 2010Analysis of Genetic Diversity and Population Structure of Maize Landraces from the South Maize Region of ChinaLIU Zhi-zhai 1, 2, GUO Rong-hua 2, 3, ZHAO Jiu-ran 4, CAI Yi-lin 1, W ANG Feng-ge 4, CAO Mo-ju 3, W ANG Rong-huan 2, 4, SHI Yun-su 2, SONG Yan-chun 2, WANG Tian-yu 2 and LI Y u 21Maize Research Institute, Southwest University, Chongqing 400716, P.R.China2Institue of Crop Sciences/National Key Facility for Gene Resources and Genetic Improvement, Chinese Academy of Agricultural Sciences,Beijing 100081, P.R.China3Maize Research Institute, Sichuan Agricultural University, Ya’an 625014, P.R.China4Maize Research Center, Beijing Academy of Agricultural and Forestry Sciences, Beijing 100089, P.R.ChinaAbstractUnderstanding genetic diversity and population structure of landraces is important in utilization of these germplasm in breeding programs. In the present study, a total of 143 core maize landraces from the South Maize Region (SR) of China,which can represent the general profile of the genetic diversity in the landraces germplasm of SR, were genotyped by 54DNA microsatellite markers. Totally, 517 alleles (ranging from 4 to 22) were detected among these landraces, with an average of 9.57 alleles per locus. The total gene diversity of these core landraces was 0.61, suggesting a rather higher level of genetic diversity. Analysis of population structure based on Bayesian method obtained the samilar result as the phylogeny neighbor-joining (NJ) method. The results indicated that the whole set of 143 core landraces could be clustered into two distinct groups. All landraces from Guangdong, Hainan, and 15 landraces from Jiangxi were clustered into group 1, while those from the other regions of SR formed the group 2. The results from the analysis of genetic diversity showed that both of groups possessed a similar gene diversity, but group 1 possessed relatively lower mean alleles per locus (6.63) and distinct alleles (91) than group 2 (7.94 and 110, respectively). The relatively high richness of total alleles and distinct alleles preserved in the core landraces from SR suggested that all these germplasm could be useful resources in germplasm enhancement and maize breeding in China.Key words :maize, core landraces, genetic diversity, population structureINTRODUCTIONMaize has been grown in China for nearly 500 years since its first introduction into this second biggest pro-duction country in the world. Currently, there are six different maize growing regions throughout the coun-try according to the ecological conditions and farming systems, including three major production regions,i.e., the North Spring Maize Region, the Huang-Huai-Hai Summer Maize Region, and the Southwest MaizeRegion, and three minor regions, i.e., the South Maize Region, the Northwest Maize Region, and the Qingzang Plateau Maize Region. The South Maize Region (SR)is specific because of its importance in origin of Chi-nese maize. It is hypothesized that Chinese maize is introduced mainly from two routes. One is called the land way in which maize was first brought to Tibet from India, then to Sichuan Province in southwestern China. The other way is that maize dispersed via the oceans, first shipped to the coastal areas of southeast China by boats, and then spread all round the country1252LIU Zhi-zhai et al.(Xu 2001; Zhou 2000). SR contains all of the coastal provinces and regions lie in southeastern China.In the long-term cultivation history of maize in south-ern China, numerous landraces have been formed, in which a great amount of genetic variation was observed (Li 1998). Similar to the hybrid swapping in Europe (Reif et al. 2005a), the maize landraces have been al-most replaced by hybrids since the 1950s in China (Li 1998). However, some landraces with good adapta-tions and yield performances are still grown in a few mountainous areas of this region (Liu et al.1999). Through a great effort of collection since the 1950s, 13521 accessions of maize landraces have been cur-rently preserved in China National Genebank (CNG), and a core collection of these landraces was established (Li et al. 2004). In this core collection, a total of 143 maize landrace accessions were collected from the South Maize Region (SR) (Table 1).Since simple sequence repeat ( SSR ) markers were firstly used in human genetics (Litt and Luty 1989), it now has become one of the most widely used markers in the related researches in crops (Melchinger et al. 1998; Enoki et al. 2005), especially in the molecular characterization of genetic resources, e.g., soybean [Glycine max (L.) Merr] (Xie et al. 2005), rice (Orya sativa L.) (Garris et al. 2005), and wheat (Triticum aestivum) (Chao et al. 2007). In maize (Zea mays L.), numerous studies focusing on the genetic diversity and population structure of landraces and inbred lines in many countries and regions worldwide have been pub-lished (Liu et al. 2003; Vegouroux et al. 2005; Reif et al. 2006; Wang et al. 2008). These activities of documenting genetic diversity and population structure of maize genetic resources have facilitated the under-standing of genetic bases of maize landraces, the utili-zation of these resources, and the mining of favorable alleles from landraces. Although some studies on ge-netic diversity of Chinese maize inbred lines were con-ducted (Yu et al. 2007; Wang et al. 2008), the general profile of genetic diversity in Chinese maize landraces is scarce. Especially, there are not any reports on ge-netic diversity of the maize landraces collected from SR, a possibly earliest maize growing area in China. In this paper, a total of 143 landraces from SR listed in the core collection of CNG were genotyped by using SSR markers, with the aim of revealing genetic diver-sity of the landraces from SR (Table 2) of China and examining genetic relationships and population struc-ture of these landraces.MATERIALS AND METHODSPlant materials and DNA extractionTotally, 143 landraces from SR which are listed in the core collection of CNG established by sequential strati-fication method (Liu et al. 2004) were used in the present study. Detailed information of all these landrace accessions is listed in Table 1. For each landrace, DNA sample was extracted by a CTAB method (Saghi-Maroof et al. 1984) from a bulk pool constructed by an equal-amount of leaves materials sampled from 15 random-chosen plants of each landrace according to the proce-dure of Reif et al. (2005b).SSR genotypingA total of 54 simple sequence repeat (SSR) markers covering the entire maize genome were screened to fin-gerprint all of the 143 core landrace accessions (Table 3). 5´ end of the left primer of each locus was tailed by an M13 sequence of 5´-CACGACGTTGTAAAACGAC-3´. PCR amplification was performed in a 15 L reac-tion containing 80 ng of template DNA, 7.5 mmol L-1 of each of the four dNTPs, 1×Taq polymerase buffer, 1.5 mmol L-1 MgCl2, 1 U Taq polymerase (Tiangen Biotech Co. Ltd., Beijing, China), 1.2 mol L-1 of forward primer and universal fluorescent labeled M13 primer, and 0.3 mol L-1 of M13 sequence tailed reverse primer (Schuelke 2000). The amplification was carried out in a 96-well DNA thermal cycler (GeneAmp PCR System 9700, Applied Biosystem, USA). PCR products were size-separated on an ABI Prism 3730XL DNA sequencer (HitachiHigh-Technologies Corporation, Tokyo, Japan) via the software packages of GENEMAPPER and GeneMarker ver. 6 (SoftGenetics, USA).Data analysesAverage number of alleles per locus and average num-ber of group-specific alleles per locus were identifiedAnalysis of Genetic Diversity and Population Structure of Maize Landraces from the South Maize Region of China 1253Table 1 The detailed information about the landraces used in the present studyPGS revealed by Structure1) NJ dendragram revealed Group 1 Group 2 by phylogenetic analysis140-150tian 00120005AnH-06Jingde Anhui 0.0060.994Group 2170tian00120006AnH-07Jingde Anhui 0.0050.995Group 2Zixihuangyumi00120007AnH-08Zixi Anhui 0.0020.998Group 2Zixibaihuangzayumi 00120008AnH-09Zixi Anhui 0.0030.997Group 2Baiyulu 00120020AnH-10Yuexi Anhui 0.0060.994Group 2Wuhuazi 00120021AnH-11Yuexi Anhui 0.0030.997Group 2Tongbai 00120035AnH-12Tongling Anhui 0.0060.994Group 2Yangyulu 00120036AnH-13Yuexi Anhui 0.0040.996Group 2Huangli 00120037AnH-14Tunxi Anhui 0.0410.959Group 2Baiyumi 00120038AnH-15Tunxi Anhui 0.0030.997Group 2Dapigu00120039AnH-16Tunxi Anhui 0.0350.965Group 2150tianbaiyumi 00120040AnH-17Xiuning Anhui 0.0020.998Group 2Xiuning60tian 00120042AnH-18Xiuning Anhui 0.0040.996Group 2Wubaogu 00120044AnH-19ShitaiAnhui 0.0020.998Group 2Kuyumi00130001FuJ-01Shanghang Fujian 0.0050.995Group 2Zhongdouyumi 00130003FuJ-02Shanghang Fujian 0.0380.962Group 2Baixinyumi 00130004FuJ-03Liancheng Fujian 0.0040.996Group 2Hongxinyumi 00130005FuJ-04Liancheng Fujian 0.0340.966Group 2Baibaogu 00130008FuJ-05Changding Fujian 0.0030.997Group 2Huangyumi 00130011FuJ-06Jiangyang Fujian 0.0020.998Group 2Huabaomi 00130013FuJ-07Shaowu Fujian 0.0020.998Group 2Huangbaomi 00130014FuJ-08Songxi Fujian 0.0020.998Group 2Huangyumi 00130016FuJ-09Wuyishan Fujian 0.0460.954Group 2Huabaogu 00130019FuJ-10Jian’ou Fujian 0.0060.994Group 2Huangyumi 00130024FuJ-11Guangze Fujian 0.0010.999Group 2Huayumi 00130025FuJ-12Nanping Fujian 0.0040.996Group 2Huangyumi 00130026FuJ-13Nanping Fujian 0.0110.989Group 2Hongbaosu 00130027FuJ-14Longyan Fujian 0.0160.984Group 2Huangfansu 00130029FuJ-15Loangyan Fujian 0.0020.998Group 2Huangbaosu 00130031FuJ-16Zhangping Fujian 0.0060.994Group 2Huangfansu 00130033FuJ-17Zhangping Fujian0.0040.996Group 2Baolieyumi 00190001GuangD-01Guangzhou Guangdong 0.9890.011Group 1Nuomibao (I)00190005GuangD-02Shixing Guangdong 0.9740.026Group 1Nuomibao (II)00190006GuangD-03Shixing Guangdong 0.9790.021Group 1Zasehuabao 00190010GuangD-04Lechang Guangdong 0.9970.003Group 1Zihongmi 00190013GuangD-05Lechang Guangdong 0.9880.012Group 1Jiufengyumi 00190015GuangD-06Lechang Guangdong 0.9950.005Group 1Huangbaosu 00190029GuangD-07MeiGuangdong 0.9970.003Group 1Bailibao 00190032GuangD-08Xingning Guangdong 0.9980.002Group 1Nuobao00190038GuangD-09Xingning Guangdong 0.9980.002Group 1Jinlanghuang 00190048GuangD-10Jiangcheng Guangdong 0.9960.004Group 1Baimizhenzhusu 00190050GuangD-11Yangdong Guangdong 0.9940.006Group 1Huangmizhenzhusu 00190052GuangD-12Yangdong Guangdong 0.9930.007Group 1Baizhenzhu 00190061GuangD-13Yangdong Guangdong 0.9970.003Group 1Baiyumi 00190066GuangD-14Wuchuan Guangdong 0.9880.012Group 1Bendibai 00190067GuangD-15Suixi Guangdong 0.9980.002Group 1Shigubaisu 00190068GuangD-16Gaozhou Guangdong 0.9960.004Group 1Zhenzhusu 00190069GuangD-17Xinyi Guangdong 0.9960.004Group 1Nianyaxixinbai 00190070GuangD-18Huazhou Guangdong 0.9960.004Group 1Huangbaosu 00190074GuangD-19Xinxing Guangdong 0.9950.005Group 1Huangmisu 00190076GuangD-20Luoding Guangdong 0.940.060Group 1Huangmi’ai 00190078GuangD-21Luoding Guangdong 0.9980.002Group 1Bayuemai 00190084GuangD-22Liannan Guangdong 0.9910.009Group 1Baiyumi 00300001HaiN-01Haikou Hainan 0.9960.004Group 1Baiyumi 00300003HaiN-02Sanya Hainan 0.9970.003Group 1Hongyumi 00300004HaiN-03Sanya Hainan 0.9980.002Group 1Baiyumi00300011HaiN-04Tongshi Hainan 0.9990.001Group 1Zhenzhuyumi 00300013HaiN-05Tongshi Hainan 0.9980.002Group 1Zhenzhuyumi 00300015HaiN-06Qiongshan Hainan 0.9960.004Group 1Aiyumi 00300016HaiN-07Qiongshan Hainan 0.9960.004Group 1Huangyumi 00300021HaiN-08Qionghai Hainan 0.9970.003Group 1Y umi 00300025HaiN-09Qionghai Hainan 0.9870.013Group 1Accession name Entry code Analyzing code Origin (county/city)Province/Region1254LIU Zhi-zhai et al .Baiyumi00300032HaiN-10Tunchang Hainan 0.9960.004Group 1Huangyumi 00300051HaiN-11Baisha Hainan 0.9980.002Group 1Baihuangyumi 00300055HaiN-12BaishaHainan 0.9970.003Group 1Machihuangyumi 00300069HaiN-13Changjiang Hainan 0.9900.010Group 1Hongyumi00300073HaiN-14Dongfang Hainan 0.9980.002Group 1Xiaohonghuayumi 00300087HaiN-15Lingshui Hainan 0.9980.002Group 1Baiyumi00300095HaiN-16Qiongzhong Hainan 0.9950.005Group 1Y umi (Baimai)00300101HaiN-17Qiongzhong Hainan 0.9980.002Group 1Y umi (Xuemai)00300103HaiN-18Qiongzhong Hainan 0.9990.001Group 1Huangmaya 00100008JiangS-10Rugao Jiangsu 0.0040.996Group 2Bainian00100012JiangS-11Rugao Jiangsu 0.0080.992Group 2Bayebaiyumi 00100016JiangS-12Rudong Jiangsu 0.0040.996Group 2Chengtuohuang 00100021JiangS-13Qidong Jiangsu 0.0050.995Group 2Xuehuanuo 00100024JiangS-14Qidong Jiangsu 0.0020.998Group 2Laobaiyumi 00100032JiangS-15Qidong Jiangsu 0.0050.995Group 2Laobaiyumi 00100033JiangS-16Qidong Jiangsu 0.0010.999Group 2Huangwuye’er 00100035JiangS-17Hai’an Jiangsu 0.0030.997Group 2Xiangchuanhuang 00100047JiangS-18Nantong Jiangsu 0.0060.994Group 2Huangyingzi 00100094JiangS-19Xinghua Jiangsu 0.0040.996Group 2Xiaojinhuang 00100096JiangS-20Yangzhou Jiangsu 0.0010.999Group 2Liushizi00100106JiangS-21Dongtai Jiangsu 0.0030.997Group 2Kangnandabaizi 00100108JiangS-22Dongtai Jiangsu 0.0020.998Group 2Shanyumi 00140020JiangX-01Dexing Jiangxi 0.9970.003Group 1Y umi00140024JiangX-02Dexing Jiangxi 0.9970.003Group 1Tianhongyumi 00140027JiangX-03Yushan Jiangxi 0.9910.009Group 1Hongganshanyumi 00140028JiangX-04Yushan Jiangxi 0.9980.002Group 1Zaoshuyumi 00140032JiangX-05Qianshan Jiangxi 0.9970.003Group 1Y umi 00140034JiangX-06Wannian Jiangxi 0.9970.003Group 1Y umi 00140038JiangX-07De’an Jiangxi 0.9940.006Group 1Y umi00140045JiangX-08Wuning Jiangxi 0.9740.026Group 1Chihongyumi 00140049JiangX-09Wanzai Jiangxi 0.9920.008Group 1Y umi 00140052JiangX-10Wanzai Jiangxi 0.9930.007Group 1Huayumi 00140060JiangX-11Jing’an Jiangxi 0.9970.003Group 1Baiyumi 00140065JiangX-12Pingxiang Jiangxi 0.9940.006Group 1Huangyumi00140066JiangX-13Pingxiang Jiangxi 0.9680.032Group 1Nuobaosuhuang 00140068JiangX-14Ruijin Jiangxi 0.9950.005Group 1Huangyumi 00140072JiangX-15Xinfeng Jiangxi 0.9960.004Group 1Wuningyumi 00140002JiangX-16Jiujiang Jiangxi 0.0590.941Group 2Tianyumi 00140005JiangX-17Shangrao Jiangxi 0.0020.998Group 2Y umi 00140006JiangX-18Shangrao Jiangxi 0.0310.969Group 2Baiyiumi 00140012JiangX-19Maoyuan Jiangxi 0.0060.994Group 260riyumi 00140016JiangX-20Maoyuan Jiangxi 0.0020.998Group 2Shanyumi 00140019JiangX-21Dexing Jiangxi 0.0050.995Group 2Laorenya 00090002ShangH-01Chongming Shanghai 0.0050.995Group 2Jinmeihuang 00090004ShangH-02Chongming Shanghai 0.0020.998Group 2Zaobaiyumi 00090006ShangH-03Chongming Shanghai 0.0020.998Group 2Chengtuohuang 00090007ShangH-04Chongming Shanghai 0.0780.922Group 2Benyumi (Huang)00090008ShangH-05Shangshi Shanghai 0.0020.998Group 2Bendiyumi 00090010ShangH-06Shangshi Shanghai 0.0040.996Group 2Baigengyumi 00090011ShangH-07Jiading Shanghai 0.0020.998Group 2Huangnuoyumi 00090012ShangH-08Jiading Shanghai 0.0040.996Group 2Huangdubaiyumi 00090013ShangH-09Jiading Shanghai 0.0440.956Group 2Bainuoyumi 00090014ShangH-10Chuansha Shanghai 0.0010.999Group 2Laorenya 00090015ShangH-11Shangshi Shanghai 0.0100.990Group 2Xiaojinhuang 00090016ShangH-12Shangshi Shanghai 0.0050.995Group 2Gengbaidayumi 00090017ShangH-13Shangshi Shanghai 0.0020.998Group 2Nongmeiyihao 00090018ShangH-14Shangshi Shanghai 0.0540.946Group 2Chuanshazinuo 00090020ShangH-15Chuansha Shanghai 0.0550.945Group 2Baoanshanyumi 00110004ZheJ-01Jiangshan Zhejiang 0.0130.987Group 2Changtaixizi 00110005ZheJ-02Jiangshan Zhejiang 0.0020.998Group 2Shanyumibaizi 00110007ZheJ-03Jiangshan Zhejiang 0.0020.998Group 2Kaihuajinyinbao 00110017ZheJ-04Kaihua Zhejiang 0.0100.990Group 2Table 1 (Continued from the preceding page)PGS revealed by Structure 1) NJ dendragram revealed Group1 Group2 by phylogenetic analysisAccession name Entry code Analyzing code Origin (county/city)Province/RegoinAnalysis of Genetic Diversity and Population Structure of Maize Landraces from the South Maize Region of China 1255Liputianzi00110038ZheJ-05Jinhua Zhejiang 0.0020.998Group 2Jinhuaqiuyumi 00110040ZheJ-06Jinhua Zhejiang 0.0050.995Group 2Pujiang80ri 00110069ZheJ-07Pujiang Zhejiang 0.0210.979Group 2Dalihuang 00110076ZheJ-08Yongkang Zhejiang 0.0140.986Group 2Ziyumi00110077ZheJ-09Yongkang Zhejiang 0.0020.998Group 2Baiyanhandipinzhong 00110078ZheJ-10Yongkang Zhejiang 0.0030.997Group 2Duosuiyumi00110081ZheJ-11Wuyi Zhejiang 0.0020.998Group 2Chun’an80huang 00110084ZheJ-12Chun’an Zhejiang 0.0020.998Group 2120ribaiyumi 00110090ZheJ-13Chun’an Zhejiang 0.0020.998Group 2Lin’anliugu 00110111ZheJ-14Lin’an Zhejiang 0.0030.997Group 2Qianhuangyumi00110114ZheJ-15Lin’an Zhejiang 0.0030.997Group 2Fenshuishuitianyumi 00110118ZheJ-16Tonglu Zhejiang 0.0410.959Group 2Kuihualiugu 00110119ZheJ-17Tonglu Zhejiang 0.0030.997Group 2Danbaihuang 00110122ZheJ-18Tonglu Zhejiang 0.0020.998Group 2Hongxinma 00110124ZheJ-19Jiande Zhejiang 0.0030.997Group 2Shanyumi 00110136ZheJ-20Suichang Zhejiang 0.0030.997Group 2Bai60ri 00110143ZheJ-21Lishui Zhejiang 0.0050.995Group 2Zeibutou 00110195ZheJ-22Xianju Zhejiang 0.0020.998Group 2Kelilao00110197ZheJ-23Pan’an Zhejiang 0.0600.940Group 21)The figures refered to the proportion of membership that each landrace possessed.Table 1 (Continued from the preceding page)PGS revealed by Structure 1) NJ dendragram revealed Group 1 Group 2 by phylogenetic analysisAccession name Entry code Analyzing code Origin (county/city)Province/Regoin Table 2 Construction of two phylogenetic groups (SSR-clustered groups) and their correlation with geographical locationsGeographical location SSR-clustered groupChi-square testGroup 1Group 2Total Guangdong 2222 χ2 = 124.89Hainan 1818P < 0.0001Jiangxi 15621Anhui 1414Fujian 1717Jiangsu 1313Shanghai 1515Zhejiang 2323Total5588143by the software of Excel MicroSatellite toolkit (Park 2001). Average number of alleles per locus was calcu-lated by the formula rAA rj j¦1, with the standarddeviation of1)()(12¦ r A AA rj jV , where A j was thenumber of distinct alleles at locus j , and r was the num-ber of loci (Park 2001).Unbiased gene diversity also known as expected heterozygosity, observed heterozygosity for each lo-cus and average gene diversity across the 54 SSR loci,as well as model-based groupings inferred by Struc-ture ver. 2.2, were calculated by the softwarePowerMarker ver.3.25 (Liu et al . 2005). Unbiased gene diversity for each locus was calculated by˅˄¦ 2ˆ1122ˆi x n n h , where 2ˆˆ2ˆ2¦¦z ji ijij i X X x ,and ij X ˆwas the frequency of genotype A i A jin the sample, and n was the number of individuals sampled.The average gene diversity across 54 loci was cal-culated as described by Nei (1987) as follows:rh H rj j ¦1ˆ, with the variance ,whereThe average observed heterozygosity across the en-tire loci was calculated as described by (Hedrick 1983)as follows: r jrj obsobs n h h ¦1, with the standard deviationrn h obs obsobs 1V1256LIU Zhi-zhai et al.Phylogenetic analysis and population genetic structureRelationships among all of the 143 accessions collected from SR were evaluated by using the unweighted pair group method with neighbor-joining (NJ) based on the log transformation of the proportion of shared alleles distance (InSPAD) via PowerMarker ver. 3.25 (FukunagaTable 3 The PIC of each locus and the number of alleles detected by 54 SSRsLocus Bin Repeat motif PIC No. of alleles Description 2)bnlg1007y51) 1.02AG0.7815Probe siteumc1122 1.06GGT0.639Probe siteumc1147y41) 1.07CA0.2615Probe sitephi961001) 2.00ACCT0.298Probe siteumc1185 2.03GC0.7215ole1 (oleosin 1)phi127 2.08AGAC0.577Probe siteumc1736y21) 2.09GCA T0.677Probe sitephi453121 3.01ACC0.7111Probe sitephi374118 3.03ACC0.477Probe sitephi053k21) 3.05A TAC0.7910Probe sitenc004 4.03AG0.4812adh2 (alcohol dehydrogenase 2)bnlg490y41) 4.04T A0.5217Probe sitephi079 4.05AGATG0.495gpc1(glyceraldehyde-3-phosphate dehydrogenase 1) bnlg1784 4.07AG0.6210Probe siteumc1574 4.09GCC0.719sbp2 (SBP-domain protein 2)umc1940y51) 4.09GCA0.4713Probe siteumc1050 4.11AA T0.7810cat3 (catalase 3)nc130 5.00AGC0.5610Probe siteumc2112y31) 5.02GA0.7014Probe sitephi109188 5.03AAAG0.719Probe siteumc1860 5.04A T0.325Probe sitephi085 5.07AACGC0.537gln4 (glutamine synthetase 4)phi331888 5.07AAG0.5811Probe siteumc1153 5.09TCA0.7310Probe sitephi075 6.00CT0.758fdx1 (ferredoxin 1)bnlg249k21) 6.01AG0.7314Probe sitephi389203 6.03AGC0.416Probe sitephi299852y21) 6.07AGC0.7112Probe siteumc1545y21)7.00AAGA0.7610hsp3(heat shock protein 3)phi1127.01AG0.5310o2 (opaque endosperm 2)phi4207018.00CCG0.469Probe siteumc13598.00TC0.7814Probe siteumc11398.01GAC0.479Probe siteumc13048.02TCGA0.335Probe sitephi1158.03A TAC0.465act1(actin1)umc22128.05ACG0.455Probe siteumc11218.05AGAT0.484Probe sitephi0808.08AGGAG0.646gst1 (glutathione-S-transferase 1)phi233376y11)8.09CCG0.598Probe sitebnlg12729.00AG0.8922Probe siteumc20849.01CTAG0.498Probe sitebnlg1520k11)9.01AG0.5913Probe sitephi0659.03CACCT0.519pep1(phosphoenolpyruvate carboxylase 1)umc1492y131)9.04GCT0.2514Probe siteumc1231k41)9.05GA0.2210Probe sitephi1084119.06AGCT0.495Probe sitephi4488809.06AAG0.7610Probe siteumc16759.07CGCC0.677Probe sitephi041y61)10.00AGCC0.417Probe siteumc1432y61)10.02AG0.7512Probe siteumc136710.03CGA0.6410Probe siteumc201610.03ACAT0.517pao1 (polyamine oxidase 1)phi06210.04ACG0.337mgs1 (male-gametophyte specific 1)phi07110.04GGA0.515hsp90 (heat shock protein, 90 kDa)1) These primers were provided by Beijing Academy of Agricultural and Forestry Sciences (Beijing, China).2) Searched from Analysis of Genetic Diversity and Population Structure of Maize Landraces from the South Maize Region of China1257et al. 2005). The unrooted phylogenetic tree was finally schematized with the software MEGA (molecular evolu-tionary genetics analysis) ver. 3.1 (Kumar et al. 2004). Additionally, a chi-square test was used to reveal the correlation between the geographical origins and SSR-clustered groups through FREQ procedure implemented in SAS ver. 9.0 (2002, SAS Institute, Inc.).In order to reveal the population genetic structure (PGS) of 143 landrace accessions, a Bayesian approach was firstly applied to determine the number of groups (K) that these materials should be assigned by the soft-ware BAPS (Bayesian Analysis of Population Structure) ver.5.1. By using BAPS, a fixed-K clustering proce-dure was applied, and with each separate K, the num-ber of runs was set to 100, and the value of log (mL) was averaged to determine the appropriate K value (Corander et al. 2003; Corander and Tang 2007). Since the number of groups were determined, a model-based clustering analysis was used to assign all of the acces-sions into the corresponding groups by an admixture model and a correlated allele frequency via software Structure ver.2.2 (Pritchard et al. 2000; Falush et al. 2007), and for the given K value determined by BAPS, three independent runs were carried out by setting both the burn-in period and replication number 100000. The threshold probability assigned individuals into groupswas set by 0.8 (Liu et al. 2003). The PGS result carried out by Structure was visualized via Distruct program ver. 1.1 (Rosenberg 2004).RESULTSGenetic diversityA total of 517 alleles were detected by the whole set of54 SSRs covering the entire maize genome through all of the 143 maize landraces, with an average of 9.57 alleles per locus and ranged from 4 (umc1121) to 22 (bnlg1272) (Table 3). Among all the alleles detected, the number of distinct alleles accounted for 132 (25.53%), with an av-erage of 2.44 alleles per locus. The distinct alleles dif-fered significantly among the landraces from different provinces/regions, and the landraces from Guangdong, Fujian, Zhejiang, and Shanghai possessed more distinct alleles than those from the other provinces/regions, while those from southern Anhui possessed the lowest distinct alleles, only counting for 3.28% of the total (Table 4).Table 4 The genetic diversity within eight provinces/regions and groups revealed by 54 SSRsProvince/Region Sample size Allele no.1)Distinct allele no.Gene diversity (expected heterozygosity)Observed heterozygosity Anhui14 4.28 (4.19) 69 (72.4)0.51 (0.54)0.58 (0.58)Fujian17 4.93 (4.58 80 (79.3)0.56 (0.60)0.63 (0.62)Guangdong22 5.48 (4.67) 88 (80.4)0.57 (0.59)0.59 (0.58)Hainan18 4.65 (4.26) 79 (75.9)0.53 (0.57)0.55 (0.59)Jiangsu13 4.24 700.500.55Jiangxi21 4.96 (4.35) 72 (68.7)0.56 (0.60)0.68 (0.68)Shanghai15 5.07 (4.89) 90 (91.4)0.55 (0.60)0.55 (0.55)Zhejiang23 5.04 (4.24) 85 (74)0.53 (0.550.60 (0.61)Total/average1439.571320.610.60GroupGroup 155 6.63 (6.40) 91 (89.5)0.57 (0.58)0.62 (0.62)Group 2887.94 (6.72)110 (104.3)0.57 (0.57)0.59 (0.58)Total/Average1439.571320.610.60Provinces/Regions within a groupGroup 1Total55 6.69 (6.40) 910.57 (0.58)0.62 (0.62)Guangdong22 5.48 (4.99) 86 (90.1)0.57 (0.60)0.59 (0.58)Hainan18 4.65 (4.38) 79 (73.9)0.53 (0.56)0.55 (0.59)Jiangxi15 4.30 680.540.69Group 2Total887.97 (6.72)110 (104.3)0.57 (0.57)0.59 (0.58)Anhui14 4.28 (3.22) 69 (63.2)0.51 (0.54)0.58 (0.57)Fujian17 4.93 (3.58) 78 (76.6)0.56 (0.60)0.63 (0.61)Jiangsu13 4.24 (3.22) 71 (64.3)0.50 (0.54)0.55 (0.54)Jiangxi6 3.07 520.460.65Shanghai15 5.07 (3.20) 91 (84.1)0.55 (0.60)0.55 (0.54)Zhejiang23 5.04 (3.20) 83 (61.7)0.53 (0.54)0.60 (0.58)1258LIU Zhi-zhai et al.Among the 54 loci used in the study, 16 (or 29.63%) were dinucleotide repeat SSRs, which were defined as type class I-I, the other 38 loci were SSRs with a longer repeat motifs, and two with unknown repeat motifs, all these 38 loci were defined as the class of I-II. In addition, 15 were located within certain functional genes (defined as class II-I) and the rest were defined as class II-II. The results of comparison indicated that the av-erage number of alleles per locus captured by class I-I and II-II were 12.88 and 10.05, respectively, which were significantly higher than that by type I-II and II-I (8.18 and 8.38, respectively). The gene diversity re-vealed by class I-I (0.63) and II-I (0.63) were some-what higher than by class I-II (0.60) and II-II (0.60) (Table 5).Genetic relationships of the core landraces Overall, 143 landraces were clustered into two groups by using neighbor-joining (NJ) method based on InSPAD. All the landraces from provinces of Guangdong and Hainan and 15 of 21 from Jiangxi were clustered together to form group 1, and the other 88 landraces from the other provinces/regions formed group 2 (Fig.-B). The geographical origins of all these 143 landraces with the clustering results were schematized in Fig.-D. Revealed by the chi-square test, the phylogenetic results (SSR-clustered groups) of all the 143 landraces from provinces/regions showed a significant correlation with their geographical origin (χ2=124.89, P<0.0001, Table 2).Revealed by the phylogenetic analysis based on the InSPAD, the minimum distance was observed as 0.1671 between two landraces, i.e., Tianhongyumi (JiangX-03) and Hongganshanyumi (JiangX-04) collected from Jiangxi Province, and the maximum was between two landraces of Huangbaosu (FuJ-16) and Hongyumi (HaiN-14) collected from provinces of Fujian and Hainan, respectively, with the distance of 1.3863 (data not shown). Two landraces (JiangX-01 and JiangX-21) collected from the same location of Dexing County (Table 1) possessing the same names as Shanyumi were separated to different groups, i.e., JiangX-01 to group1, while JiangX-21 to group 2 (Table 1). Besides, JiangX-01 and JiangX-21 showed a rather distant distance of 0.9808 (data not shown). These results indicated that JiangX-01 and JiangX-21 possibly had different ances-tral origins.Population structureA Bayesian method was used to detect the number of groups (K value) of the whole set of landraces from SR with a fixed-K clustering procedure implemented in BAPS software ver. 5.1. The result showed that all of the 143 landraces could also be assigned into two groups (Fig.-A). Then, a model-based clustering method was applied to carry out the PGS of all the landraces via Structure ver. 2.2 by setting K=2. This method as-signed individuals to groups based on the membership probability, thus the threshold probability 0.80 was set for the individuals’ assignment (Liu et al. 2003). Accordingly, all of the 143 landraces were divided into two distinct model-based groups (Fig.-C). The landraces from Guangdong, Hainan, and 15 landraces from Jiangxi formed one group, while the rest 6 landraces from the marginal countries of northern Jiangxi and those from the other provinces formed an-other group (Table 1, Fig.-D). The PGS revealed by the model-based approach via Structure was perfectly consistent with the relationships resulted from the phy-logenetic analysis via PowerMarker (Table 1).DISCUSSIONThe SR includes eight provinces, i.e., southern Jiangsu and Anhui, Shanghai, Zhejiang, Fujian, Jiangxi, Guangdong, and Hainan (Fig.-C), with the annual maize growing area of about 1 million ha (less than 5% of theTable 5 The genetic diversity detected with different types of SSR markersType of locus No. of alleles Gene diversity Expected heterozygosity PIC Class I-I12.880.630.650.60 Class I-II8.180.600.580.55 Class II-I8.330.630.630.58。
生物信息学论文

人类角蛋白14(KRT14)基因的生物信息学分析前言:角蛋白14(Keratin 14 , K14)是角蛋白家族中一员,与角蛋白5 组成一组角蛋白对。
在正常胎儿和成人皮肤内,K14 的转录和翻译主要在表皮基底层和毛囊进行。
角蛋白(keratin )系硬蛋白之一,是一类具有结缔和保护功能的纤维状蛋白质。
由处于α-螺旋或β-折叠构象的平行的多肽链组成不溶于水的起着保护或结构作用蛋白质。
角蛋白(Keratin)是以各种动物的毛发、鳞片、羽毛、蹄、角为主要形式广泛存在于自然界中的一种结构蛋白。
胶原(Collagen)主要存在于动物的皮、骨、软骨、肌腱、韧带和血管中,是结缔组织重要的结构物质。
角蛋白和胶原均为很好的动物蛋白资源[9],已被广泛的运用到医药、食品等方面,但由于两者特殊的化学结构,性质较稳定,动物难以大量直接吸收,这局限了其在饲料方面的发展[10,11]。
而微生物来源的蛋白酶尽管活性很强[12],可以水解多种难降解的纤维蛋白,如角蛋白和胶原等,但往往不是安全的菌株。
关键词:KRT14、序列、引物、进化树、图谱、基因一、材料与方法1.材料:数据来源NCBI的GenBank数据库。
获得KRT14相应的mRNA序列及其注释。
2.方法2.1人类角蛋白14的序列分析:利用NCBI的ORF Find预测开放阅读框ORF;利用DNAstar 的genquest程序对序列进行转录因子结合位点、限制性内切酶图谱分析;用clustalX进行同源序列比对并构建进化树,用NCBI中的primer-blast设计引物。
2.2人类角蛋白14(KRT14)基因的生物信息学分析二、结果与分析1. 从NCBI中获得人类角蛋白14(KRT14)基因全长序列。
其全长:1653 bp 登录号:NM_000526 ,更新时间:2011年10月16日。
基因来源菌种分类为:Homo sapiens、Eukaryota; Metazoa; Chordata; Craniata; V ertebrata; Euteleostomi;Mammalia; Eutheria; Euarchontoglires; Primates; Haplorrhini; Catarrhini; Hominidae; Homo.作者分别为:Natsuga,K., Nishie,W., Smith,B.J., Shinkuma,S., Smith,T.A., Parry,D.A.,Oiso,N., Kawada,A., Y oneda,K., Akiyama,M. 和Shimizu,H.2.mRNA序列如下:1 acccgagcac cttctcttca ctcagccaac tgctcgctcg ctcacctccc tcctctgcac61 catgaccacc tgcagccgcc agttcacctc ctccagctcc atgaagggct cctgcggcat121 cgggggcggc atcgggggcg gctccagccg catctcctcc gtcctggccg gagggtcctg 181 ccgcgccccc agcacctacg ggggcggcct gtctgtctca tcctcccgct tctcctctgg241 gggagcctac gggctggggg gcggctatgg cggtggcttc agcagcagca gcagcagctt301 tggtagtggc tttgggggag gatatggtgg tggccttggt gctggcttgg gtggtggctt361 tggtggtggc tttgctggtg gtgatgggct tctggtgggc agtgagaagg tgaccatgca421 gaacctcaat gaccgcctgg cctcctacct ggacaaggtg cgtgctctgg aggaggccaa481 cgccgacctg gaagtgaaga tccgtgactg gtaccagagg cagcggcctg ctgagatcaa541 agactacagt ccctacttca agaccattga ggacctgagg aacaagattc tcacagccac601 agtggacaat gccaatgtcc ttctgcagat tgacaatgcc cgtctggccg cggatgactt661 ccgcaccaag tatgagacag agttgaacct gcgcatgagt gtggaagccg acatcaatgg721 cctgcgcagg gtgctggacg aactgaccct ggccagagct gacctggaga tgcagattga781 gagcctgaag gaggagctgg cctacctgaa gaagaaccac gaggaggaga tgaatgccct841 gagaggccag gtgggtggag atgtcaatgt ggagatggac gctgcacctg gcgtggacct901 gagccgcatt ctgaacgaga tgcgtgacca gtatgagaag atggcagaga agaaccgcaa961 ggatgccgag gaatggttct tcaccaagac agaggagctg aaccgcgagg tggccaccaa 1021 cagcgagctg gtgcagagcg gcaagagcga gatctcggag ctccggcgca ccatgcagaa 1081 cctggagatt gagctgcagt cccagctcag catgaaagca tccctggaga acagcctgga1141 ggagaccaaa ggtcgctact gcatgcagct ggcccagatc caggagatga ttggcagcgt 1201 ggaggagcag ctggcccagc tccgctgcga gatggagcag cagaaccagg agtacaagat 1261 cctgctggac gtgaagacgc ggctggagca ggagatcgcc acctaccgcc gcctgctgga 1321 gggcgaggac gcccacctct cctcctccca gttctcctct ggatcgcagt catccagaga 1381 tgtgacctcc tccagccgcc aaatccgcac caaggtcatg gatgtgcacg atggcaaggt 1441 ggtgtccacc cacgagcagg tccttcgcac caagaactga ggctgcccag ccccgctcag 1501 gcctaggagg ccccccgtgt ggacacagat cccactggaa gatcccctct cctgcccaag 1561 cacttcacag ctggaccctg cttcaccctc accccctcct ggcaatcaat acagcttcat 1621 tatctgagtt gcataaaaaa aaaaaaaaaa aaa3.该基因所翻译的氨基酸序列为:MTTCSRQFTSSSSMKGSCGIGGGIGGGSSRISSVLAGGSCRAPS TYGGGLSVSSSRFSSGGAYGLGGGYGGGFSSSSSSFGSGFGGGYGGGLGAGLGGGFGG GFAGGDGLLVGSEKVTMQNLNDRLASYLDKVRALEEANADLEVKIRDWYQRQRPAEIK DYSPYFKTIEDLRNKILTATVDNANVLLQIDNARLAADDFRTKYETELNLRMSVEADI NGLRRVLDELTLARADLEMQIESLKEELAYLKKNHEEEMNALRGQVGGDVNVEMDAAP GVDLSRILNEMRDQYEKMAEKNRKDAEEWFFTKTEELNREVATNSELVQSGKSEISEL RRTMQNLEIELQSQLSMKASLENSLEETKGRYCMQLAQIQEMIGSVEEQLAQLRCEME QQNQEYKILLDVKTRLEQEIATYRRLLEGEDAHLSSSQFSSGSQSSRDVTSSSRQIRT KVMDVHDGKVVSTHEQVLRTKN4. KRT14基因的开放阅读框ORF序列如下:62 atgaccacctgcagccgccagttcacctcctccagctccatgaagM T T C S R Q F T S S S S M K107 ggctcctgcggcatcgggggcggcatcgggggcggctccagccgcG S C G I G G G I G G G S S R152 atctcctccgtcctggccggagggtcctgccgcgcccccagcaccI S S V L A G G S C R A P S T197 tacgggggcggcctgtctgtctcatcctcccgcttctcctctgggY G G G L S V S S S R F S S G242 ggagcctacgggctggggggcggctatggcggtggcttcagcagcG A Y G L G G G Y G G G F S S287 agcagcagcagctttggtagtggctttgggggaggatatggtggtS S S S F G S G F G G G Y G G332 ggccttggtgctggcttgggtggtggctttggtggtggctttgctG L G A G L G G G F G G G F A377 ggtggtgatgggcttctggtgggcagtgagaaggtgaccatgcagG G D G L L V G S E K V T M Q422 aacctcaatgaccgcctggcctcctacctggacaaggtgcgtgctN L N D R L A S Y L D K V R A467 ctggaggaggccaacgccgacctggaagtgaagatccgtgactggL E E A N A D L E V K I R D W512 taccagaggcagcggcctgctgagatcaaagactacagtccctacY Q R Q R P A E I K D Y S P Y557 ttcaagaccattgaggacctgaggaacaagattctcacagccacaF K T I E D L R N K I L T A T602 gtggacaatgccaatgtccttctgcagattgacaatgcccgtctgV D N A N V L L Q I D N A R L 647 gccgcggatgacttccgcaccaagtatgagacagagttgaacctgA A D D F R T K Y E T E L N L692 cgcatgagtgtggaagccgacatcaatggcctgcgcagggtgctgR M S V E A D I N G L R R V L 737 gacgaactgaccctggccagagctgacctggagatgcagattgagD E L T L A R A D L E M Q I E782 agcctgaaggaggagctggcctacctgaagaagaaccacgaggagS L K E E L A Y L K K N H E E 827 gagatgaatgccctgagaggccaggtgggtggagatgtcaatgtgE M N A L R G Q V G G D V N V872 gagatggacgctgcacctggcgtggacctgagccgcattctgaacE M D A A P G V D L S R I L N917 gagatgcgtgaccagtatgagaagatggcagagaagaaccgcaagE M R D Q Y E K M A E K N R K962 gatgccgaggaatggttcttcaccaagacagaggagctgaaccgcD AE E WF F T K T E E L N R1007 gaggtggccaccaacagcgagctggtgcagagcggcaagagcgagE V A T N S E L V Q S G K S E1052 atctcggagctccggcgcaccatgcagaacctggagattgagctgI S E L R R T M Q N L E I E L1097 cagtcccagctcagcatgaaagcatccctggagaacagcctggagQ S Q L S M K A S L E N S L E 1142 gagaccaaaggtcgctactgcatgcagctggcccagatccaggagE T K G R Y C M Q L A Q I Q E1187 atgattggcagcgtggaggagcagctggcccagctccgctgcgagM I G S V E E Q L A Q L R C E 1232 atggagcagcagaaccaggagtacaagatcctgctggacgtgaagM E Q Q N Q E Y K I L L D V K 1277 acgcggctggagcaggagatcgccacctaccgccgcctgctggagT R L E Q E I A T Y R R L L E 1322 ggcgaggacgcccacctctcctcctcccagttctcctctggatcgG E D A H L S S S Q F S S G S1367 cagtcatccagagatgtgacctcctccagccgccaaatccgcaccQ S S R D V T S S S R Q I R T 1412 aaggtcatggatgtgcacgatggcaaggtggtgtccacccacgagK V M D V H D G K V V S T H E 1457 caggtccttcgcaccaagaactga 1480Q V L R T K N *5.引物设计如下。
月季插穗不定根起始的转录组分析和关键基因筛选

A Transcriptomic Analysis of Early Adventitious Roots of Rosa chinensis Cuttingc and Key Gennc Screening
CHEN Jing , CHEN Yuu , Reyimaiayi • ABUDUAINI, FANG Zhigang , Kaidiriye • YUSUPU, MALiufeng*
达基因5 733个,其中2 313个基因上调,2 727个基因下调;在愈伤组织形成期与不定根伸长期之间共筛选出差异
表达基因0 865个,其中0 332个基因上调,533个基因下调;GO功能分析表0 ,差异表达基因主要参与生物过程、
分子功能和细胞组分3大功能;KEGG富集分析结果表0,差异表达基因主要参与植物激素信号转导、次生代谢产
通
、纯度及电 测 南京
基因科
技公司使用Agi—xt 2177 Bioaua/zc)检测提取的To
tal RNA的完整性,检测合构建及转录组测序-13 个重复)利用mRNA特有的po/A ■,通
LRA13423
注:A/A4为不定根未启动期的0个平行样本;B1B0为愈伤组织期 的0个平行样本;C/C2为不定根伸长期的0个平行样本•
1.4.4转录组测序数据分析样品上机测序后经 软件转化生成原始数据(下机数据),这些数据包含 一些接头、低质量的Reaps,采用CutaPapt去除带接 头的序列以及平均质量分数低于Q20的Reads.然 后,用Reads平均质量分布图检测数据的平均质量 分布.用HFAT?将过滤后的Reads比对到参考基 因上,看测序序列的Mapping比例是否高于77%.最 后,将比对到基因组上的Reads分布情况进行统计, 定位区域分别为CDS(编码区)、、nt—u(内含子)、 Inte—enh(基因间区)和UTR(5,和3'非翻译区). 12表达量分析
《2024年人类细胞系中远程增强子—启动子相互作用的识别研究》范文

《人类细胞系中远程增强子—启动子相互作用的识别研究》篇一人类细胞系中远程增强子-启动子相互作用的识别研究摘要:本文着重研究了人类细胞系中远程增强子与启动子之间的相互作用机制,并探索了其相互作用的识别方法。
通过综合运用生物信息学、基因组学及实验生物学手段,我们揭示了增强子与启动子在基因表达调控中的关键作用,为疾病诊断和治疗提供了新的思路。
一、引言在生物学领域,基因表达调控是一个复杂且至关重要的过程,其中增强子与启动子之间的相互作用起着核心作用。
近年来,随着高通量测序技术的发展,大量关于基因组层面的数据被挖掘出来,其中包括增强子与启动子的相互关系。
本文将详细介绍这一相互作用的研究方法和最新进展。
二、增强子与启动子的基本概念1. 增强子:是一段能够增强基因转录活性的DNA序列,通常位于基因的远端或内含子区域。
2. 启动子:是基因转录起始的关键区域,它决定了基因的转录效率和方向。
三、远程增强子-启动子相互作用的研究方法1. 生物信息学分析:利用高通量测序数据,分析增强子与启动子的关联性。
通过基因组层面的数据挖掘,预测可能的相互作用位点。
2. 基因组定位技术:利用ChIP-seq等基因组定位技术,验证预测的相互作用位点。
3. 细胞实验:通过构建细胞模型,观察和分析增强子与启动子在细胞内的相互作用过程。
四、远程增强子-启动子相互作用的识别研究1. 数据收集与预处理:收集人类细胞系的高通量测序数据,包括转录组数据、ChIP-seq数据等。
对数据进行预处理,如质量控制、比对和归一化等。
2. 预测模型构建:利用机器学习算法,构建预测模型。
该模型能够根据基因组数据预测增强子与启动子的相互作用位点。
3. 实验验证:通过细胞实验验证预测模型的准确性。
在细胞模型中,观察和分析增强子与启动子的相互作用过程,验证预测的相互作用位点。
4. 结果分析:对实验结果进行统计分析,揭示增强子与启动子相互作用的规律和特点。
分析不同细胞系中增强子与启动子相互作用的变化,探讨其与疾病发生、发展的关系。
拟南芥及水稻转录因子MADS密码子的偏好性比较
浙江大学学报(农业与生命科学版) 31(5):513~517,2005Journal of Zhejiang U niversity (Agric 1&Life Sci 1)文章编号:100829209(2005)0520513205 收稿日期:2005201229基金项目:国家自然科学基金(39870421);浙江省重点研究项目基金(2003C22007);浙江省“04206"工程水稻品种改良项目.作者简介:李娟(1979—),女,山东省济南人,从事基因组学方面的研究.通讯作者:薛庆中,男,教授,博士生导师,从事植物遗传育种,基因组学方面的研究.E 2mail :qzhxue @hot .拟南芥及水稻转录因子MADS 密码子的偏好性比较李娟1,薛庆中1,2(1.浙江大学沃森基因组科学院,浙江杭州310008;21浙江大学农学系,浙江杭州310029)摘 要:大多数与花发育相关的功能基因属于MADS 基因家族.应用CodonW 的因子分析表明,拟南芥MADS 转录因子家族偏好使用A 、U 结尾的密码子,而水稻MADS 转录因子家族偏好使用G 、C 结尾的密码子.同时通过氨基酸序列的多重比对,表明密码子偏好性与氨基酸序列及二级结构之间存在关联,证实了不同的密码子编码的氨基酸位于蛋白质二级结构的特定位置.关 键 词:水稻;拟南芥;密码子偏性;转录因子;AU 含量中图分类号:S511 文献标识码:AL I J uan 1,XU E Qing 2zhong 1,2(1.J ones D.W atson I nstitute of Genome Science ,Zhej iang Universit y ,H angz hou 310008,China ;2.Dept of A g ronom y ,Zhej iang Universit y ,H angz hou 310029,China )Comparison of MADS transcriptional factor on codon bias in arabidopsis and rice.Journal of Zhejiang University (Agric 1&Life Sci 1),2005,31(5):5132517Abstract :Most of the flower development 2related f unctional genes are belong to MADS transcription factors families.Through the factorial correspondence analysis (FCA )of CodonW ,we can find out that MADS transcriptional factors in Arabidopsis prefer to A 2ending and U 2ending codons ,while that in rice prefer to G 2ending and C 2ending codons.By using the ClustalX for searching the relation between the bias of the codons and second structure of the MADS ,we confirm that the amino acids coding by different codons are on the special position of the second structure of the proteins.K ey w ords :rice ;arabidopsis ;codon usage bias ;transcriptional factors ;AU content 转录因子是指那些专一性地结合于DNA特定序列上,能激活或/和抑制其它基因转录的蛋白质.根据DNA 结合功能域结构,他们主要分为:b HL H (碱基性螺旋2环2螺旋)、bZIP (碱性亮氨酸拉链)、homeodomain 蛋白、MADS 2box 蛋白、zinc 2finger 蛋白、Myb 蛋白、A P2/EREBP 蛋白、HSF 蛋白、HM G 蛋白和A T hook 蛋白等[1]. 植物MADS 基因是一个序列特异的调节基因家族.和其他真核生物转录因子一样MADS 蛋白由MADS (M )、Intervening (I )、Keratin 2like (K )和C 2terminal (C )等结构域组成,属于结构域蛋白.大多数花发育相关功能基因属于MADS 因子家族[2,3],被子植物的大部分MADS 基因参与花发育的调控[4].不仅在花器官原基分化期表达,在植物其它部位也有表达,且某些MADS 2box 在烟草花粉发育全过程中持续表达[5].同时,MADS 2box 基因家族还浙江大学学报(农业与生命科学版)可能与雄性不育和育性恢复有关[6].因此, MADS2box基因对于高等植物花的发育具有重要意义. 植物基因中不同密码子的出现频率明显不同,同一种氨基酸的不同密码子比率也有差异.禾本科作物基因中同义密码子使用偏性的形成与转录相关突变和翻译水平上的选择有关[7].密码子的使用还与基因编码结构和功能及基因表达有密切的联系[8].但有关转录因子密码子使用及其与基因功能的关系却鲜有报道.本文分别对拟南芥和水稻MADS核苷酸CDS序列密码子偏性及其ORF产物水平进行比较分析,并对MADS的氨基酸序列进行多重比对,试图阐明MADS转录因子家族的密码子用法特点,为进一步研究密码子偏性与氨基酸序列的关系提供信息.1 材料与方法1.1 序列数据由()网站下载得到拟南芥转录因子MADS的CDS序列107条(2004年12月9日).由(http://ricetfdb.bio. uni2potsdam.de/)网站下载得到水稻转录因子MADS的CDS序列68条(2004年12月12日).为计算密码子的平均相对性,及分析数据的精确性,我们利用PERL程序在这两个数据中随机提取注释较好的编码序列进行分析.然后用DNAstar中的Editseq软件对拟南芥和水稻的CDS序列进行整理,寻找ORF序列,按照Editseq的参数,翻译成氨基酸序列,统计各个MADS的CDS序列中A、U、G、C含量.1.2 密码子使用频率的计算为避免序列中不同氨基酸含量所造成的偏差,按照Chiapello的方法计算59个密码子中的每种同义密码子的相对使用频率.若某氨基酸在DNA序列中出现N次,并且两个同义密码子1和2分别出现A和B次,则其相对频率分别是A/N和B/N.1.3 因子相关性分析(FCA)为检验序列之间密码子使用上的不同,用CodonW软件对随机的编码序列FCA分析产生密码子偏性使用的相关数据.利用行列所建立的图形同时对基因及转录因子两组数据进行分析,比较他们在多维空间的位置. 用PERL程序对所得数据分类整理,并用Excel对整理后的数据作散点图分析.分别从拟南芥和水稻Edit seq翻译得到的氨基酸序列中随机取得10条序列,用ClustalX程序做多序列比对.2 结果与分析2.1 拟南芥和水稻中MADS转录因子的密码子碱基组成拟南芥和水稻转录因子MADS的编码序列中密码子第1、第2和第3各个位点的AU 含量列于表1.由表1可见,在拟南芥中,A、U 含量顺序由大到小分别为第2(6514%)、第3 (5513%)和第1(5119%).而水稻中,却为第2 (5815%)、第1(4113%)和第3(2915%).这两种作物中,密码子第2位A、U含量均为最高,所不同的是A、U最低含量,拟南芥出现在第1位置,而水稻中却是第3位置.同时从总体上比较,拟南芥MADS转录因子家族A、U平均含量(5715%)高于水稻(4311%). 由表2可知,水稻的MADS转录因子较偏好使用G、C结尾的密码子,如:GCC、U GC、GA G、AUC、CUC、CC G和GU G等.拟南芥的MADS转录因子较偏好使用A、U结尾的密码表1 拟南芥和水稻中MADS转录因子密码子位点的AU含量Table1 AU composition at each position of codons of arabidopsis and rice MADS transcriptional factors 生物序列数第1位点第2位点第3位点平均Arabidopsis1075119%6514%5513%57140% Rice684113%5815%2915%43108% 注:密码子第1、第2和第3位置的A、U含量是由PERL程序计算得出.而总体上A、U含量是由DANstar统计得到.415第31卷 李娟,薛庆中:拟南芥及水稻转录因子MADS密码子的偏好性比较表2 拟南芥和水稻MADS转录因子中59个退化密码子(degerated codons)的平均相对频率Table2 Average relative frequence of t he59degerated codons for arabidopsis and rice MADS transcriptional factors 氨基酸密码子水稻MADS拟南芥MADS氨基酸密码子水稻MADS拟南芥MADSA GCA0115701257N AAU013601496A GCC0135201172P CCA0125501305A GCG0132201164P CCC0121901107A GCU0116901408P CCG0133701173C U GC0171801389P CCU011901414C U GU0128201611Q CAA0132501609D GAC0159601307Q CA G0167501391D GAU0140401693R CGA010*******E GAA0126301471R CGC0126901059E GA G0173701529R CGG01210106F UUU0120801551R CGU010*******F UUC0179201449R A GA0110601358G GGA011430133R A GG0130501259G GGC0146301123S UCA0112901181G GGG0124701169S UCC0127301142G GGU0114701378S UCG011201103H CAC0158901318S UCU0111401296H CAU0141101682S A GC01280113I AUA0120701228S A GU010*******I AUC0153101382T ACA0119201279I AUU012620139T ACC0133501231K AAA0117801426T ACG0128601169 K AA G0182201574T ACU0118601321 L CU G0129401108V GUA010******* L CUU0113601266V GUC0136701226 L UUA010*******V GU G0141901267 L UU G0111801207V GUU0115701382 L CUA010*******Y UAC0171501441 L CUC0133801187Y UAU0128501559 N AAC016401504 注:表中黑体字表示使用频率最高的密码子.子,如:GCU、U GU、GAU、GGU、A GA、和CAA等.不过,拟南芥和水稻中也有偏好性一致的氨基酸,即:谷氨酸、赖氨酸和天冬氨酸,他们分别偏好使用GA G、AA G及AAC. 以MADS家族59个密码子第3位的A、C、G、U的平均相对频率作比较,水稻以C结尾的密码子出现次数最多(12个),占6617%,其次是G(6个)占3313%,未出现A和U结尾的密码子.而拟南芥MADS家族结尾的密码子主要是U为13个,占7212%.其余3种结尾的密码子A、G、C出现概率相差不大,分别是2、2、1.由此可见,双子叶植物拟南芥和单子叶植物水稻的MADS转录因子对密码子的选择有很大的差别.212 拟南芥和水稻MADS转录因子密码子的使用MADS转录因子FCA1,2两轴的分析结果表明,水稻MADS转录因子中,A、U结尾的密码子与G、C结尾的密码子明显分开,G、C结尾密码子距离中心较近,G、C含量相对较高(图1).而拟南芥MADS转录因子中,A、U结尾的密码子几乎都集中在中心附近,G、C结尾密码子却较为分散.表明较偏好使用A、U结尾的密码子.515 第5期浙江大学学报(农业与生命科学版)图1 拟南芥和水稻MADS 转录因子的FCA 分析Fig.1 FCA analysis of MADS transcriptional factors213 拟南芥和水稻MADS 转录因子结构域的序列比对图2结果显示,拟南芥和水稻MADS 结构域多位于N 端,具有一致的氨基酸序列为M 2R (2)7I (2)5R (2)2T (2)2KRR 2G L 2KA (2)5LC (图2).其中最保守的是两个强碱性残基(K 、R )和一个疏水性残基(L ),且有3个MADS 磷酸化位点,即丝氨酸残基(S ),它们在20%~35%(427/20)序列中被其它残基取代.而在MADS 蛋白的下游I 结构域有31~35个氨基酸,其保守性较差.K 结构域虽然是植物转录因子的所特有结构,在动物和真菌中缺乏,但是其保守性也较差.C 结构域位于MADS 的C 端,不仅长度变化很大,且保守性也极差(本图未显示).图2 水稻和拟南芥MADS 氨基酸多序列联配Fig.2 Alignment of t he deduced amino acid sequences of rice and arabidopsis MADS3 讨 论 业已报道,G +C 含量在其同义密码子使用偏性的产生方面占有较大的优势,其密码子使用偏性产生主要与转录水平上的突变有关[10].MADS 属于拟南芥和水稻转录因子家族中较大的一个家族.对MADS 转录因子家族CDS 序列的CodonW 与Edit seq 分析发现,拟南芥中偏好使用以A 、U 结尾的密码子,且在整个CDS 序列中A +U 含量也远远大于G +C.相反,水稻中A +U 含量明显低于G +C.由此推测,基因编码区碱基组分(G +C )含量似乎对同义密码子的偏性发生影响.这一点也存在于其它生物中,但影响程度不同,如:普通小麦、大麦、玉米等禾本科植物中G +C 含量与密码子偏性指标呈高度正相关;而烟草却呈显著负相关,相关系数较小. 同义密码子的使用究竟是由突变偏性或翻译选择产生,还是两者共同作用产生,迄今结论不甚一致[11].笔者对MADS 随机序列的翻译615第31卷 李娟,薛庆中:拟南芥及水稻转录因子MADS密码子的偏好性比较机制研究发现,拟南芥和水稻的ORF序列的密码子使用不同,但这些序列翻译后保守结构域的氨基酸组成仍基本上一致,暗示在MADS 中与翻译选择有一定的关联.这与Wong等的结果吻合[7],他指出禾本科作物在5π2U TR和编码区连接的地方,存在着G/C梯度、密码子偏性及氨基酸使用偏性.笔者还发现,拟南芥和水稻谷氨酸、赖氨酸及天冬氨酸都偏好使用相同的密码子,暗示不同的氨基酸组成对密码子的使用也有一定的影响. mRNA中稀有密码子的使用与蛋白质结构域的连接区和规则二级结构单元连接区有关,翻译速率在连接区会降低[12],密码子使用可能对蛋白质二级结构的形成有影响[13~15]. Oresic[16]等发现,AAC编码的Asn一般位于β2折叠的C末端,而GAU编码的Asp多数位于α2螺旋的N端.基因密码子的使用与基因表达的生理功能有着密切的联系[8,9].Adxdubei[13,14]发现L EU、VAL、G L Y、PRO、G L U、P H E、IL E、SER、T HR等9种氨基酸的同义密码子之间在二级结构的分布上有显著差异,从而得出简并密码子的第三位带有蛋白质三维结构信息的结论.不同三级结构蛋白质的编码基因分成不同的类,而具有相似三级结构蛋白的编码基因则大致聚集在同一类中,从而证明基因密码子偏性与蛋白质三级结构间具有密切的相关性[17].虽然本文对MADS的随机序列做了多重序列比对,每条MADS的氨基酸序列都是以A T G 编码的Met开头,但是关于MADS基因密码子偏好使用对其MADS保守结构域的影响及其蛋白质所携带信息的影响还有待进一步研究.R eferences:[1] Schwechheimer C,Bevan MW.The regulation oftranscription factor activity in plant s[J].T rends PlantSci,1998,3:3782382.[2] Coen E S,Meyeromitz E M.The war of t he whorl:genetic interaction cont rolling flower development[J].N ature,1991,353:31237.[3] Meyerowitz Schnable P S,Wise R P.The molecularbasis of cytoplasmic male sterility and fertilityrestoration[J].T rends in Plant Science,1998,31:752180.[4] Riechmann J L,Meyerowitz E M.MADA domainproteins in plant development[J].Biol Chem,1997,378:107921101.[5] XU Shu2hua(徐树华),Cytology observe on uni2nucleate and bi2nucleate stage ant hers development s inhl2china15rice[J].Journal of Wuh an U niversity(N atural Science Edition)(武汉大学学报自然科学版),1979(2):79284.(in Chinese)[6] SUN Qing2ping,WAN G Li,YE Ping,et al(孙清萍,汪莉,易平,等),Expression analysis of mads2boxgene family on uni2nucleate and bi2nucleate stageant hers on hl2cms system[J].Journal of Wuh anBotanical R esearch(武汉植物学研究),2002,20(5):3252328.(in Chinese)[7] Wong G K S,Wang J,Tao L,et positionalgradient s in gramineae genes[J].G enome R es,2002,12:8512856.[8] Helene C,Frederique L,Michel C,et al.Codon usageand gene function are related in sequences ofA rabi dopsis t haliana[J].G ene,1998,209:GC12GC38.[9] Richard J,Lin K,Tan T.A functional significance forcodon t hird basers[J].G ene,2000,245:2912298. [10] Liu Q P,Tan J,Xue Q Z.Synonymous codon usagebias in rice cultivar93211(Ory z a sativa L.ssp.indica)[J].Acta G enetica Sinica,2003,30(4):3352340. [11] Sharp P M,Stenico M,Peden J F,et al.Codon usage:mutational bias,translational selection,or bot h?[J].Biochem Soc T rans,1993,21:8352841.[12] Tngnaraj T and Azros P,Ribesome2mediatedtranscriptional factor and protein domain organization[J],Pration Science,1996,5:159421612.[13] Adxdubei,I A,Adzhubei,A A.Krasheninoikov,IA,et al.Non2random usage of degenerate codons idrelated to protein t hree2dimensional structure[J].FEBS Lett,1996,399:78282.[14] Adxdubei I A,Adxbubei A A.ISSD version 2.0:taxonomic range extended[J].Nucleic Acids R es,1999,27:2682271.[15] Xie T,Ding D F.The relationship betweensynonymous codon usage and protein structure[J].FEBS Lett,1998,434:91296.[16] Oresic M,Shalloway D,Specific correlations betweenrelative synonymous codon usage and protein secondarystructure[J].Journal of Moiecular Riology,1998,281:31248.[17] GU Wan2jun,MA Jian2ming,ZHOU Tong,et al(顾万君,马建民,周童,等).Codon usage in genes codingfor proteins wit h different tertiary structures[J].ActaBiophysica Sinica(生物物理学报),2002,3(18):80286.(in Chinese)715 第5期。
两种植物组织特异性基因表达方法分析
两种植物组织特异性基因表达方法分析目前研究人员已经在不同植物中分离并证实了多种具有组织表达特异性的启动子,以下是搜集整理的一篇相关,欢迎阅读参考。
ﻭ多细胞生物体内存在不同类型的器、组织、细胞,它们有各自的特性,担负着不同的功能。
例如,植物根表皮中的根毛细胞,主要负责从周围土壤中吸收水分与矿质营养。
与这一功能相适应,它们在发育过程中向外突起管状结构以增加其表面积和吸收水分、养分的能力(Grier-son和Schiefelbein2002);植物根里的内皮层细胞在发育过程中通过特殊的细胞壁加厚和特定部位胼胝质的沉积凯氏带,阻止矿质养分向维管束和地上部分渗透,控制皮层和维管柱之间的物质运输;在茎和叶片中,保卫细胞可以调节内部叶肉细胞与外部环境之间的气体交换,这一过程需要依赖周围细胞通过K离子交换来创造一个调节气孔关闭与打开的膨压(Raschke和Fellows1971)。
这些不同类型器、组织、细胞的,以及它们之间功能的差异,在很大程度上取决于特异性表达的基因。
因此,研究不同器、组织、细胞中呈特异性表达的基因,对了解植物生长发育调控机理,细胞类型与功能之间的关系都有重要意义。
此外,研究组织特异性表达的基因的调控机理,可帮助我们构建植物组织特异性表达体系,有目的地在特定器、组织、细胞中表达特定靶基因,以便进行靶基因功能分析。
组织特异性表达技术在植物基因工程中具有一定的应用前景,如利用植物的特定组织细胞合成所需要的代谢产物,还可以用于作物改良的基因工程等.组织特异性表达技术是近年来植物学研究中的一个重要领域(Ubeda-Tomas等2008;Plett等2010;Duan等2013)。
ﻭ本文主要介绍目前被广泛使用的两种植物组织特异性基因表达方法,即特定启动子驱动法和GAL4/UAS激活标签法.ﻭ1组织特异性启动子驱动法ﻭ1.1植物组织特异性启动子启动子是一段位于功能基因5 端上游的DNA序列,包含特定的保守序列,长度因基因而异。
生物信息学期末考试答案
生物信息学期末考试答案rmatics是一门综合运用生物学、数学、物理学、信息科学以及计算机科学等多个学科的理论方法,以互联网为媒介、数据库为载体,利用数学和计算机科学对生物学数据进行储存、检索和处理分析,并进一步挖掘和解读生物学数据。
Consensus sequence是决定启动序列的转录活性大小的序列。
在各种原核启动序列特定区域内(通常在转录起始点上游-10及-35区域)存在共有序列,这是在两个或多个同源序列的每一个位置上多数出现的核苷酸或氨基酸组成的序列。
数据挖掘通常是利用计算方法分析生物数据,即根据核酸序列预测蛋白质序列、结构、功能的算法等,实现对现有数据库中的数据进行发掘。
EST(Expressed Sequence Tag)是某个基因cDNA克隆测序所得的部分序列片段,长度大约为200~600bp。
相似性是指序列比对过程中用来描述检测序列和目标序列之间相同DNA碱基或氨基酸残基顺序所占比例的高低。
同源性是两个对象间的肯定或者否定的关系,如两个基因在进化上是否曾具有共同祖先。
从足够的相似性能够判定二者之间的同源性。
比对从核酸以及氨基酸的层次去分析序列的相同点和不同点,以期能够推测它们的结构、功能以及进化上的联系。
或是指为确定两个或多个序列之间的相似性以至于同源性,而将它们按照一定的规律排列。
BLOSUM(模块替换矩阵)是指在对蛋白质数据库搜索时,采用不同的相似性分数矩阵进行检索的相似性矩阵。
以序列片段为基础,从蛋白质模块数据库BLOCKS中找出一组替换矩阵,用于解决序列的远距离相关。
在构建矩阵过程中,通过设置最小相同残基数百分比将序列片段整合在一起,以避免由于同一个残基对被重复计数而引入的任何潜在的偏差。
在每一片段中,计算出每个残基位置的平均贡献,使得整个片段可以有效地被看作为单一序列。
通过设置不同的百分比,产生了不同矩阵。
生物信息学是一门综合学科,主要研究生物学系统和生物学过程中信息流的综合系统,运用生物学、数学、物理学、信息科学以及计算机科学等多学科的理论方法,以互联网为媒介、数据库为载体,利用数学和计算机科学对生物学数据进行储存、检索和处理分析,并进一步挖掘和解读生物学数据。
小麦高分子量谷蛋白亚基功能的体外鉴定
作物学报 ACTA AGRONOMICA SINICA 2008, 34(11): 1910−1915/zwxb/ISSN 0496-3490; CODEN TSHPA9E-mail: xbzw@基金项目: 国家自然科学基金项目(30571154, 30771334) 作者简介: 裴玉贺(1980–), 女, 主要从事小麦遗传育种研究。
*通讯作者(Corresponding authors): 晏月明, E-mail: yanym@; 宋希云, E-mail: songxy@Received(收稿日期): 2008-03-06; Accepted(接受日期): 2008-06-09.DOI: 10.3724/SP.J.1006.2008.01910小麦高分子量谷蛋白亚基功能的体外鉴定裴玉贺1,2 孙 辉3 宋希云2,* 晏月明1,* 祭康敏1 李巧云5 何中虎4刘 丽4 黄兴峰3(1 首都师范大学生命科学学院, 北京100048; 2 青岛农业大学生命科学学院, 山东青岛266109; 3 国家粮食局科学研究院, 北京100037; 4 中国农业科学院作物科学研究所, 北京100081; 5 山东省农业科学院蔬菜研究所, 山东济南250100)摘 要: 通过SDS-PAGE 方法回收纯化小麦高分子量谷蛋白亚基1Ax1、1Dx5、1Dy10、1Bx7、1By8和1By9, 然后利用微量配粉方法将单个亚基分别添加到对照“京411”面粉中, 经过揉混仪分析单个亚基对揉面特性的影响, 进而确定各个亚基的功能特性。
根据揉面时间、稳定时间等参数的变化, 6个小麦高分子量谷蛋白亚基对面粉品质的影响表现为1Dy10 > 1Ax1 > 1Dx5 > 1By8 > 1Bx7 > 1By9。
研究结果表明, 通过揉混仪进行体外配粉检测是快速鉴定高分子量谷蛋白亚基功能的一种有效方法。
关键词: 揉面仪; 高分子量谷蛋白亚基; 揉面时间; 稳定时间; 耐揉性In vitro Functional Testing of High Molecular Glutenin Subunits in WheatPEI Yu-He 1,2, SUN Hui 3, SONG Xi-Yun 2,*, YAN Yue-Ming 1,*, JI Kang-Min 1, LI Qiao-Yun 5, HE Zhong-Hu 4, LIU Li 4, and HUANG Xing-Feng 3(1 College of Life Science, Capital Normal University, Beijing 100048; 2 College of Life Science, Qingdao Agricultural University, Qingdao 266109, Shandong; 3 Academy of State Administration of Grain, Beijing 100037; 4 Institute of Crop Sciences, Chinese Academy of Agricultural Sciences, Beijing 100081; 5 Vegetable Research Institute, Shandong Academy of Agricultural Sciences, Jinan 250100, Shandong, China)Abstract : The functions of high molecular weight glutenin subunit (HMW-GS) can be analyzed by determining the parameterssubject to wheat (Triticum aestivum L.) quality. However, to date, only several glutenin subunits have verified in their functions despite a lot of subunits designated. Therefore, a simple and rapid method is highly needed to detect the functions of wheat glu-tenin subunits. The 2 g and 10 g Mixograph have been applied in related studies in Australia and other countries. To determine the function of wheat single HMW-GS, 6 subunits, 1Ax1, 1Dx5, 1Dy10, 1Bx7, 1By8, and 1By9, were separated and purified by SDS-PAGE, and then mixed into flour of Jing 411 individually. Their effects on flour mixing properties were investigated by 10 g Mixograph testing. The tested mixing parameters were mixing time, stability time, peak resistance, peak width, right slop, and width at 8 min. Four kinds of solution were applied to obtain an appropriate control, and the solutions consisted of different com-binations of 0.2% acetic acid, 50 μg mL −1 DTT, 200 μg mL −1 KIO 3, and 0.1% SDS. When signal subunit was added into dough, 6 mixing parameters changed to a different degree. The effects of the 6 subunits on flour quality were ranked as 1Dy10 > 1Ax1 > 1Dx5 > 1By8 > 1Bx7 > 1By9 according to mixing time, and 1Ax1 and 1Dy10 > 1Dx5 > 1By9 > 1Bx7 > 1By8 according to sta-bility time. The peak resistance of 1By8 was the biggest among that of all subunits. The right slop varied little among that of the 6 subunits. The width at 8 min of 1Bx7 was the smallest among that of all subunits. The 1By8 was primarily considered as a good quality subunit in this study. In addition, it is suggest that in vitro small-scale testing used in this study is an effective method to study the function of single HMW subunit.Keywords: Mixograph; HMW-GS; Mixing time; Stability time; Mixing tolerance小麦胚乳贮藏蛋白对加工品质具有重要作用, 特别是高、低分子量谷蛋白亚基与面包烘烤品质密切相关[1-4]。
- 1、下载文档前请自行甄别文档内容的完整性,平台不提供额外的编辑、内容补充、找答案等附加服务。
- 2、"仅部分预览"的文档,不可在线预览部分如存在完整性等问题,可反馈申请退款(可完整预览的文档不适用该条件!)。
- 3、如文档侵犯您的权益,请联系客服反馈,我们会尽快为您处理(人工客服工作时间:9:00-18:30)。
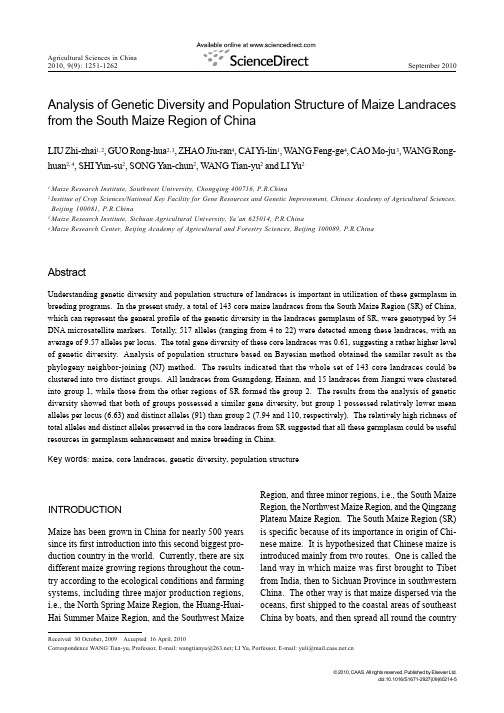
414Genome Informatics14:414–415(2003) Detect of Novel Alternative Form at DevelopmentStages in BrainSungHun Lee1MyungGuen Chung1,2Lsh63430@etri.re.kr aobo@ihanyang.ac.krSungHee Park1SooJun Park1SeonHee Park1sunghee@etri.re.kr psj@etri.re.kr shp@etri.re.kr1Bioinformatics research team,Computer&Software research laboratory,Electronics and Telecommunications Researh Institute,161Gajeong-dong,Yuseong-gu,Daejeon305-350,Korea2Department of biochemistry,HanYang Univ.,Seoul,South KoreaKeywords:Alternative splicing,Development splicing,EST1IntroductionThe total size of mouse genomic DNA sequences in GenBank exceeds100million bases and is rising exponentially[5].But the function of mouse genome is uncharacterized in manyfields.The most of DNA sequences in GenBank consist of EST(Expression Sequence Taq)s and mRNA.Databases of mouse ESTs derived from more than600distinct tissue-specific libraries,and from largely differences development stage(from embryos to age75).These are involved so many information which is need to study of analysis biological mechanism.Especially,EST is a rich source of distinct alternative splicing that is one of the important biological mechanisms of the functional complexity of the mouse genome.Recently,the study of alternative splicing is increased in genome research by the development of computational analysis;software tool.Most of the splice variant is used to study of ESTs,especially tissue specific but don’t use the information of development stage.In this paper,we use the development information of ESTs to detect novel alternative form in Brain.We explain the expression pattern of gene for each development stage.Moreover,we expect that specific splice variants are associated with mouse disease of brain specific.2Implementation2.1Material and MethodEST sequences were downloaded form the NCBI site.(ftp:///genbank/)We were filtering EST data sequences to remove redundant sequences with identical sequences but different annotation.Next,we extracted the information development stage from brain specific EST sequences annotation and classified EST sequences according to each development stage.To candidate alternative splicing form,we aligned EST which belong to same development stage to sequences of draft genome using SIM4and TAP(Transcript Assembly Program)[4].By use of Francis and T.A.Thanaraj’s method,we were conformed the junctions splice[3,7].2.2FiguresFigure1and Figure2indicate generally computational identification of alternative splicing.[6]The most of intronic splice junctions are consist of conserved site;the99.24%of splice site pairs should be GT-AG,0.69%GC-AG,0.05%AT-AC andfinally only0.02%could consist of other types.[2]In the procedure identification of alternative splices,we were conformed different expression pattern that come from same gene.Detect of Novel Alternative Form at Development Stages in Brain415Figure1:Insertion and deletion in ESTs relative to mRNA are identified as potential alternative splices[6].Figure2:Splices are identified and intronic splice junction donor and acceptor sites are checked. Alternative splices are detected when two splices are mutually exclusive[6].3DiscussionNowadays,many of EST databases are consist of useful information that takes many clue for under-standing biological meaning.In this study,we used the information of tissue,development stages in EST databases and analysis software,a public tool.We found that same gene have a different candidate alternative splicing form.So,we expect that this studyfinds new gene structures specified in development stages respectively.Base on this result,we can understand gene expression profile at development stages each tissue;brain,liver,heart,lung,etc.Moreover,we expect that alternative splices are link to tissue-specific disease through further study,because a number of alternative splices play role in diseases and related to tissue specific.So, we hope that study is a useful result and tool to comprehend diseases mechanism in gene-level. References[1]Burke,J.,Wang,H.,Hide,W.,and Davison,D.B.,Alternative gene form discovery and candidategene selection from gene indexing projects,Genome Research,8:276–290,1998.[2]Burset,M.,Seledtsov I.A.,and Solovyev,V.V.,Analysis of canonical and non-canonical splicesites in mammalian genomes,Nucleic Acids Research,28:4364–4375,2000.[3]Francis,J.and Thanaraj,T.A.,Categorization and characterization of transcript-confirmed con-stitutively and alternatively spliced introns and exons from human,Human Molecular Genetics, 11:451–464,2002.[4]Kan,Z.,Rouchka,E.C.,Gish,W.R.,and States,D.J.,Gene structure prediction and alternativesplicing analysis using genomically aligned ESTs,Genome Research,11:889–900,2001.[5]Mironov,A.A.,Fickett,J.W.,and Gelfand,M.S.,Frequent alternative splicing of human genes,Genome Research,9:1288–1293,1999.[6]Modrek,B.and Lee,C.,A genomic view of alternative splicing,Nature Genetics,30:13–19,2002.[7]Thanaraj,T.A.and Francis,J.,Human GC-AG alternative intron isoforms with weak donor sitesshow enhanced consensus at acceptor exon positions,Nucleic Acids Research,29:2581–2593,2001.。