AMX模块使用说明
AMX编程软件介绍+语法说明+实例x2
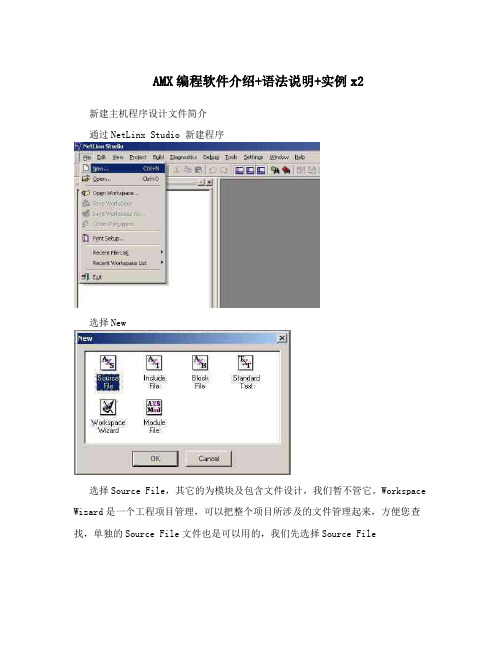
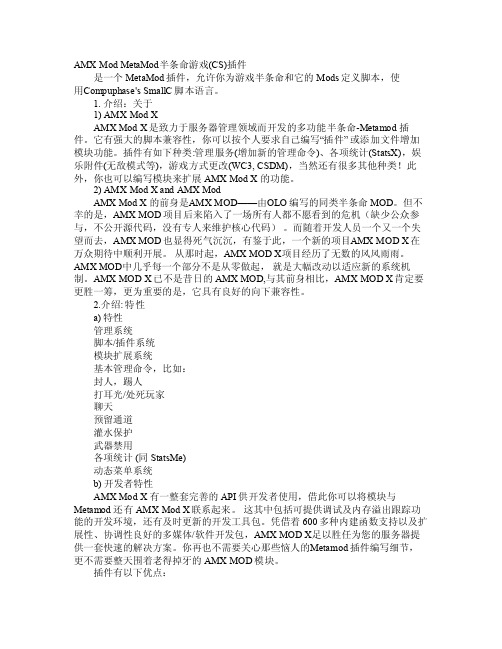
AMX编程软件介绍+语法说明+实例x2 新建主机程序设计文件简介通过NetLinx Studio 新建程序选择New选择Source File,其它的为模块及包含文件设计,我们暂不管它。
Workspace Wizard是一个工程项目管理,可以把整个项目所涉及的文件管理起来,方便您查找,单独的Source File文件也是可以用的,我们先选择Source File是否创建新文件,选择Yes选择,主机的标准模版,网络型主机则选择NetLinx Standard Template输入文件名选择要保存的路径,按下一步。
点击完成,创建出新文件。
把蓝色的字给收起来,总体上我们可以看出分如下几块:PROGRAME_NAME为文件DEFINE_DEVICE为定义要控制设计的控制接口 DEFINE_CONSTANT为定义常量DEFINE_TYPE为定义类型文件DEFINE_VARIABLE为定义变量DEFINE_LATCHING为定义锁住键DEFINE_MUTUALLY_EXCLUSIVE为定义互锁DEFINE_START定义启动时需要执行的程序DEFINE_EVENT为定义事件语句DEFINE_PROGRAME为定义实时的程序语句所有的程序必须放在固定的定义下,如变量必须放在DEFINE_VARIABLE下,事件语句必须放在DEFINE_EVENT如何设置连接并设置固定IP 如何实现NetLinx Studio软件与中控主机的第一次连接:我们可以通过如下几种方式来进行连接:1. TCP/IP2. COM3. Moderom4. USB由于设备的出厂IP地址是设置为DHCP的,所以刚开始我们无法用网络来连接,如果您可以用分配IP的式给中控主机分配一个IP,就可以用刚络连上主机,再对主机进行固定IP设置,就可以直接用网络进行连接,因为通过串口或其它方式,在遇到大文件时传输得太慢,或者可能因为传输文件太大而导致传输失败。
AMXModX之系列说明(简介和安装)
AMX Mo d Met aMod半条命游戏(CS)插件是一个Meta Mod插件,允许你为游戏半条命和它的Mo ds定义脚本,使用C ompup hase's Sma llC脚本语言。
1. 介绍:关于1)AMX M od XAMX ModX是致力于服务器管理领域而开发的多功能半条命-Me tamod插件。
它有强大的脚本兼容性,你可以按个人要求自己编写“插件” 或添加文件增加模块功能。
插件有如下种类:管理服务(增加新的管理命令)、各项统计(Sta tsX),娱乐附件(无敌模式等),游戏方式更改(W C3, C SDM),当然还有很多其他种类!此外,你也可以编写模块来扩展AMX M od X的功能。
2) AMXMod X andAMX M odAMX M od X的前身是A MX MO D——由O LO编写的同类半条命MOD。
但不幸的是,AMX M OD项目后来陷入了一场所有人都不愿看到的危机(缺少公众参与,不公开源代码,没有专人来维护核心代码)。
而随着开发人员一个又一个失望而去,AM X MOD也显得死气沉沉,有鉴于此,一个新的项目A MX MO D X在万众期待中顺利开展。
从那时起,AMX M OD X项目经历了无数的风风雨雨。
AMX MOD中几乎每一个部分不是从零做起,就是大幅改动以适应新的系统机制。
AMXMOD X已不是昔日的AMXMOD,与其前身相比,AMXMOD X肯定要更胜一筹,更为重要的是,它具有良好的向下兼容性。
2.介绍:特性a) 特性管理系统脚本/插件系统模块扩展系统基本管理命令,比如:封人,踢人打耳光/处死玩家聊天预留通道灌水保护武器禁用各项统计 (同Stats Me) 动态菜单系统b)开发者特性AM X Mod X 有一整套完善的API供开发者使用,借此你可以将模块与Metam od 还有 AMXMod X联系起来。
AMX中控-NP-REL8使用说明书(新继电器箱)

二、结构与联接
2.1 前面板说明
○1 ○2 ○3 ○4
○5
○1 、POWER:电源指示灯。 ○2 、RX/TX: RS-232、RS485 通信状态指示灯,RS232、RS485串口通讯控制指令有效时闪烁,
用来指示RS232、RS485控制有效(发送错误控制指令不会闪烁)。
○3 、Button-1~Button-8 按键:
八路电源控制器
用 户 使 用 说 明 书 型号:NP-REL8
在使用产品前,请先详细阅读本使用手册
2013 年 1月发行
注意:
《八路电源控制器——用户手册》只作为用户操作指示,不作为维修服务用途。 发行日期起,此后功能或相关参数若有变更,将另作补充说明,恕不另行通知, 详细可向各经销商查询。
本手册为产品生产商版权所有,未经许可,任何单位或个人不得将本手册之 部 分或其全部内容作为商业用途。
CRESTRON、CREATOR 及所有第三方中控系统。 6、提供八个独立节点控制接口,可外接按键或连接中控系统,对通道开关进行单独开关操作。 7、多个设备可进行 RS-232、RS-485 级联,最大可支持 999 台级联。 8、提供端口互锁功能。 9、提供端口延时操作功能,实现延时时间长达 18 小时或者更多(65535 秒)。 10、提供掉电恢复工作模式,工作过程中意外断电,来电后各通道可时序恢复断电前工作状态
1
一、功能介绍:
八路电源控制器,与可编程中央控制主机或 PC 机通信实现对多种周边设备电源的控制。如用 于控制灯光开关、电动屏幕升降、电动窗帘开合及给投影机、摄像机、会议系统等设备提供电源控 制。
电源控制器内置丰富的通讯接口,可通过RS-232、RS-485或者ETHERNET等通讯接口实现与 可编程中央控制控制主机或者PC机通讯,可通过给电源控制器设置不同的ID,同一通讯接口同时对 多台电源控制器实现通信控制。
AMX软件使用说明-bak
AMX软件使用说明-bakAMX软件使用说明一、介绍AMX软件是一款功能强大的计算机辅助设计工具,用于创建和管理各种项目。
本文档将详细介绍AMX软件的安装、配置和使用方法。
二、安装1、确保计算机满足最低系统要求。
2、AMX软件安装程序。
3、执行安装程序并按照提示完成安装。
三、配置1、打开AMX软件。
2、在设置菜单中,选择适当的语言和界面选项。
3、设置用户权限和访问控制。
4、配置数据库连接,以便AMX软件可以连接到您的项目数据库。
四、创建项目1、在AMX软件中,“新建项目”按钮。
2、输入项目名称、描述和其他相关信息。
3、选择适当的项目类型。
4、配置项目属性和设置。
五、管理项目1、在项目列表中,选择要管理的项目。
2、在项目管理界面中,可以进行项目文件的、和删除操作。
3、添加和管理项目成员及其权限。
4、跟踪项目进度和任务分配。
六、导入和导出数据1、在AMX软件中,选择“导入”或“导出”选项。
2、选择要导入或导出的文件类型。
3、配置文件路径和其他相关参数。
4、执行导入或导出操作。
七、其他功能1、AMX软件提供了丰富的图形绘制和编辑工具,可以使用这些工具创建和编辑项目图表。
2、支持多种数据分析和报表功能,可根据需要进行统计和分析。
3、提供了协作和通信工具,方便项目团队成员之间的交流和协作。
附件:- AMX软件安装包- AMX软件用户手册法律名词及注释:1、著作权:指作者对其原创作品所享有的权利。
2、商标:指用于区别商品来源的标识、名称、符号或设计。
3、许可证:指授权他人使用特定权利或执行特定行为的证书。
4、法律责任:指依法承担因违反法律规定而产生的法律责任。
AMX Mod X之系列说明(相关指令)

pause <文件名> - 暂停指定插件
enable <文件名> - 启用指定插件
save - 保存所有已停用的插件
clear - 清除停用插件列表
list [id] - 列出插件
add <标题>- 将插件标记为不可暂停
amx_statscfgmenu ADMIN_CFG 显示统计配置菜单
配置指令 指令: amx_pausecfg
格式: <指令> [插件名]
权限: ADMIN_CFG
注释: 可用指令列表:
off - 暂停使用所有未包含在停用列表中的插件
on - 恢复使用所有插件
amx_chat <message> ADMIN_CHAT 以普通模式向所有管理员发送消息
amx_psay <名字 或 #userid> <消息> ADMIN_CHAT 向指定文件发送私人消息
amx_tsay <颜色> <消息> ADMIN_CHAT 向所有玩家发送一条置左显示的HUD消息
add <名字> <变量> - 添加统计变量
远程控制指令 指令: amxx
格式: <指令> [参数]
权限:
注释: 可用指令列表:
amxx version - 显示版本信息
amxx modules - 显示模块信息
amxx plugins - 显示插件信息
amx_rcon <rcon 命令行> ADMIN_RCON 在服务器控制台中运行指定命令
AMX语法功能说明
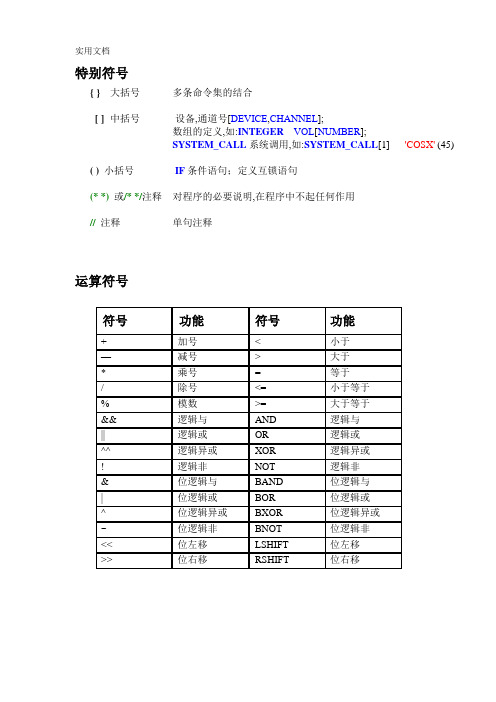
特别符号{ }大括号多条命令集的结合[ ]中括号设备,通道号[DEVICE,CHANNEL];数组的定义,如:INTEGER VOL[NUMBER];SYSTEM_CALL系统调用,如:SYSTEM_CALL[1] 'COSX'(45) ( )小括号IF条件语句;定义互锁语句(* *)或/* */注释对程序的必要说明,在程序中不起任何作用//注释单句注释运算符号常用关键字ON[DEVICE,CHANNEL] // 开OFF[DEVICE,CHANNEL] // 关PULSE[DEVICE,CHANNEL] // 发送脉冲TO [DEVICE,CHANNEL]// 按住多长时间执行多长SEND_COMMAND DEV, '<command string>'SEND_STRING DEV, '<string>'事件处理:BUTTON_EVENT这个关键字规定了一个按钮事件的处理。
它包括按下、释放、持续三个事件,在一个指定的设备通道上,这三个事件与按下和释放按钮是紧密相连的,按钮事件包含一个可选择的反馈信息处理,它在事件处理完成之后立即运行。
在任何时候主线运行了,这个反馈信息处理也被执行。
定义格式如下:BUTTON_EVENT [<device>,<channel>]{PUSH:{/* 当按钮按下去时执行的动作*/}RELEASE:{/* 当按钮松手时执行的动作*/}HOLD [<time>,[REPEAT]]:{/* 当按钮按住时过了多长时间/或每隔多长时间重复执行的动作*/}}Example:BUTTON_EVENT[TP,1]{PUSH: /* 按下触摸屏第一个通道时执行的动作*/{ON[RELAY,1]}}BUTTON_EVENT特性描述表:DATA_EVENT这个关键字规定了一个数据事件的处理。
AMX V Style 模块安装指南说明书
Quick Start GuideMounting Options for V Style Mod ulesOverviewThis Quick Start Guide covers the four versatile mounting kit options that are availablefor mounting AMX V Style Modules of various heights and widths, including variousTransmitters, Receivers, Converters, DADs (Distribution Amplifier Drivers), andICSLan Device Control Boxes.•FG1010-720AVB-VSTYLE-RMK-1U, V Style Module Rack Mounting Tray KitRack mount various size modules side by side in a single rack unit.•FG1010-721AVB-VSTYLE-RMK-FILL-1U, V Style Module Tray with Fill Plates KitRack mount with blank fill plates (1 each: 1/12, 1/6, 1/4, 1/3 rack width).•FG1010-722AVB-VSTYLE-SURFACE-MNT, V Style Single Module Surface Mount KitMount a single module to the wall, under a desk, etc.•FG1010-723AVB-VSTYLE-POLE-MNT, V Style Single Module Pole Mounting KitMount a single module to a projector pole or other 2 inch diameter pipes.This Quick Start Guide contains complete information for installing these mountingkits.Note:Pictorial drawings with dimensions are available at .Tray (FG1010-720) and Tray with Fill Plates (FG1010-721)The Tray Kit can be ordered with or without fill plates. The Tray with Fill Plates Kitcontains a tray and plates in sizes that will fill out the tray for a professional lookinginstallation (fill plates come in 1/12, 1/6, 1/4, and 1/3 rack width sizes).Modules can be mounted in a tray facing either direction as illustrated in FIG. 1.Tip: If multiple fill plates are required, use a minimum of fill plates by selecting thelargest sizes that will fill the space first.To mount modules in a tray:1.Invert the module and the module rack mounting tray for ease of installation.2.Attach the rack mounting tray to the bottom of the module using the #4-403/16 inch undercut flat head screws (provided). Note that only two screws arerequired.3.Install the tray in a standard EIA 19 in. (48.26 cm) rack and secure with rack-mounting screws.4.Optional – attach fill plates using the #4-40 3/16 inch undercut flat head screws(provided). Be sure to use the screw holes closest to the front of the tray.Surface Mount (FG1010-722)Attaching bracketsThe Surface Mount Kit is designed for mounting a single module (to the wall, on orunder a desk, etc.) The kit contains brackets and screws. The brackets may beattached to mount the top or the bottom flush with the mounting surface.Important: Be careful not to block vent holes on the module when mounting.The following instructions can be used for attaching brackets when surface mountingor for pole mounting.Tip: Laying the module and brackets on a flat surface when you attach the bracketshelps align them.To attach brackets to a module:1.Insert the #4-40 3/16 inch pan head screws (provided) per FIG. 4 and tighten.Brackets can either align flush with the top or with the bottom.FIG. 1 Options for placing modules in the tray (shown with fill plates)FIG. 2Invert tray and module (and fill plates if applicable) for ease of installationFIG. 3 Attach brackets in either top or bottom position (various size modules shown)FIG. 4Insert screws and tightenFor full warranty information, refer to 10/11©2011 AMX. All rights reserved. AMX and the AMX logo are registered trademarks of AMX.AMX reserves the right to alter specifications without notice at any time.3000 RESEARCH DRIVE, RICHARDSON, TX 75082 • 800.222.0193 • fax 469.624.7153 • technical support 800.932.6993 • 93-1010-02REV: BMounting on SurfaceNote: The #8 x 1/2 inch tapping pan head screws provided for mounting to a flat surface are designed for wood. If the module needs to be mounted on a different type of surface, use the appropriate type of fastener, e.g., dry wall anchors (not provided).To mount a module with brackets to a flat surface:1.Place the module in the desired final position on the mounting surface and mark the screw position as indicated in FIG. 5.Important: The mark for the screw’s position in each of the mounting holes needs to be made in the end of the slots (all marks to either the top of the slots or all marks to the bottom).2.Set the module aside. If using the wood screws provided, drill pilot holes (drill size 29; hole diameter 0.136 in.) for the screws 1/2 inch (1.27 cm) deep. Start the screws in the holes. Do not tighten completely.3.Align the module with the center of the double key-hole slots over the screws and slide into place as indicated in FIG. 7.4.Tighten the screws.Pole Mount (FG1010-723)The Pole Mount Kit is designed for mounting a single module to a projector pipe (or other 2 inch diameter pipes). The kit contains all the mounting hardware for the assembly in FIG. 9.To mount a module using brackets and bolts:1.Attach the mounting brackets to the module according to the instructions for surface mounting (see FIG. 4).2.Insert the first u-bolt around the pole/pipe and through the bracket and plate according to FIG. 9.3.Fasten securely with the hex nuts.4.Repeat Steps 2 and 3 using the remaining u-bolt, bracket, plate, and hex nuts.FIG. 5 Mark screw positionsFIG. 6 Drill pilot holes and start screws, but do not tightenAlign module over screws and slide into place FIG. 8Tighten screwsFIG. 9 Mount to projector pipe with bolts through brackets。
AMX Mod X之系列说明(配置和管理之一)
antiflood.amxx 防止客户端聊天刷屏
scrollmsg.amxx 显示滚动信息
imessage.amxx 定时居中显示的信息
adminvote.amxx 投票命令
nextmap.amxx 显示地图循环中的下副地图
mapchooser.amxx 允许玩家投票选择下副地图
amx_scrollmsg "Welcome to %hostname% -- This server is using AMX Mod X" 600 设定“走马灯”信息的参数(信息内容及出现频度)
amx_imessage "Welcome to %hostname" "000255100"
"This server is using AMX Mod X\nVisit " "00010025" 屏幕居中显示彩色信息。后面的参数指定颜色,格式为RRRGGGBBB(红,绿,蓝)。
如果重新编译或者插件无法使用,请务必查看源代码。
插件是在AMX MOD 0.9.9以上版本使用的吗?如果是的话,那此 赡苁褂昧诵碌幕蛭薹ㄒ浦驳暮 ?_T() 等等。
插件使用了无法移植的模块吗?有些过期模块,加密代码模块以及糟糕的模块现在无法移植,当然以后更没有可能。比如说:
UDP
MThread
使用以下命令转到scripting目录:
cd addons/amxmodx/scripting
方法一:全部编译
用以下方法之一运行脚本compile.sh:
sh compile.sh
锚定的AMX操作系统认知手册及TRACE32在线帮助说明书
OS Awareness Manual AMX Release 09.2023OS Awareness Manual AMXTRACE32 Online HelpTRACE32 DirectoryTRACE32 IndexTRACE32 Documents ......................................................................................................................OS Awareness Manuals ................................................................................................................OS Awareness Manual AMX (1)History (4)Overview (4)Brief Overview of Documents for New Users5 Supported Versions5Configuration (6)Manual Configuration6 Automatic Configuration7 Quick Configuration Guide7 Hooks & Internals of AMX8Features (9)Display of Kernel Resources9 Task Stack Coverage9 Task-Related Breakpoints10 Task Context Display11 Dynamic Task Performance Measurement12 Task Runtime Statistics13 Task State Analysis14 Function Runtime Statistics15 AMX specific Menu17AMX Commands (18)TASK.DBPool Display buffer pools18 TASK.DEVent Display event groups18 TASK.DEXChange Display message exchanges18 TASK.DMailBoX Display mailboxes19 TASK.DMPool Display memory pools20 TASK.DSEMaphore Display semaphores21 TASK.DSYStem Display system state21 TASK.DTask Display tasks22 TASK.DTIMer Display timers23AMX PRACTICE Functions (24)TASK.CONFIG()OS Awareness configuration information24OS Awareness Manual AMXVersion 09-Oct-2023 History04-Feb-21Removing legacy command T ASK.T ASKState.OverviewThe OS Awareness for AMX contains special extensions to the TRACE32 Debugger. This manual describes the additional features, such as additional commands and statistic evaluations.Brief Overview of Documents for New UsersArchitecture-independent information:•“Training Basic Debugging” (training_debugger.pdf): Get familiar with the basic features of a TRACE32 debugger.•“T32Start” (app_t32start.pdf): T32Start assists you in starting TRACE32 PowerView instances for different configurations of the debugger. T32Start is only available for Windows.•“General Commands” (general_ref_<x>.pdf): Alphabetic list of debug commands.Architecture-specific information:•“Processor Architecture Manuals”: These manuals describe commands that are specific for the processor architecture supported by your Debug Cable. T o access the manual for your processorarchitecture, proceed as follows:-Choose Help menu > Processor Architecture Manual.•“OS Awareness Manuals” (rtos_<os>.pdf): TRACE32 PowerView can be extended for operating system-aware debugging. The appropriate OS Awareness manual informs you how to enable theOS-aware debugging.Supported VersionsCurrently AMX is supported for:•AMX Version 3.04a on the Freescale Semiconductor 68332•AMX on the ARM 7•AMX on Freescale Semiconductor PowerPCConfigurationThe TASK.CONFIG command loads an extension definition file called “amx.t32” (directory“~~/demo/<processor>/kernel/amx”). It contains all necessary extensions.Automatic configuration tries to locate the AMX internals automatically. For this purpose all symbol tables must be loaded and accessible at any time the OS Awareness is used.If a system symbol is not available or if another address should be used for a specific system variable then the corresponding argument must be set manually with the appropriate address. In this case, use the manual configuration, which can require some additional arguments.If you want to display the OS objects “On The Fly” while the target is running, you need to have access to memory while the target is running. In case of ICD, you have to enable SYStem.MemAccess orSYStem.CpuAccess (CPU dependent).Manual ConfigurationFormat:TASK.CONFIG amx.t32 <magic_address> <args><magic_address>Specifies a memory location that contains the current running task. Thisaddress can be found at “cj_kdata+14”.<args>The configuration requires one additional argument that specifies an AMXinternal pointer. Give the label “cj_kdatp”.Manual configuration for the OS Awareness for AMX can be used to explicitly define some memorylocations. It is recommended to use automatic configuration.; manual configuration for AMX supporttask.config amx.t32 cj_kdata+14 cj_kdatpSee Hooks & Internals for details on the used symbols.Automatic ConfigurationFormat:TASK.CONFIG amx.t32For system resource display and trace functionality, you can do an automatic configuration of the OSAwareness. For this purpose it is necessary that all system internal symbols are loaded and accessible at any time, the OS Awareness is used. Each of the TASK.CONFIG arguments can be substituted by '0', which means that this argument will be searched and configured automatically. For a fully automatic configuration omit all arguments:; fully automatic configuration for AMX supporttask.config amxIf a system symbol is not available, or if another address should be used for a specific system variable, then the corresponding argument must be set manually with the appropriate address (see Manual Configura-tion).See also “Hooks & Internals” for details on the used symbols.Quick Configuration GuideT o get a quick access to the features of the OS Awareness for AMX with your application, follow the following roadmap:1.Copy the files “amx.t32” and “amx.men” to your project directory(from TRACE32 directory “~~/demo/<processor>/kernel/amx”).2.Start the TRACE32 Debugger.3.Load your application as normal.4.Execute the command “TASK.CONFIG ~~/demo/<cpu>/kernel/amx/amx.t32”(See “Automatic Configuration”).5.Execute the command “MENU.ReProgram ~~/demo/<cpu>/kernel/amx.men”(See “AMX Specific Menu”).6.Start your application.Now you can access the AMX extensions through the menu.In case of any problems, please carefully read the previous Configuration chapters.Hooks & Internals of AMXAll kernel resources are accessed through the kernel data pointer “cj_kdatp”.The magic location is calculated from “(*c_kdatp+0x14)”.For detecting a message exchanger task, the entry point of that task is compared to the message exchanger task entry point “cj_kpmxtask”). If this symbol is not available, the message exchanger tasks won’t be detected.In the statistics evaluations, the kernel state is derived from the location at “(*cj_kdatp)”.FeaturesThe OS Awareness for AMX supports the following features.Display of Kernel ResourcesThe extension defines new commands to display various kernel resources. Information on the following AMX components can be displayed:TASK.DSYStem system stateTASK.DTask T asksTASK.DTIMer TimerTASK.DMailBoX MailboxesTASK.DESChange Message exchangesTASK.DSEMaphor SemaphoresTASK.DEVent Event groupsTASK.DBPool Buffer poolsTASK.DMPool Memory poolsFor a description of the commands, refer to chapter “AMX Commands”.If your hardware allows memory access while the target is running, these resources can be displayed “On The Fly”, i.e. while the application is running, without any intrusion to the application.Without this capability, the information will only be displayed if the target application is stopped.Task Stack CoverageFor stack usage coverage of tasks, you can use the TASK.STacK command. Without any parameter, this command will open a window displaying with all active tasks. If you specify only a task magic number as parameter, the stack area of this task will be automatically calculated.T o use the calculation of the maximum stack usage, a stack pattern must be defined with the command TASK.STacK.PATtern (default value is zero).T o add/remove one task to/from the task stack coverage, you can either call the TASK.STacK.ADD or TASK.STacK.ReMove commands with the task magic number as the parameter, or omit the parameter and select the task from the TASK.STacK.* window.It is recommended to display only the tasks you are interested in because the evaluation of the used stack space is very time consuming and slows down the debugger display.Task-Related BreakpointsAny breakpoint set in the debugger can be restricted to fire only if a specific task hits that breakpoint. This is especially useful when debugging code which is shared between several tasks. T o set a task-related breakpoint, use the command:•Use a magic number, task ID, or task name for <task>. For information about the parameters, see “What to know about the Task Parameters” (general_ref_t.pdf).•For a general description of the Break.Set command, please see its documentation.By default, the task-related breakpoint will be implemented by a conditional breakpoint inside the debugger. This means that the target will always halt at that breakpoint, but the debugger immediately resumes execution if the current running task is not equal to the specified task.On some architectures, however, it is possible to set a task-related breakpoint with on-chip debug logic that is less intrusive. T o do this, include the option /Onchip in the Break.Set command. The debugger then uses the on-chip resources to reduce the number of breaks to the minimum by pre-filtering the tasks.Break.Set <address>|<range>[/<option>] /TASK <task>Set task-related breakpoint.NOTE:T ask-related breakpoints impact the real-time behavior of the application.For example, on ARM architectures: If the RTOS serves the Context ID register at task switches, and if the debug logic provides the Context ID comparison, you may use Context ID register for less intrusive task-related breakpoints:When single stepping, the debugger halts at the next instruction, regardless of which task hits this breakpoint. When debugging shared code, stepping over an OS function may cause a task switch andcoming back to the same place - but with a different task. If you want to restrict debugging to the current task, you can set up the debugger with SETUP .StepWithinTask ON to use task-related breakpoints for single stepping. In this case, single stepping will always stay within the current task. Other tasks using the same code will not be halted on these breakpoints.If you want to halt program execution as soon as a specific task is scheduled to run by the OS, you can use the Break.SetTask command.Task Context DisplayY ou can switch the whole viewing context to a task that is currently not being executed. This means that all register and stack-related information displayed, e.g. in Register , Data.List , Frame etc. windows, will refer to this task. Be aware that this is only for displaying information. When you continue debugging the application (Step or Go ), the debugger will switch back to the current context.T o display a specific task context, use the command:•Use a magic number, task ID, or task name for <task>. For information about the parameters, see “What to know about the Task Parameters” (general_ref_t.pdf).•To switch back to the current context, omit all parameters.T o display the call stack of a specific task, use the following command:If you’d like to see the application code where the task was preempted, then take these steps:eContextID ONEnables the comparison to the whole Context ID register.Break.CONFIG.MatchASID ONEnables the comparison to the ASID part only.TASK.List.tasks If TASK.List.tasks provides a trace ID (traceid column), thedebugger will use this ID for comparison. Without the trace ID,it uses the magic number (magic column) for comparison.Frame.TASK [<task>]Display task context.Frame /Task <task> Display call stack of a task.1.Open the Frame /Caller /Task<task> window.2.Double-click the line showing the OS service call.Dynamic Task Performance MeasurementThe debugger can execute a dynamic performance measurement by evaluating the current running task in changing time intervals. Start the measurement with the commands PERF.Mode TASK and PERF.Arm, and view the contents with PERF.ListTASK. The evaluation is done by reading the ‘magic’ location (= current running task) in memory. This memory read may be non-intrusive or intrusive, depending on the PERF.METHOD used.If PERF collects the PC for function profiling of processes in MMU-based operating systems(SYStem.Option.MMUSPACES ON), then you need to set PERF.MMUSPACES, too.For a general description of the PERF command group, refer to “General Commands Reference Guide P” (general_ref_p.pdf).Task Runtime StatisticsNOTE:This feature is only available, if your debug environment is able to trace taskswitches (program flow trace is not sufficient). It requires either an on-chip tracelogic that is able to generate task information (eg. data trace), or a softwareinstrumentation feeding one of TRACE32 software based traces (e.g. FDX orLogger). For details, refer to “OS-aware Tracing” (glossary.pdf).Based on the recordings made by the Trace (if available), the debugger is able to evaluate the time spent ina task and display it statistically and graphically.T o evaluate the contents of the trace buffer, use these commands:Trace.List List.TASK DEFault Display trace buffer and task switchesTrace.STATistic.TASK Display task runtime statistic evaluationTrace.Chart.TASK Display task runtime timechartTrace.PROfileSTATistic.TASK Display task runtime within fixed time intervalsstatisticallyTrace.PROfileChart.TASK Display task runtime within fixed time intervals ascolored graphTrace.FindAll Address TASK.CONFIG(magic) Display all data access records to the “magic”locationTrace.FindAll CYcle owner OR CYcle context Display all context ID records The start of the recording time, when the calculation doesn’t know which task is running, is calculated as “(unknown)”.Task State AnalysisThe time different tasks are in a certain state (running, ready , suspended or waiting) can be evaluated statistically or displayed graphically .This feature requires that the following data accesses are recorded:•All accesses to the status words of all tasks •Accesses to the current task variable (= magic address)Adjust your trace logic to record all data write accesses, or limit the recorded data to the area where all TCBs are located (plus the current task pointer).NOTE:This feature isonly available, if your debug environment is able to trace task switches and data accesses (program flow trace is not sufficient). It requires either an on-chip trace logic that is able to generate a data trace, or a softwareinstrumentation feeding one of TRACE32 software based traces (e.g. FDX orLogger ). For details, refer to “OS-aware Tracing” (glossary.pdf).Example: This script assumes that the TCBs are located in an array named TCB_array and consequently limits the tracing to data write accesses on the TCBs and the task switch.Break.Set Var.RANGE(TCB_array) /Write /TraceDataBreak.Set TASK.CONFIG(magic) /Write /TraceDataT o evaluate the contents of the trace buffer, use these commands:Trace.STATistic.TASKState Display task state statisticTrace.Chart.TASKState Display task state timechartThe start of the recording time, when the calculation doesn’t know which task is running, is calculated as “(unknown)”.Function Runtime StatisticsNOTE:This feature is only available, if your debug environment is able to trace taskswitches (program flow trace is not sufficient). It requires either an on-chip tracelogic that is able to generate task information (eg. data trace), or a softwareinstrumentation feeding one of TRACE32 software based traces (e.g. FDX orLogger). For details, refer to “OS-aware Tracing” (glossary.pdf).All function-related statistic and time chart evaluations can be used with task-specific information. The function timings will be calculated dependent on the task that called this function. T o do this, in addition to the function entries and exits, the task switches must be recorded.T o do a selective recording on task-related function runtimes based on the data accesses, use the following command:; Enable flow trace and accesses to the magic locationBreak.Set TASK.CONFIG(magic) /TraceDataT o do a selective recording on task-related function runtimes, based on the Arm Context ID, use the following command:; Enable flow trace with Arm Context ID (e.g. 32bit)ETM.ContextID 32T o evaluate the contents of the trace buffer, use these commands:The start of the recording time, when the calculation doesn’t know which task is running, is calculated as “(unknown)”.Trace.ListNesting Display function nestingTrace.STATistic.FuncDisplay function runtime statistic Trace.STATistic.TREEDisplay functions as call tree Trace.STATistic.sYmbol /SplitTASKDisplay flat runtime analysis Trace.Chart.FuncDisplay function timechart Trace.Chart.sYmbol /SplitTASK Display flat runtime timechartAMX specific MenuThe menu file “amx.men” contains a menu with AMX specific menu items. Load this menu with theMENU.ReProgram command.Y ou will find a new menu called AMX.•The Display menu items launch the kernel resource display windows.•The Stack Coverage submenu starts and resets the AMX specific stack coverage and provides an easy way to add or remove tasks from the stack coverage window.In addition, the menu file (*.men) modifies these menus on the TRACE32 main menu bar:•The Trace -> List submenu is changed. Y ou can additionally choose if you want a trace list window to show only task switches (if any) or task switches and defaults.•The Perf menu contains the additional submenus for task runtime statistics, task-related function runtime statistics and statistics on task states. For the function runtime statistics, a PRACTICEscript file called “men_ptfp.cmm” is used. This script file must be adapted to your application.AMX CommandsTASK.DBPoolDisplay buffer poolsDisplays a table with all created AMX buffer pools.TASK.DEVentDisplay event groups Displays a table with all created AMX event groups.TASK.DEXChangeDisplay message exchangesDisplays a table with all created AMX message exchanges.Format:TASK.DBPool Format:TASK.DEVent Format:TASK.DEXChangeTASK.DMailBoX Display mailboxes Format:TASK.DMailBoXDisplays a table with all created AMX mailboxes.TASK.DMPool Display memory pools Format:TASK.DMPoolDisplays a table with all created AMX memory pools.TASK.DSEMaphore Display semaphores Format:TASK.DSEMaphoreDisplays a table with all created AMX semaphores.TASK.DSYStem Display system state Format:TASK.DSYStemDisplays a system state summary for the current AMX system state.TASK.DTaskDisplay tasksDisplays a table with all AMX tasks or one task in detail.Without any parameters, a summary table of all created tasks is shown.The magic number is a unique ID to the OS Awareness to specify a specific task. It is notequal to the AMX task ID. A double click on the magic number or on the tag opens the detailed task window.If you specify a task magic number, a task ID or a task tag as parameter, this task is shown in detailed. Enclose a task tag in quotation marks. If a numerical parameter is detected to be a AMX task ID, this one will be used. All other numerical parameters are supposed to be a task magic number and are not checked for validation.Format:TASK.DispTask [<task >]<task >:<task_magic> | <task_id> | <task_name>TASK.DTIMer Display timers Format:TASK.DTIMerDisplays a table showing all defined AMX timers.Double click on the parameter to see a dump window on this address. Double click on the procedure to seea list window on this address.AMX PRACTICE FunctionsThere are special definitions for AMX specific PRACTICE functions.See also general TASK functions.TASK.CONFIG()OS Awareness configuration information Syntax:TASK.CONFIG(magic | magicsize | kdata)Parameter and Description:magic Parameter Type: String (without quotation marks).Returns the magic address, which is the location that contains thecurrently running task (i.e. its task magic number).magicsize Parameter Type: String (without quotation marks).Returns the size of the task magic number (1, 2 or 4).kdata Parameter Type: String (without quotation marks).Returns the address of the kernel data area.Return Value Type: Hex value.。
AMX系列简单中文操作手册
AMX系列简单中⽂操作⼿册AMX系列简单中⽂操作⼿册本操作⼿册适⽤于AMX系列模拟矩阵设备实现本地化(300⽶范围内)控制,⽤户端通过OSCAR菜单对服务器进⾏操作访问。
1、硬件连接AMX系列设备硬件包括三个组成部分:1)AMIQ-(PS/2、USB、VSN、WSN、SRL)服务器接⼝线缆2)AMX5000、AMX5010、AMX5020模拟矩阵交换机3)AMX5110、AMX5120⽤户⼯作站硬件安装步骤:1)把AMIQ-xxx服务器接⼝线缆与机房内的被控服务器的键盘、⿏标、显⽰器或console⼝相连;2)把AMIQ-xxx服务器接⼝线缆⽤普通五类线连接到AMX5000/AMX5010/AMX5020模拟矩阵交换机的被控端服务器端⼝;3)把AMX5000/AMX5010/AMX5020模拟矩阵交换机的⽤户控制端⼝⽤普通五类线连接到AMX5110/AMX5120⽤户⼯作站两个端⼝中的任意⼀个端⼝;4)把AMIQ-xxx服务器接⼝线缆与本地PC的键盘、⿏标、显⽰器;5)把(4)中的AMIQ-xxx服务器接⼝线缆⽤普通五类线与AMX5110/AMX5120的另⼀端⼝相连接;6)把控制终端(键盘、⿏标、显⽰器)连接到AMX5110/AMX5120⽤户⼯作站的控制端⼝,提供⽤户操作访问(本地PC或机房内的服务器)。
连接⽰意图,如下:2、OSCAR(On-Screen Configuration and Activity Reporting interface)菜单介绍2.1登陆系统(初始状态没有设定登陆界⾯)如下图所⽰:1)双击“CTRL”键,击活AMX的OSCAR菜单;2)输⼊⽤户名和密码(⽤户帐号由系统管理员分配);3)点击“ok”登陆系统,出现OSCAR⽤户菜单界⾯。
2.2OSCAR菜单介绍登陆AMX系统后,出现OSCAR菜单界⾯,基本切换操作--选择相应的服务器,⽤⿏标点击“Connect”按钮或按键盘的回车键即可(见下图)。
- 1、下载文档前请自行甄别文档内容的完整性,平台不提供额外的编辑、内容补充、找答案等附加服务。
- 2、"仅部分预览"的文档,不可在线预览部分如存在完整性等问题,可反馈申请退款(可完整预览的文档不适用该条件!)。
- 3、如文档侵犯您的权益,请联系客服反馈,我们会尽快为您处理(人工客服工作时间:9:00-18:30)。
AMX中控主机使用Xpanel Pro 控制操作说明
一、Xpanel Pro的功能简介
Xpanel Pro是一款第三方的iPhone&iPad端的控制软件,并提供接口,兼容各种品牌的可编程中控系统。
使用户可以将Apple iPad当触摸屏使用。
无论身处何处,只要轻击Apple平板触摸屏,就可以实时控制中控控制系统,如投影,灯光,信号切换、音响等。
二、Xpanel Pro的安装
Xpanel Pro可以在App Stroe中免费下载。
只需在App Store中搜索Xpanel Pro 就能下载到iPad&iPhone中。
Xpanel Pro支持按钮、进度条、滑动条(AMX称拉条)、网页、天气预报、实时视频、动画、语音控制等功能。
Xpanel Pro自带演示界面,您也可以通过Xpanel Designer界面编写软件自行编写合适的界面。
关于Xpanel Designer 软件的使用说明,请参考<<Xpanel Designer 使用方法>>一文。
这里不详细介绍Xpanel Designer的使用方法。
三、无缝控制AMX NetLinx主机
我们提供了AMX的模块包。
只需导入模块包,就可以实现通过Xpanel Pro软件控制AMX主机。
操作过程如下:
1、运行NetLinx Studio AMX中控主机程序编写软件。
点击
“File->New”,在弹出的窗口中选择新建一个Source。
并点击OK按钮,输入工程名称及保存路径后软件就会自动生成主机程序的框架。
2、根据实际情况添加设备。
(注意红色部份)
3、定义端口变量(我们这里使用了15000这个端口)
这个端口必须要和Xpanel Pro中设置的中控主机端口相同。
4、定义拉条、按钮的通道数。
(Xpanel_Pro暂时只支持999个按钮及999个拉条)
经过上面4步,我们就实现了Xpanel_Pro模块的无缝接入了。
可编写按钮事件或拉条事件。
5、Xpanel Pro的SEND_COMMAND命令说明。
A、通过主机控制iPad跳页:
SEND_COMMAND vdvTP,"'PAGE-1,'" 其中1是页面的jion
B、发送文字
SEND_COMMAND vdvTP,"'^TXT-14,',itoa(lEVEL.V ALUE/2.55),'%'"其中14是txt的jion
C、显示子页
SEND_COMMAND vdvTP,"'^@PPN-12,'"其中12是子页的jion
D、消失子页
SEND_COMMAND vdvTP,"'^PPOF--12,'"其中12是子页的jion
为了方便管理。
我们一般会采用WorkSpace。
把红外文件、模块文件等放在项目中。