DynamicCausalModelling(DCM)forfMRI:动态因果模型DCM的功能磁共振成像
SPM官网
By members & collaborators of the Wellcome Trust Centre for Neuroimaging Introduction| Software | Documentation | Courses | Email list | Data |ExtensionsSPM Menu:Introduction Software Documentation Courses Email list Data setsExtensionsThis page:Introduction Getting started Latest news SPM in briefStatistical Parametric Mapping IntroductionStatistical Parametric Mapping refers to the construction and assessment of spatially extended statistical processes used to test hypotheses about functional imaging data. These ideas have been instantiated in software that is called SPM.The SPM software package has been designed for the analysis of brain imaging data sequences. The sequences can be a series of images from different cohorts, or time-series from the same subject. The current release is designed for the analysis of fMRI,PET, SPECT, EEG and MEG.Getting StartedThe best starting point is to read the introductory article on SPM available here. You could then download the latest version of the software and a data set to analyse. Step-by-step instructions for this analysis are available in the SPM manual.If you're new to imaging, perhaps an epoch fMRI data set would be appropriate. The data sets are provided with instructions on how to use SPM to analyse them. These tutorials therefore give practical instructions on how to implement the various methodologies. Our methods have been written up in books, technical reports and journal papers which are available from our Online Bibliography. This groups documentation according to year, category, author and keyword.If you're looking for help on a particular topic you can find the relevant papers from the Online Bibliography. Alternatively, you can search the SPM pages using the search facility that appears at the bottom of every page. Also browse and search the SPM WikiBook and please feel free to edit it if you can. If you still can't find what you need, you could send an email to the SPM Email list, which gives you access to our community of experts.You should also be aware of the many courses on SPM. If there isn't one in your country this year then there's always the annual short course in London. Finally, once you've mastered SPM you can learn about the various extensions provided by experts in the wider community.Good luck !Latest newsSPM Course for M/EEG VideosJuly 2012: Videos recorded at the May 2012 SPM Course for M/EEG are now freely available online.SPM Course for fMRI/PET/VBM VideosNovember 2011: Videos recorded at the May 2011 SPM Course for fMRI/PET/VBM are now freely available online.SPM8 releasedApril 2009: SPM8 is a major update to the SPM software, containing substantial theoretical, algorithmic, structural and interface enhancements over previous versions (more info).New Book: Statistical Parametric Mapping: TheAnalysis of Functional Brain ImagesNovember 2006: This book provides the background and methodology for the analysis of all types of brain imaging data, from functional magnetic resonance imaging to magnetoencephalography (more info).The SPM approach in briefThe Statistical Parametric Mapping approach is voxel based:∙Images are realigned, spatially normalised into a standard space, and smoothed.∙Parametric statistical models are assumed at each voxel, using the General Linear Model GLM to describe the data in terms of experimental and confounding effects, and residual variability.∙For fMRI the GLM is used in combination with a temporal convolution model.∙Classical statistical inference is used to test hypotheses that are expressed in terms of GLM parameters. This uses an image whose voxel values are statistics, a Statistic Image, or Statistical Parametric Map (SPM{t}, SPM{Z}, SPM{F})∙For such classical inferences, the multiple comparisons problem is addressed using continuous random field theory RFT, assuming the statistic image to be a good lattice representation of an underlying continuous stationary random field. This results in inference based on corrected p-values.∙Bayesian inference can be used in place of classical inference resulting in Posterior Probability Maps PPM s.For fMRI, analyses of effective connectivity can be implemented using Dynamic Causal Modelling DCM.Last modified $Date: 2013/06/24 19:14:39 $ by $Author: guillaume $ home | search | sitemapCopyright © 1991,1994-2013 FILT SoftwareIntroductionSPM is made freely available to the [neuro]imaging community, to promote collaboration and a common analysis scheme across laboratories. The software represents the implementation of the theoretical concepts of Statistical Parametric Mapping in a complete analysis package.The SPM software is a suite of MATLAB (The MathWorks, Inc) functions and subroutines with some externally compiled C routines.SPM was written to organise and interpret our functional neuroimaging data. The distributed version is the same as that we use ourselves.LicenceSPM is free but copyright software, distributed under the terms of the GNU General Public Licence as published by the Free Software Foundation (either version 2, as given in file spm_LICENCE.man, or at your option, any later version). Further details on "copyleft" can be found at /copyleft/. In particular, SPM is supplied as is. No formal support or maintenance is provided or implied.Beta version: SPM12bA beta version of SPM12, SPM12b, was released 21st December 2012 and is available for beta-testing. Please assist us by reporting bugs to <fil.spm@>.Current version: SPM8The current version is SPM8and was released inApril 2009. This provides a major update to theSPMsoftware, containing substantial theoretical,algorithmic, structural and interface enhancementsover previous versions.SPM8 uses the NIfTI-1 file format.Previous versionsWe still provide access to previous versions of SPM, but recommend you use the current version wherever possible.SPM5SPM5 was released in December 2005.SPM2SPM2 was released in 2003.SPM99SPM99was released in January 2000.SPM96 and earlier versions are no longer available.NITRCSPM is listed in the Neuroimaging Informatics Tools andResources Clearinghouse (NITRC ). See /projects/spm/. Funded by the NationalInstitutes of Health Blueprint for Neuroscience Research,NITRC facilitates finding and comparing neuroimagingresources for fMRI and related structural analyses.Last modified $Date: 2014/02/27 12:08:57 $ by $Author: guillaume $ home | search | sitemapCopyright © 1991,1994-2014 FILThe FIL Methods group <fil.spm@ >he FIL Methods group <fil.spm@ > Documentation IntroductionSPM is an academic software toolkit for the analysis of functional imaging data, for users familiar with the underlying statistical, mathematical and image processing concepts. It is essential to understand these underlying concepts in order to use the software effectively. A good starting point is the Introduction to SPM, by Karl Friston.Peer reviewed literatureThe primary reference for the theories underlying SPM are the academic papers in the peer reviewed literature. These are available via the Online Bibliography which organises books, papers and technical reports by year, category, author and keyword. An Annotated Bibliography provides a guide to the various papers.BooksThe book Statistical Parametric Mapping: The Analysis ofFunctional Brain Images (2007) provides the backgroundand methodology for the analysis of all types of brainimaging data, from functional magnetic resonanceimaging to magnetoencephalography. Critically,"Statistical Parametric Mapping"provides a widelyaccepted conceptual framework which allows treatmentof all these different modalities. The book takes thereader from the basic concepts underlying the analysis ofneuroimaging data to cutting edge approaches thatwould be difficult to find in any other source. The materialis presented in an incremental way so that the reader canunderstand the precedents for each new development.This book will be particularly useful to neuroscientistsengaged in any form of brain mapping; who have tocontend with the real-world problems of data analysisand understanding the techniques they are using. It isprimarily a scientific treatment and a didactic introductionto the analysis of brain imaging data. It can be used asboth a textbook for students and scientists starting to usethe techniques, as well as a reference for practicingneuroscientists.The book can be ordered online via Elsevier or, e.g., Amazon.Introductory articles are also provided in the earlier book Human Brain Function. PDFs of draft versions of book chapters are available online: ∙First Edition(1997)∙Second Edition(2003)ManualThere is an SPM8 manual distributed with the software (spm8/man/manual.pdf), which is written by the developers. Much of the manual's contents are also available via the SPM8 user-interface.The release notes accompanying SPM8 contain some useful information.The SPM5 distribution also contains a manual in (spm5/man/manual.pdf). There is no manual for SPM2, but the SPM99 manual is roughly applicable. Methods for DummiesEach year our department runs a series of methods talks by non-experts. Powerpoint versions are available for 2003, organised by Alexa Morcom, 2004, organised by Lucy Lee, 2005, orgainsed by Julia Hocking, 2006, organised by Davina Bristow and Marcus Gray,2007, organised by Justin Chumbley and Hanneke den Ouden,2008 organised by Maria Joao, Hanneke den Ouden and Justin Chumbley,2009organised by Antoinette Nicolle and Maria Joao,2010 organised by Christian Lambert, Suz Prejawa and Maria Joao, and 2011 organised by Rumana Chowdhury, Peter Smittenaar and Suz Prejawa. This years meetings are organised by Mona Gavert, Peter Smittenaar and Giles Story.Third party documentationThere is a SPM WikiBook, which is written and maintained by the international SPM community. The wiki allows users to read and edit the content for free. The end results will be mature, up-to-date and broad repositories for information on SPM. Please do take a look at the SPM wiki and feel free to contribute to it if you can.SPM WikiBooks/wiki/SPMBeginners guides & overviews of SPM :Cambridge Imaging Home Page (MRC Cognition and Brain Sciences Unit) /imagingHistoryThe SPM suite and associated theory was originally developed by Karl Friston for the routine statistical analysis of functional neuroimaging data from Positron Emission Tomography (PET), while at the Medical Research Council Cyclotron Unit. Now known as SPM classic, this software was made available to the emerging functional imaging community in 1991, to promote collaboration and a common analysis scheme across laboratories.SPM'94 was the first major revision of the SPM software. SPM'94 was written primarily by Karl Friston during the summer of 1994, with invaluable conceptual and technical help from John Ashburner, Jon Heather, Andrew Holmes and Jean-Baptiste Poline. SPM'95, SPM'96, SPM'99, SPM2, SPM5 and SPM8are based on SPM'94, and represent the ongoing theoretical advances and technical improvements.Tell me more about SPM history.Last modified $Date: 2013/01/22 11:55:27 $ by $Author: spm $home | search | sitemapCopyright © 1991,1994-2013 FILThe FIL Methods group <fil.spm@>SPM CoursesLondon, May & October 2014The FIL SPM course on using Statistical Parametric Mapping for neuroimaging is held each May and October as part of the Institute of Neurology's short course programme.Since 2010, we provide two separate SPM courses reflecting the different imaging modalities. There is a new three-day course on SPM for EEG/MEG followed by the long-established three-day course on SPM for fMRI/VBM/PET. Both courses are suitable for beginners and more advanced users. We advise students to gain at least some minimal familiarity with the methodology, for example, from reading introductory articles available from the SPM web pageor by following data analysis examples in the SPM manual.The next SPM courses in London will take place on 12-14 May 2014 (MEG/EEG) and 15-17 May 2014 (MRI/VBM/fMRI).The courses are organised through the Institute of Neurology(contact: Miss Jean Reynolds at the IoN to register).Externally organised SPM coursesOther SPM courses are organised around the world at different times of year and in different languages. If you do organise one, please let us know so that it can be listed here.Lausanne SPM Course, Switzerland, 22-25 April 2014This 6th edition of the Lausanne SPM course will focus on how to conduct neuroimaging studies using structural and functional MRI data within the framework of Statistical Parametric Mapping (SPM). This 4 days course is divided into two modules with theoretical and practical sessions covering all aspects of imaging data analysis from spatial pre-processing to statistical inference and reporting results. The course is suitable both for beginners and for those with previous experience of SPM.http://www3.unil.ch/wpmu/lren-spm/Zurich SPM course, Switzerland, 2015This three-day course, which is held annually since 2007, offers a comprehensive coverage of all MRI-related aspects of SPM./spm-course-2014/Course material for 2008, 2009, 2010, 2011, 2012, 2013, 2014Hannover SPM course, Germany, 3-4 November 2014The 7th SPM workshop for Beginners in Hannover, Germany, will be held on November 03. and 04. 2014. (teaching language: german)More information and program:http://www.spmworkshop-hannover.de/SPM Workshops at the Martinos Center, Boston, Massachusetts, USA: /martinos/training/fMRI-Extension/SPM8.phpMRN fMRI Image Acquisition and Analyses Course, University of Colorado, Boulder, USA:/courses/Slides of previous coursesThe latest course material are from 2013 (fMRI/VBM) and 2013 (MEEG).Archive:2002, 2003, 2004, 2005, 2005 (USA), 2006, 2007, 2008 (May), 2008 (October), 2009 (May), 2009 (October), 2009 (MEEG), 2010 (fMRI), 2010 (MEEG), 2010 (Vancouver), 2010 (October), 2011 (Brussels)May 2011 (fMRI), May 2011 (MEEG), Oct 2011 (fMRI), 2012 (MEEG, Lyon), May 2012 (fMRI/VBM), 2012 (MEEG), Oct 2012 (fMRI/VBM), May 2013 (fMRI/VBM).These can be viewed using the Microsoft PowerPoint Viewer for Windows or the multi-platform Open Office.RecordingsOnline videos are now available, recorded at the May 2011 SPM for fMRI/PET/VBM course and at the May 2012 SPM for MEG/EEG course. Higher quality versions of the videos can be obtained on a DVD available for purchase.Last modified $Date: 2014/02/26 16:06:03 $ by $Author: guillaume $ home | search | sitemapCopyright © 1991,1994-2014 FILThe FIL Methods group <fil.spm@>Discussion ListIntroductionThe SPM discussion list is an electronic mailing list for discussion and help with the methodology, implementation and use of Statistical Parametric Mapping and the SPM package. The list is not moderated, but is monitoredand owned by members of the Wellcome Trust Centre for Neuroimaging. Much of the approach and use of SPM is described in the documentation. Subscribers are urged to consult these sources, and any local expertise, before using the discussion list as a helpline. A response from one of the SPM authors cannot be guaranteed, due to resource limitations. Experienced list members are therefore encouraged to address issues within their experience, posting their responses & discussion to the list for general enlightenment.Searching archives∙Archives of SPM messages.∙Search SPMarchives.SubscriptionThe list is run at the UK's automated JISCmail service.To subscribe or unsubscribe to the SPM list:Enter your details at /cgi-bin/webadmin?SUBED1=spm&A=1To send a message to all the people currently subscribed to the SPM list: Just send a mail to <spm@> after subscription.If you have difficulties, then have a look to the frequently asked questions about JISCmail or email the list owner at <fil.spm@>, for assistance. Last modified $Date: 2013/01/22 11:55:31 $ by $Author: spm $home | search | sitemapCopyright © 1991,1994-2013 FILThe FIL Methods group <fil.spm@>Data sets and tutorialsIntroductionThe following data sets are being made available for training and personal education and evaluation purposes. Those wishing to use these data for other purposes, including illustrations or evaluations of methods, should contact the Methods group at the Wellcome Trust Centre for Neuroimaging.A set of instructions showing how SPM can be used to analyse each data set are also provided. These tutorials show how one can use SPM to implement analyses of PET data, epoch or event-related fMRI data, and data from a group of subjects using Random effects analyses (RFX). They also cover more advanced topics such as Psychophysiological Interactions (PPI s) and Dynamic Causal Modelling (DCM).fMRI: epochThe instructions accompanying these data sets show you how to implement a block-design fMRI analysis in SPM. They are both single-subject or 'first-level' analyses.∙Auditory - single subject∙Attention to Visual Motion - single subjectThe instructions accompanying the Attention to Visual Motion data also show you how to use SPM to implement, for example, Psychophysiological Interactions (PPI s) and Dynamic Causal Modelling (DCM).fMRI: event-relatedThe instructions accompanying these data sets show you how to use SPM to analyse data for an event-related fMRI experiment. This includes, for example, selection of different temporal basis sets. They are both single-subject or 'first-level' analyses.∙Repetition primingfMRI: multi-subject (random effects) analyses These data sets comprise contrast images from single-subject fMRI analyses or 'first-level' analyses from the repetition priming experiment described here.In the summary statistic approach to Random Effects Analysis (RFX) these contrast images are then used in a 'second-level' analysis allowing you to make inferences about the population from which the subjects were drawn.∙fMRI: multi-subject (random effects) analysesfMRI: Bayesian comparison of DCMsDynamic Causal Models from an event related fMRI study of the language system are available here∙fMRI: Bayesian comparison of DCMsEEG Single Subject Mismatch Negativity datasetThis is an 128-channel EEG single subject example data set which is used for demonstrating the usage of scripts in M/EEG pre-processing and DCM for evoked responses.Anaesthesia Depth in Rodent DataThis 2-channel Local Field Potential (LFPs) dataset demonstrates the use of DCM for Cross Spectral Densities.Multi-modal facesThis archive contains EEG, MEG and fMRI data on the same subject within the same paradigm.It can be used to examine how various measures of face perception, such as the "N170" ERP (EEG), the "M170" ERF (MEG) and fusiform activation (fMRI), are related. For example, the localisation of the generator(s) of the N170 and/or M170 can be constrained by the fMRI activations.It also includes a high resolution anatomical MRI image (aMRI) for construction of a head-model for the EEG and MEG data, together with data from a Polhemus digitizer that can be used to coregister the EEG and MEG data with the aMRI.FieldMapHere are two example data sets that can be used to demonstrate the usage of the FieldMap toolbox.PETThe instructions accompanying these data sets show you how to use SPM to analyse PET data.∙Verbal fluency - multiple subjects∙Motor activation - single subjectLast modified $Date: 2014/04/30 17:48:34 $ by $Author: guillaume $ home | search | sitemapCopyright © 1991,1994-2014 FILThe FIL Methods group <fil.spm@>SPM ExtensionsIntroductionMany SPM users have created tools for neuroimaging analyses that are based on SPM. You will find here a list of these tools classified between Toolboxes, Utilities, Batch Systems and Templates. The distinction between Toolboxes and Utilities can be blurry, but for the purposes of this page we define a toolbox to be a utility that can be completely operated via a graphical user interface.If you notice inaccuracies or out of date links, please email the SPM manager. Likewise, to have your SPM extension linked here, send an email including a URL, a contact email, and a brief summary (please note if any MATLABtoolboxes are required, or if it is platform-specific).The SPM Developers take no responsibility for the usability of the extensions listed here. In particular, some extensions may be mutually incompatible. Please contact the respective extension authors with questions and problems (though CC'ing answered questions to the Email list will be appreciated).Extensions compatible with SPM8, SPM5, SPM2, SPM99.The list of SPM extensions is also available as an RSS feed.Note: All email addresses in this page have their "@" replaced with "_at_" to minimize spam. Please reverse this change before emailing.Quick LinksToolboxes:AQuA | AAL | ACID | ALVIN | ArtRepair | AMAT | AnalyzeMovie | Anatomy | aslm | ASLtbx | at4fmri | aws4SPM | BrainNetViewer | BredeQuery | CCAfMRI | CLASS| Clinical| Complexity| conn| CPCA| DAiSS| DICOMCD_Import| Diffusion_II | Distance | DPARSF | DRIFTER | EMS | ExtractVals | FASL | FAST | FDR | FieldMap | fieldmap_undistort | FieldTrip | fMRIPower | fOSA | Grocer | HRF | HV | IBASPM | iBrainAT | iBrainLT | INRIAlign | IBZM_tool | ISAS | LI | LogTransform | MARINA | MarsBar | MASCOI | mfBox | Masking | Masks | MM | multifocal | NIRS-SPM | NS | Ortho | PSPM | REST | rfxplot | RobustWLS | SCRalyze| SDM| SimpleROIBuilder| SnPM| spm_wavelet| SPMd| SPMMouse| SSM| SUIT| SurfRend| TOM| UF2C| Unwarp2| Volumes| WBM | WSPM | WFU_PickAtlas | xjView | XMLToolsUtilities:AveLI| BrainMagix| Bruker2Analyze| CBMG-Tools| Design_Magic| dicom2nifti| DynPET| Easy_ROI| Easy_Volumes| FDRill| Fluctuation| fToolbelt| FAD| GA| GE2SPM| GIFT| JG| L2S| log_roi_batch| LMGS| Motion| mri_toolbox| MSU| Orth1| PCT| pvconv| r2agui| SEM| slice_overlay | TSDiffAna | TSU | iTT | VBMtools | VIS | visionToSPM | VoiTool Batch Utilities:aa| AutoSPET| BatchAAL| KULscripts| parallelize_matlabbatch| spm_segment | spm2-batch | spm2batch | spm2Batch | spmbatch | spmjob | X_batch | zephyrTemplates:Baboon| BrainDev_Atlas| Cerebellum| CCHMC_Pediatric| Macaca_Fascicularis| Macaca_Fascicularis_PET| Macaca_Mulatta| Macaca_Nemestrina | Rat | SPMtemplates | UNC_Pediatric | Zebra_FinchToolboxesAQuA SPM5Summary: AQuA is a tool that helps you in the assessment process for the quality of the acquired fMRI data, identifying images with movement and other artefacts, so that they do not compromise the experimental analysis. Author: Antonios Antoniou and Juan J. LullURL: http://www.ibime.upv.es/mi/AAL - Anatomical Automatic Labeling SPM99 SPM2 SPM5 SPM8Summary: Automated parcellation method, as described in Tzourio-Mazoyer et al. NI 2002.Author: CyceronURL: rs.fr/spip.php?article217ACID - Artefact correction in diffusion MRI SPM8 Summary: The Artefact correction in diffusion MRI (ACID) toolbox is an academic software toolkit for pre-processing of diffusion MRI data, estimation of DTI indices and normalisation of DTI index maps, which fully integrates into the batch system of SPM8.Author: Siawoosh MohammadiURL: /ALVIN - Automatic Lateral Ventricle delIneatioNSPM8Summary: Segmentation of the lateral ventricles validated in infants, adults and patients with Alzheimer's disease. Works with both T1 and T2 images. Author: Matthew KemptonURL: /site/mrilateralventricle/ArtRepair - Artifact Repair toolbox SPM2 SPM5 SPM8Summary: Special methods to improve the fMRI analysis of high motion pediatric and clinical subjects. The methods correct for large motions, and automatically detect and remove artifact noise in the data. Viewing tools allow quality checking at every step in the analysis.Author: Paul MazaikaURL:/tools/human-brain-project/artrepair-software.html AMAT: A meta-analysis toolbox SPM2Summary: AMAT is a matlab program which lets you search through the coordinates reported in lots of fMRI papers. It is designed to answer the frequently asked question: what the *?%! does that bit do?Author: Antonia HamiltonURL: /amat.htmlAnalyzeMovie - AVI movies from Analyze images SPM99Summary: Create AVI movies from Analyze images, of axial, coronal, sagittal or ortho slices. Requires Matlab6 or greater.Author: Robert WelshURL: /ni-stat/AnalyzeMovie.tarAnatomy - SPM Anatomy toolbox SPM99 SPM2 SPM5 SPM8Summary: This toolbox integrates probabilistic cytoarchitectonic maps derived from human post-mortem studies into the SPM environment and provides a wide range of different approaches to analyse structure / function correlations.Author: Simon EickhoffURL:http://www.fz-juelich.de/inm/inm-1/DE/Forschung/_docs/SPMAnatomyToolbox /SPMAnatomyToolbox_node.htmlaslm - a slightly modified asl-module SPM8 Summary: aslm is an object orientated toolbox for common tasks associated with the analysis of arterial spin labeling (ASL) and other MRI data.Author: Philipp HomanURL: ASLtbx SPM2 SPM5 SPM8Summary: ASLtbx is a Matlab and SPM based toolkit for processing arterial spin labeling (ASL) perfusion MRI data. It's basically a collection of a bunch of batch scripts. I'm currently only distributing the SPM5-based version, but the SPM2(or 8)-based version can be obtained through email. The function for quantifying cerebral blood flow should be SPM independent except the image reading and writing functions from SPM.Author: Ze WangURL: /~zewang/ASLtbx.phpat4fmri - adaptive thresholding of fMRI maps SPM8 Summary: Allow to obtain a threshold for cluster FDR - the method fits a Gamma-Gaussian mixture model to the SPM-T and finds the optimal threshold(crossing between noise and activation). Optionally write the thresholded maps.Author: Chris Filo Gorgolewski and Cyril PernetURL: /projects/at-4-fmri/aws4SPM SPM2 SPM5 SPM8Summary: Structural adaptive smoothing fMRI data as described in Tabelow et al. NI (2006).Author: Devy Hoffmann and Karsten TabelowURL: http://www.wias-berlin.de/software/aws4SPM/BrainNet ViewerSummary: BrainNet Viewer is a brain network visualization tool, which can help researchers to visualize structural and functional connectivity patterns from different levels in a quick, easy, and flexible way.Author: Mingrui XiaURL: /projects/bnv/BredeQuery SPM5Summary: BredeQuery plugin for SPM5 - enables coordinate-based meta-analytic search of related literature for brain regions directly from SPM5 environment. The coordinate-based search is performed using Finn Aarup Nielsen's Brede Database. Works with coordinates in Talairach and MNI space, MNI-to-Talairach transformations are available (Brett and Lancaster transformations). Moreover, query results can be exported automatically to the suitable bibliographic file format (BibTeX, Reference Manager, RefWorks, EndNote).Author: Bartlomiej WilkowskiURL: http://neuro.imm.dtu.dk/wiki/BredeQueryCCA-fMRI SPM2 SPM5Summary: The CCA-fMRI utilizes canonical correlation analysis in combination with the Balloon model and adaptive filtering of fMRI data to detect areas of brain activation. The CCA-fMRI toolbox provides its own user interface and can also be used as stand alone scripts, e.g. for batch processing.Author: Magnus BorgaURL: /CLASS - Classifier Learning for Asymmetrically Small Samples SPM8Summary: Multivariate kernel-based pattern classification using support vector machines (SVM) with a novel modification to obtain more balanced sensitivity and specificity on unbalanced data-sets (i.e. those with very different numbers of cases in each group).Author: Ged RidgwayURL: Contact email aboveClinical Toolbox SPM8Summary: Aids normalization of clinical scans, providing an easy way to include lesion cost function masking. Allows unified segmentation-normalization (USN) or traditional normalization. Includes custom age adjusted templates for CT/CAT scans and USN. Includes FLAIR template provided by the Glahn group.Author: Rorden, Bonilha, Fridriksson, Bender and KarnathURL: /CRNL/clinical-toolbox Complexity SPM8Summary: Complexity is a toolkit used to analyze the complexity of resting state fMRI (rs-fMRI) data. Pre-processing module is included to realize low pass filtering and linear detrending. Five methods, Approximate Entropy, Sample Entropy, Cross Approximate Entropy, Multiscale Sample Entropy and Wavelet MSE, are available to calculate the entropy. Matlab toolbox, "Tools for NIfTI and ANALYZE image", is needed.。
fmri技术的原理及应用
fmri技术的原理及应用1. 引言功能性磁共振成像(functional magnetic resonance imaging,以下简称fmri)是一种非侵入性的神经影像学方法,用于研究大脑在特定任务中的功能活动。
本文将介绍fmri技术的原理以及其在神经科学研究和临床应用中的重要性。
2. 原理fmri基于血液供应和代谢的相关性,通过测量血液中氧气含量变化来推断大脑活动的区域和程度。
具体而言,fmri利用磁共振成像(magnetic resonance imaging,MRI)技术,测量血氧水平依赖(blood oxygenation level dependent,BOLD)信号来间接反映神经元的活动。
当神经元活跃时,细胞对氧气的需求增加,导致血液流动增加,血液中含氧量增加。
这种激活效应通过fmri技术可被探测到,并转化为图像显示。
3. 应用领域fmri技术在神经科学研究和临床应用中具有广泛的应用价值。
以下是一些主要的应用领域:• 3.1 认知神经科学fmri可以帮助研究者了解不同认知过程中的大脑活动模式。
通过比较在特定任务下不同个体或者不同条件下的fmri图像,研究者可以揭示大脑的功能连接及其变化,进一步研究记忆、学习、决策等认知过程。
• 3.2 精神疾病研究fmri技术在研究精神疾病中的应用发挥着重要作用。
例如,研究者可以通过比较患者与健康对照组的fmri数据,来发现精神疾病患者的大脑活动模式的差异,有助于理解疾病的发生机制,并为临床诊断和治疗提供参考。
• 3.3 神经反馈训练fmri技术还可以应用于神经反馈训练,通过让个体观察自身大脑活动的实时变化,在训练过程中调节注意力和自我调节能力。
这种技术可以被用于焦虑症、注意力缺陷多动障碍等疾病的治疗。
• 3.4 意识状态评估在一些疑似昏迷或意识障碍的患者中,fmri技术可以帮助评估其意识状态。
通过分析患者的fmri数据,研究者可以了解患者的脑活动是否存在与自发意识相关的特征,以辅助临床决策。
基于SPM2动态因果模型操作练习

2 Categories of Functional integration analysis
Functional connectivity
= the temporal correlation between spatially remote areas
MODEL-FREE
PPI
Effective connectivity
•The modelled neuronal dynamics (z) are transformed into area-specific BOLD signals (y) by a hemodynamic forward model (λ).
The aim of DCM is to estimate parameters at the neuronal level so that the modelled BOLD signals are most similar to the experimentally measured BOLD signals.
Dynamic Causal Modeling (DCM)
A Practical Perspective
Ollie Hulme Barrie Roulston Zeki lab
Disclaimer
The following speakers have never used DCM. Any impression of expertise or experience is entirely
V1
1. Which parameters do you think are most relevant? Which parameters represent my hypothesis? Which are the most relevant intrinsic anatomical Connections? Which are the most relevant changes in effective connectivity/connection strength ? Which are the relevant sensory inputs ?
功能磁共振数据处理

时间序列校正
How? 备注:
Bottom =1 Slice order: [1:2:n-1slice 2:2:nslice]
← 单个run的数据 ← 32 ←2 ← TR-TR/nSlice ← 1 3…31 | 2 4 …32 ← 16 | 31
Slice timing
批处理
FMRI原理
自旋 进动 磁化矢量 共振 豫弛
T1像 T2像
自旋回波
TR D 实验设计
Block
Event-related
SPM:
SPM介绍 数据准备 预处理
Slice timing Realign Coregister “Segment” Normalize Smooth
边学边教FMRI数据分析
Outline
知识准备:
FMRI原理
自旋 进动 磁化矢量 共振 豫弛
T1像 T2像
自旋回波
TR & TE T1像&T2像
BOLD 实验设计
Block
Event-related
SPM:
SPM介绍 数据准备 预处理
自旋回波
TR & TE T1像&T2像
BOLD 实验设计
Block
Event-related
SPM:
SPM介绍 预处理
Slice timing Realign Coregister “Segment” Normalize Smooth
统计分析
Specify 1st-level Specify 2nd-level Review “DCM”
特斯拉动态引力理论原文
Introduction:
There is a new theory of gravity called Dynamic Theory of Gravity [DTG]. Based on classical thermodynamics Ref:[1] [2] [3] [9] it has been shown that the fundamental laws of Classical Thermodynamics also require Einstein’s
p 4 = mv 4 ,
(1a)
where the velocity in the fifth dimension is given by:
•
γ v4 = , αD
•
(1b)ቤተ መጻሕፍቲ ባይዱ
and γ is a time derivative where gamma itself has units of mass density or kg/m3, and αo is a density gradient with units of kg/m4. In the absence of curvature, (1) becomes:
(5)
and for orbiting Hubble telescope (ht) of a height h the following expression:
ln[1 + z ht ] = −
M em HL R⊕ G M⊕ − . + c 2 (R + h ) + R R h ⊕ c ⊕ em
Abstract:
In a new theory called Dynamic Theory of Gravity, the cosmological distance to an object and also its gravitational potential can be calculated. We first measure its redshift on the surface of the Earth. The theory can be applied as well to an object in orbit above the Earth, e.g., a satellite such as the Hubble telescope. In this paper, we give various expressions for the redshifts calculated on the surface of the Earth as well as on an object in orbit, being the Hubble telescope. Our calculations will assume that the emitting body is a star of mass M = MX-ray(source) = 1.6×10⁸ Msolar masses and a core radius R = 80 pc, at a cosmological distance away from the Earth. We take the orbital height h of the Hubble telescope to be 450 Km.
fmri的原理与应用

fmri的原理与应用1. 介绍功能磁共振成像(functional magnetic resonance imaging, fMRI)是一种用于观察人脑活动的非侵入性成像技术。
它利用磁共振成像(MRI)技术测量脑部血氧水平的变化,从而间接反映出神经活动的强度和区域。
本文将介绍fmri的原理和应用。
2. 原理•fMRI利用血氧水平依赖性信号(blood oxygenation level dependent, BOLD)来观测脑部活动。
当神经元活跃时,局部血流量增加,血红蛋白中的氧含量也增加。
这种血氧水平的变化可以通过MRI技术进行测量和成像。
•BOLD信号是在基于磁场的MRI仪器中通过磁共振检测到的。
MRI 仪器用于测量脑部不同区域的氧含量和血液流动情况,并生成相应的图像。
3. 应用3.1 神经科学研究fMRI广泛用于神经科学研究,可以帮助研究者理解人脑的功能和结构。
以下是一些常见的应用: - 神经功能定位:fMRI被用于确定特定的脑区在特定功能过程中的参与程度,如语言和视觉处理等。
- 神经网络建模:通过观察大脑在特定任务下的活动,研究者可以构建神经网络模型,来解释和预测人脑的功能。
- 研究脑部疾病:fMRI可以帮助研究人员了解脑部疾病的发病机制和病理生理。
3.2 临床诊断与治疗fMRI也有一些临床应用,可以帮助医生进行诊断和治疗。
- 神经影像诊断:fMRI可以提供更详细、准确的脑部图像,用于辅助医生对脑部疾病的诊断。
- 神经可塑性训练:通过观察患者在特定任务下的脑活动,医生可以利用fMRI来指导和监测神经可塑性训练,促进康复。
- 术前计划:对于需要进行脑部手术的患者,fMRI可以提供精确的脑图像和功能定位信息,帮助医生进行术前计划。
4. 优缺点4.1 优点•非侵入性:fMRI是一种非侵入性的成像技术,不需要对患者进行手术或注射药物。
•高时空分辨率:fMRI可以提供高时空分辨率的脑图像,可以监测到神经活动的细微变化,并定位到特定的脑区。
Dynamic Causal Modelling (DCM) for fMRI动态因果模型(DCM)的功能磁共振成像

z1
LG left
LG right
z2
RVF
u2
state changes
LVF
u1
effective connectivity system state input external parameters inputs
a21 0
a12 0
2 b21 0
green: neuronal activity red: bold response
Example: modelled BOLD signal
Underlying model
(modulatory inputs not shown)
FG left FG right
( A u j B ) z Cu z
j j 1
m
Conceptual overview
Input u(t)
c1 b23
n z F ( z , u , ) Neuronal state equation The bilinear model ( A u j B j ) z Cu z
b 0
2 21
modulatory input u2 activity through the coupling a21
Neurodynamics: reciprocal connections
u1
a11
u2
a12
z1
a21
a22
z2
1 a11 a12 z1 z 0 0 z1 c u u1 2 2 z a 2 21 a22 z2 b21 0 z2 0
fMRI实验刺激系统解决方案
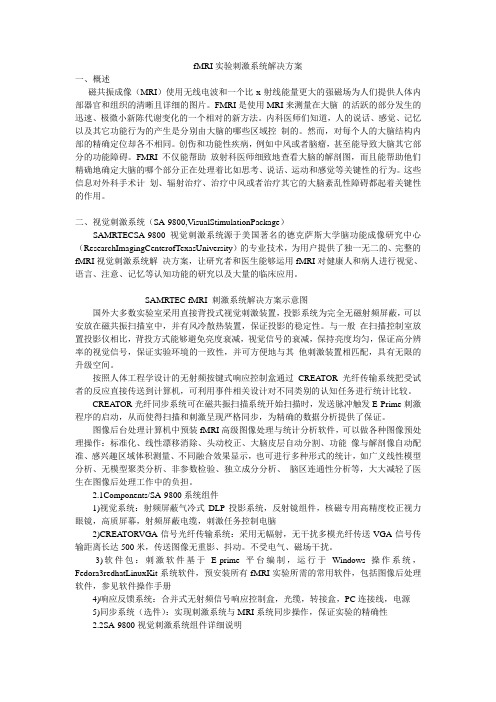
fMRI实验刺激系统解决方案一、概述磁共振成像(MRI)使用无线电波和一个比x-射线能量更大的强磁场为人们提供人体内部器官和组织的清晰且详细的图片。
FMRI是使用MRI来测量在大脑的活跃的部分发生的迅速、极微小新陈代谢变化的一个相对的新方法。
内科医师们知道,人的说话、感觉、记忆以及其它功能行为的产生是分别由大脑的哪些区域控制的。
然而,对每个人的大脑结构内部的精确定位却各不相同。
创伤和功能性疾病,例如中风或者脑瘤,甚至能导致大脑其它部分的功能障碍。
FMRI不仅能帮助放射科医师细致地查看大脑的解剖图,而且能帮助他们精确地确定大脑的哪个部分正在处理着比如思考、说话、运动和感觉等关键性的行为。
这些信息对外科手术计划、辐射治疗、治疗中风或者治疗其它的大脑紊乱性障碍都起着关键性的作用。
二、视觉刺激系统(SA-9800,VisualStimulationPackage)SAMRTECSA-9800视觉刺激系统源于美国著名的德克萨斯大学脑功能成像研究中心(ResearchImagingCenterofTexasUniversity)的专业技术,为用户提供了独一无二的、完整的fMRI视觉刺激系统解决方案,让研究者和医生能够运用fMRI对健康人和病人进行视觉、语言、注意、记忆等认知功能的研究以及大量的临床应用。
SAMRTEC fMRI 刺激系统解决方案示意图国外大多数实验室采用直接背投式视觉刺激装置,投影系统为完全无磁射频屏蔽,可以安放在磁共振扫描室中,并有风冷散热装置,保证投影的稳定性。
与一般在扫描控制室放置投影仪相比,背投方式能够避免亮度衰减,视觉信号的衰减,保持亮度均匀,保证高分辨率的视觉信号,保证实验环境的一致性,并可方便地与其他刺激装置相匹配,具有无限的升级空间。
按照人体工程学设计的无射频按键式响应控制盒通过CREATOR光纤传输系统把受试者的反应直接传送到计算机,可利用事件相关设计对不同类别的认知任务进行统计比较。
- 1、下载文档前请自行甄别文档内容的完整性,平台不提供额外的编辑、内容补充、找答案等附加服务。
- 2、"仅部分预览"的文档,不可在线预览部分如存在完整性等问题,可反馈申请退款(可完整预览的文档不适用该条件!)。
- 3、如文档侵犯您的权益,请联系客服反馈,我们会尽快为您处理(人工客服工作时间:9:00-18:30)。
z1 z2
a11 a21
0 a22
z1 z2
c 0u1
a21 0
activity in z2 is coupled to z1 via
coefficient a21
5
Neurodynamics: positive modulation
a11
u1
u2
a21
z1
a22
z2
z1 z2
observation model
BOLD response
19
Haemodynamics: 2 nodes with input
Dashed Line: Real BOLD response
a11
a22
a21
Activity in z1 is coupled to z2 via coefficient a21
z (A
u j B j )z Cu
neuronal state equation
• Specify model (neuronal and hemodynamic level)
• Make it an observation model by adding measurement error e and confounds X (e.g. drift).
a11 a21
0 a22
z1 z2
u2
0 b221
0 0
z1 z2
c 0u1
modulatory input u2 activity
a b221 0
through the coupling 621
Neurodynamics: reciprocal connections
u1
a11
0 0
a24 a34 a44
u3
0 0 0
b132 0 0 0
0 0 0 0
0
0
b334
0
z1
z2
z3 z4
0
c21
0
0
c12 0 0 0
0
0 0
u1 u2
0u3
13
Bilinear state equation in DCM/fMRI
state changes
• Bayesian parameter estimation using Bayesian version of an expectation-maximization algorithm.
• Result: (Normal) posterior parameter distributions, given by mean ηθ|y and Covariance Cθ|y.
Visual input in the - left (LVF) - right (RVF) visual field.
RVF
u2
state changes
LVF
u1
effective connectivity
system input external state parameters inputs
activity z(t)
vasodilatory signal
s z s γ( f 1)
f
s
flow induction
f s
f
changes in volume v
changes in dHb
τv f v1/α
τq f E( f,) q v1/α q/v
v
q
BOLD signal
y(t) v, q
• System parameters :
specify exact form of system
z (t) 1
overall
system state
z(t) represented
by state variables
zn (t)
z1 z1 f1(z1...zn ,u,1)
z3 left
dynamic
system
z1
LG left
FG
right z4
LG
right z2
RVF CONTEXT LVF
u2
u3
u1
m
z ( A u j B j )z Cu j 1
z1 z2 zz43
aaa0132111
a12 a22 0 a42
a13 0 a33 a43
z Az Cu
{A,C}
z1 a11 a12 a13 0 z1 0 c12
z2
a21
a22
0
a24
z2
c21
zz43
a031
0 a42
a33 a43
a34 a44
z3 z4
0
0
0 0 0
u1 u2
12
Extension:
FG
bilinear
A F z z z
Input u(t)
modulation of connectivity
direct inputs
c1
b23
B j 2F z zu j u j z
C F z u u
integration
activity z1(t)
y
a12 activity
z2(t)
y
activity z3(t)
h { ,g ,t ,a , } n {A, B1...Bm ,C} { h , n}
changes in volume v τv f v1/α
v
changes in dHb τq f E( f,) q v1/αq/v
q
ηθ|y
y (x)
modelled
y h(u, ) X e
a21 0
a12 0
b221 0
green: neuronal activity red: bold response
9
Example: modelled BOLD signal
Underlying model
(modulatory inputs not shown)
FG
FG
left
right
z
change of
state vector in time
zn zn fn (z1...zn ,u,n )
z F (z,u, )
11
Example: linear dynamic system
FG
z3 left
z1
LG left
FG
right z4
LG right
z2
LG = lingual gyrus FG = fusiform gyrus
a11
a12
a21
a22
Bold Response
Simulated response
Bold Response
z1
z2
a11 a21
a12 a22
z1 z2
u2
0 b221
0 0
z1 z2
c 0u1
a21 0
a12 0
b221 0
green: neuronal activity red: bold response
u2
a12
z1
a21
a22
z2
z1 z2
a11 a21
a12 a22
z1 z2
u2
0 b221
0 0
z1 z2
c 0u1
a21 0
a12 0
b221 0
reciprocal connection disclosed by7 u2
Haemodynamics: reciprocal connections
c1m u1 cnm um
m
z ( A u j B j )z Cu j 1
14
Conceptual overview
Neuronal state equation z F (z, u, n )
The bilinear model z (A ujB j )z Cu
effective connectivity
connectivity
modulation of system direct m external connectivity state inputs inputs
z1
a11
zn an1
a1n
m
u j b1j1
ann j1 bnj1
b1jn
z1
c11
bnjn znห้องสมุดไป่ตู้ cn1
Constraints on
•Connections •Hemodynamic parameters
p( )
prior
posterior
p( | y) p( y | ) p( )
Bayesian estimation
18
Overview:
stimulus function u
parameter estimation
neuronal states
y BOLD
z
λ
hemodynamic model
y
Friston e1t 5al. 2003,
NeuroImage
The hemodynamic “Balloon” model
• 5 hemodynamic parameters:
h { ,g ,t ,a, }
important for model fitting, but of no interest for statistical inference • Empirically determined a priori distributions. • Computed separately for each area