斯蒂芬D威廉森宏观经济学第三版第六章Stephen D. Williamson's Macroeconomics, Third Edition chapter6
当代西方经济学主要流派(第三版)课件-第6、7章

NK的货币政策主张
NK认为,货币政策能稳定总产出和就业,货 币变动会对真实的经济增长产生影响;经济当事 人对未来的货币政策的预期行为至关重要,因而 要重视货币政策的可靠性。
一些NK主张实行通货膨胀目标制的货币政策 (inflation-targeting policy),认为盯住通货膨胀 目标的货币政策是最优的货币政策。他们主张通 过调整名义短期利率进而改变实际利率以适应经 济的变化, 从而抵消通货膨胀预期的变化。
四、新凯恩斯主义的特色
曼昆(N. Gregory Mankiw)和罗默(David Romer)在他们编 选的两卷本《新凯恩斯主义经济学》(1991年)中回答了“什么 是新凯恩斯主义经济学”。他们认为,对以下两个有关经济波动 的理论问题的回答可以帮助我们界定“什么是新凯恩斯主义”:
1、这种理论违反古典二分法吗?它断定名义变量 (如货币供给)波动影响实际变量(如产量和就业) 波动吗?
当代西方经济学主要流派
第六章 新凯恩斯主义
第一节 新凯恩斯主义概览
一、新凯恩斯主义产生的背景 二、新凯恩斯主义代表人物 三.新凯恩斯主义发展的三阶段 四、新凯恩斯主义的特色 五、新凯恩斯主义的基本假设 六、NK & NCM争论的主要问题
一、新凯恩斯主义产生的背景
20世纪80年代,西方主流经济学中出 现了一个新的流派,这就是以美国哈佛 大学教授格雷高里·曼昆(N.Gregory Mankiw)和时任斯坦福大学教授约瑟 夫·斯蒂格利茨(Joseph Stiglitz)等人为 代表的新凯恩斯主义(New Keynesianism, NK),也叫新凯恩斯主义经济学(New Keynesian Economics,NKE)。
从NK这一方来看,它之所以要和RBC 融合,主要是因为,其一,NK在其发展过 程中遇到了和凯恩斯主义经济学一样的重 要问题,即除了动态的工资—价格设定模 型外,都与动态学不相容。以不完全竞争 为基础的NK一般均衡模型仍然是静态模型 ,像Blanchard-Kiyotaki模型(1987) 。
宏观经济学-课后思考题答案_史蒂芬威廉森016重点
Chapter 16Unemployment: Search and Efficiency WagesTeaching GoalsThus far in the text, the only formal explanation for the phenomenon of unemployment has been in the context of the Keynesian sticky price model. If there is nominal wage rigidity, the real wage may become stuck at a level that implies an excess supply of labor. This chapter supplies two models of unemployment that are more firmly grounded in microeconomic principles.The first model of unemployment is the search model. In this framework, unemployment is a socially useful phenomenon that may improve the quality of matches between workers and firms. When studying the model, it is important to remind students that factors that raise the equilibrium unemployment rate may not be bad, and factors that reduce the equilibrium unemployment may not be good. The focus of the search model is primarily microeconomic in nature. The search model explains what incentives work as households change their behavior in the face of new policies. The microfoundations are very powerful here, as they allow us to experiment at no cost with various policy schemes, yet they give us results of macroeconomic importance: how do taxes or unemployment insurance alter the unemployment rate?The second model of unemployment is the efficiency wage model. This model provides an explanation of unemployment that is hard to empirically distinguish from the Keynesian sticky wage model. In both models, unemployed workers stand willing to accept employment at the prevailing wage rate, and yet cannot find work. However, in the sticky wage model it is plausible to imagine a scenario in which an unemployed worker can successfully agree to work at a wage lower than the prevailing wage. In the efficiency wage model, it is never in the intere st of a firm to hire such a “bargain” worker, because the worker cannot commit to put in enough effort to make his employmentworthwhile to the firm. The main advantage of this model is that it reconciles such “involuntary” unemployment with optimizing beh avior. However, the model is less successful as a part of a consistent explanation of business cycles. The model cannot easily explain the fact that the real wage rate is procyclical.Classroom Discussion TopicsBy now, students should be comfortable with the idea that perfectly competitive markets generate efficient outcomes, as long as there are no externalities. In what sense does the structure of the job search model approximate perfect competition? Are there any possible sources of externalities? Is there some sense in which there may be elements of monopolistic competition? If the job search model is anything like a competitive market, do we have any reason to think that the unemployment rate might be too high or too low relative to a Pareto optimum? If an undistorted market provides the right amount of unemployment, then unemployment insurance leads to an inefficiently high rate of unemployment. Does this line of reasoning make a good case for eliminating unemployment insurance? Where does the desire to avoid risks come in? And moral hazard?152 Williamson • Macroeconomics, Third EditionIt is useful to point out that the fundamental theorems of welfare economics are worked out in a model in which there is complete information, and where no passage of time is needed to equilibrate the market. Job search is only necessary because workers do not possess complete information, and time is required to acquire additional information. Do these considerations have any relevance for the question of the socially optimum amount of unemployment?The efficiency wage model does not do a very good job of explaining business cycles because it cannot rationalize a procyclical real wage rate. Suppose instead that we had an economy with two sectors. In one sector, firms find it optimal to pay an efficiencywage and there is an excess supply of workers at the optimal efficiency wage. In the other sector, perhaps worker effort and ability are directly observable. Now suppose that there is an increase in total factor productivity. While the wage paid in the efficiency wage sector may be unchanged, what is the likely effect on wages in the rest of the economy? Does this consideration improve the ability of the efficiency wage model to explain business cycle models? Is there likely to be any unemployment in this kind of economy? Why or why not? If there is no unemployment, does the existence of an efficiency wage sector add anything to our understanding of business cycles over and above the explanation given by the real business cycle model?OutlineI. Behavior of Unemployment and Participation RatesA. Determinants of the Unemployment Rate1. Aggregate Economic Activity2. Demography3. Government-Provided Unemployment Insurance4. Sectoral ShiftsB. The Participation Rate1. L ong-Run Trendsa. Participation Rate of Menb. Participation Rate of Women2. Cyclical VariationsII. A Search Model of UnemploymentA. Welfare of Employed Workers1. Real Wage2. Separation Rate3. Wage Income TaxB. Welfare of Unemployed Workers1. Size of Unemployment Insurance Benefit2. Frequency of Job Offers3. Unemployment Insurance Benefit TaxC. Reservation Wage1. Welfare of Job Offer ≥ Welfare of Remaining Unemployed2. Increase in Unemployment Insurance Benefit *w ⇒↑3. Increase in Wage Tax *w ⇒↑Chapter 16 Unemployment: Search and Efficiency Wages 153D. Determinants of the Equilibrium Unemployment Rate1. Flows out of Employment2. Flows out of Unemployment3. The Wage Offer Distribution4. Effects of Disturbancesa. Increase in Unemployment Insurance Benefits U ⇒↑b. Increase in Job Offer Rate U ⇒↓c. Increase in Wage Tax U ⇒↑d. Increase in Benefit Tax U ⇒↓5. The Natural Rate of UnemploymentIII. The Efficiency Wage ModelA. Wages and Effort1. Adverse Selection: Unobserved Ability2. Moral Hazard: Unobserved ShirkingB. Optimization by the Firm 1. L abor Demand: ((e w N e w MP w =2. Efficiency Wage: Maximize(e w wC. Labor Market Equilibrium1. >* Market-Clearing Wage w a. (d s N N r <b Efficiency Wage Unemployment2. ≤* Market-Clearing Wage wD. Efficiency Wages and Business Cycles1. An Increase in Government Purchases: ,,,0r C I Y w U ↑↓↓Δ=Δ=Δ=2. An Increase in Total Factor Productivity: ,,,,0Y U C I w ↑↓↑↑Δ=3. An Improvement in Monitoring: w ↓Textbook Question SolutionsQuestions for Review1. The four key determinants of the unemployment rate are the level of aggregate economic activity,demographic factors, government intervention, and sectoral shifts.2. The unemployment rate is countercyclical.3. Different demographic groups often experience differing levels of unemployment. The unemploymentrate is higher when the composition of the work force includes a higher percentage of groups that typically experience more unemployment. As one example, younger workers who have recentlyentered the work force typically experience more unemployment. The aggregate unemployment rate is therefore higher when young workers represent a larger-than-normal proportion of the work force.154 Williamson • Macroeconomics, Third Edition4. The participation rate is procyclical.5. The welfare of the employed increases when the real wage increases, when the separation ratedecreases, and when taxes on wage income decrease.6. The welfare of the unemployed increases when the unemployment benefit increases, when thefrequency with which the unemployed receive job offers increases, and when the taxes onunemployment benefits decreases.7. The reservation wage is the wage offer that equates the welfare of accepting a job offer with thewelfare of remaining unemployed. The reservation wage increases when the welfare of beingemployed decreases and when the welfare of being unemployed increases.8. An increase in the unemployment benefit increases the welfare of being unemployed and thereforeincreases the reservation wage.9. An increase in the tax on wage income decreases the welfare of being employed and thereforeincreases the reservation wage.10. An increase in the unemployment insurance benefit raises the reservation rate. Therefore, theunemployed require more time to find an acceptable wage offer, and the equilibrium unemployment rate increases.11. An increase in the job offer rate, holding the reservation wage constant, reduces the amount of time ittakes to find an acceptable job offer. This effect tends to lower the equilibrium unemployment rate.An increase in the job offer rate also increases the reservation wage. This effect tends to increase the equilibrium unemployment rate. The net effect on the unemployment rate is therefore uncertain.An active government role in helping the unemployed to find job offers is likely to increase the job offer rate.12. What matters to the unemployed is the value of the unemployment insurance benefit, net of taxes. Anincrease in taxes on unemployment insurance benefits acts in the same way as a decrease in the gross benefits.13. A higher real wage rate increases the likelihood that more able workers will accept job offers. Ifemployers cannot precisely measure the level of ability, a higher real wage rate increases the average ability level of employees working for the firm. This effect is due to adverse selection.A higher real wage rate increases the potential costs of an employee losing his or her job.If it is costly for firms to monitor the level of effort expended by its workers, a higher real wage reduces the incentives for workers to shirk. This effect is due to moral hazard.14. When the efficiency wage exceeds the market-clearing wage, there will be involuntaryunemployment in the efficiency wage model.15. An increase in government spending increases the real interest rate, but has no effect on the levels ofoutput and employment.Chapter 16 Unemployment: Search and Efficiency Wages 155 16. An increase in total factor productivity decreases the real interest rate, and increases output andemployment. The increase in total factor productivity does not affect the real wage, unless the change in technology also affects the costs of monitoring workers’ performance.17. The efficiency wage model can account for procyclical employment, consumption, and investment.The efficiency wage model can account for countercyclical unemployment. The efficiency wage model cannot account for the procyclical behavior of the real wage rate.Problems1. An increase in the separation rate lowers the welfare from being employed, and therefore increasesthe efficiency wage. The higher reservation wage shifts the *UpH w curve to the right. The direct(effect of the increase in s shifts the (1− curve to the right. Unemployment therefore increases.s U2. An increase in the average wage paid, holding the reservation wage constant, increases the probabilityof finding an acceptable job offer. However, as long as job searchers are aware of the increase in wage rates, the reservation wage will also increase, because higher wages increase the welfare from being employed. On net, it is likely that at first approximation *H w will be unaffected, and so(there will be no change in the unemployment rate.3. The introduction of unemployment insurance benefits increases the welfare from being unemployedand increases the reservation wage. This effect increases the equilibrium rate of unemployment. If the insurance is paid for from a tax on wage income, then after-tax wages decrease. However, the reduction in the wage rate will likely result in an equal reduction in the reservation wage, so that *H w will be unaffected. Therefore, unemployment increases.(4. There are two channels through which more stringent qualification for unemployment insurancemay operate. For those currently employed, possible difficulties in qualifying would decrease the separation rate. Workers would be more reluctant to quit if they may not qualify for benefits and workers might perform better on the job reducing the incidenceof firing. The unemployed who are covered by insurance would be unaffected. However, the pool of the unemployed would now include more potential workers not receiving benefits and these individuals are likely to have lower reservation wages. The average reservation wage would decrease and the long-run unemployment rate would decrease.5. Increased difficulty in distinguishing ability levels is much like an increased difficulty in monitoringworker effort. The effort function therefore shifts down and to the right. The efficiency wagetherefore increases.However, a careful modeling of the adverse selection problem is more complicated than the modeling of the moral hazard problem. If a firm believes that it has some ability to distinguish between high- and low-ability workers, then it is likely to offer different wages to those believed to be of high rather than low ability. In a more complicated model of such a segmented market, it is likely that an increase in the difficulty of distinguishing between workers will lead to an increase in the wages of low-ability workers and a decrease in wages of high-ability workers.156 Williamson • Macroeconomics, Third Edition 6. The destruction of capital is much like a decrease in total factor productivity. The labor demand curve shifts to the left. As long as there is no change in the ability to monitor, there will be no change in the efficiency wage. Output and employment decrease, unemployment increases, and the real interest rate increases. The efficiency wage model is a model that predicts real wage rigidity, not nominal wage rigidity. An increase in the money supply leads to an equiproportional increase in nominal wages and prices. Money is therefore neutral. According to the permanent income hypothesis, a permanent increase in government spending is likely to lead to an equal-sized decrease in consumption spending. The output demand curve therefore does not shift. The wealth effect of the increase in governmentspending increases labor supply. However, in the efficiency wage model output and employment are determined by labor demand. Therefore, the output supply curve also does not shift. Output, employment, the real wage, investment, and the real interest rate are all unchanged. The only effects of the permanent increase in government spending are a decrease in consumption and an increase in unemployment. There is no crowding out of investment spending. Instead, there is a one-for-one crowding out of consumption spending. 7. 8.。
威廉森《宏观经济学》(第3版)配套题库【模拟试题】威廉森《宏观经济学》(第3版)模拟试题及详解(一)
威廉森《宏观经济学》(第3版)模拟试题及详解(一)一、名词解释(每小题5分,共计20分)1.IS LM-模型答:IS LM-模型是由英国经济学家希克斯和美国经济学家汉森在凯恩斯宏观经济理论基础上概括出的一个经济分析模式,即“希克斯—汉森模型”,也称“希克斯—汉森综合”或“希克斯—汉森图形”。
IS LM-模型是宏观经济分析的一个重要工具,是描述产品市场和货币市场之间相互联系的理论结构。
在产品市场上,国民收入取决于消费、投资、政府支出和净出口加起来的总支出或者说总需求水平,而总需求尤其是投资需求要受到利率影响,利率则由货币市场供求情况决定,就是说,货币市场要影响产品市场;另一方面,产品市场上所决定的国民收入又会影响货币需求,从而影响利率,这又是产品市场对货币市场的影响。
可见,产品市场和货币市场是相互联系、相互作用的,而收入和利率也只有在这种相互联系、相互作用中才能决定。
IS曲线是描述产品市场达到均衡,即I S=时,国民收入与利率之间存在着反向变动关=时,国民收入和利率之间存在着同系的曲线。
LM曲线是描述货币市场达到均衡,即L M向变动关系的曲线。
把IS曲线和LM曲线放在同一个图上,就可以得出说明两个市场同时均衡时,国民收入与利率决定的IS LM-模型。
2.国内生产总值(gross domestic product,GDP)答:国内生产总值指一个国家(地区)领土范围内,本国(地区)居民和外国居民在一定时期内所生产和提供的最终物品和劳务的市场价值。
GDP一般通过支出法和收入法两种方法进行核算。
用支出法计算的国内生产总值等于消费、投资、政府支出和净出口之和;用收入法计算的国内生产总值等于工资、利息、租金、利润、间接税和企业转移支付和折旧之和。
GDP是一国范围内生产的最终产品的市场价值,因此是一个地域概念,而与此相联系的国民生产总值(GNP)则是一个国民概念,乃指某国国民所拥有的全部生产要素所生产的最终产品的市场价值。
斯蒂芬D威廉森宏观经济学第三版第十一章Stephen D. Williamson's Macroeconomics, Third Edition chapter11

11-4
Figure 11.2 Effects of a Persistent Increase in Total Factor Productivity in the Real Business Cycle Model
Copyright © 2008 Pearson Addison-Wesley. All rights reserved.
11-9
Segmented Markets Model
• Business cycles can be caused in this model by unanticipated shocks to the money supply. • Model exhibits a liquidity effect – the interest rate falls in the short run when the money supply increases. • Monetary policy can only improve the functioning of the economy if the central bank has an informational advantage over the private sector. • Fit to the data is not as good as with the real business cycle model.
Copyright © 2008 Pearson Addison-Wesley. All rights reserved.
11-10
Figure 11.5 Effects of an Unanticipated Increase in the Money Supply in the Segmented Markets Model
宏观经济学-课后思考题答案_史蒂芬威廉森006

Chapter 6Economic Growth: Malthus and SolowTeaching GoalsStudents easily take for granted the much more abundant standard of living of today as opposed to 20, 50, or 100 years ago. Sometimes it is easier to remind students of what their ancestors had to do without, rather than simply referring to per capita income levels over time. Recessions come and go, and yet economic growth swamps the lost output we endure during hard times.The typical student begins study of economic growth against the backdrop of the recent growth experience of the United States. The current standard of living in the United States vastly surpasses the current standard of living in most countries and would have been unimaginable anywhere in the world before the advent of the industrial revolution. Until about 1800, the world economy produced little more than a subsistence level of income for any but the richest individuals. Growth in per capita income was nonexistent. The Malthusian model of growth explains the tendency of increases in population to dilute any gains in productivity.The industrial revolution introduced the possibility of sustained growth in per capita income through the accumulation of physical capital. However, growth experience has varied widely around the world. The richer countries have a sustained record of growth. Per capita income in the United States has proceeded at an average rate of about 2% per year. While 2% growth may seem small, it is important for students to realize that such growth transforms into a more than doubling of per capita GDP per generation. Unfortunately, the poorer countries have remained poor. Furthermore, their growth rates have not generally matched growth rates in the richer countries, so that the poor countries fall farther and farther behind. Such differences in standards of living and growth prospects present puzzles that the study of economic growth hopes to solve.Classroom Discussion TopicsGetting students to relate to differences in standards of living can sometimes be difficult. It is easy to take one’s own standard of living for granted. An interesting discussion topic is whether students would be willing to travel back in time to 100 or 200 years ago, if they could be one of the richest people of those earlier times. Would the tradeoff be worthwhile? While students typically stress factors like antiquated view about freedom of choice, and racial and gender issues, try to encourage students to divide their concerns into those that are more economic as opposed to social. Also point out that higher standards of living allow societies to be more concerned about issues of equality when mere survival is no longer precarious.Chapter 6 Economic Growth: Malthus and Solow 53Students often view population growth as the result of cultural factors and personal preferences. Against the abundance of daily living, it is easy to forget economic factors. Ask the students for examples ofeconomic factors that might impact on fertility decisions. The Malthusian model suggests that growth may only be achieved through population control. In the modern economy, the costs of raising children can be formidable, and so there is tendency for such costs to be a disincentive to fertility. Such costs may attribute to the tendency for low fertility rates in advanced economies. In more primitive societies, having a large family can be a private form of Social Security. The more children a family has, the more family members there will be to provide for the parents in old age. Poor public health conditions may actually enhance fertility. If each child has a small chance for survival to adulthood, more births are required to produce a given-sized family.OutlineI. Economic Growth FactsA. Pre-1800: Constant Per Capita Income across Time and SpaceB. Post-1800: Sustained Growth in the Rich CountriesC. High I nvestment ↔ High Standard of LivingD. High Population Growth ↔ Low Standard of LivingE. Divergence of Per Capita Incomes: 1800–1950F. No Conditional Convergence amongst All CountriesG. Conditional Convergence amongst the Rich CountriesII. The Malthusian ModelA. Production Determined by Labor and Fixed Land SupplyB. Population Growth and Per Capita ConsumptionC. Steady-state Consumption and Population1. Effects of Technological Change2. Effects of Population ControlD. Malthus: Theory and EvidenceIII. Solow’s Model of Exogenous GrowthA. The Representative ConsumerB. The Representative FirmC. Competitive EquilibriumD. Steady-State Growth1. The Steady-State Path2. Adjustment toward EquilibriumE. Savings and Growth1. Equilibrium Effects2. The Golden Rule: K MP n d =+F. Labor Force Growth and Output Per CapitaG. Total Factor Productivity and Output Per CapitaH. Solow: Theory and Evidence54 Williamson • Macroeconomics, Third EditionIV. Growth AccountingA. Solow ResidualsB. The Productivity Slowdown1. Measurement of Services2. The Relative Price of Energy3. Costs of Adopting New TechnologyC. Cyclical Properties of Solow ResidualsTextbook Question SolutionsQuestions for Review1. In exogenous growth models, growth is caused in the model by forces not explained by the modelitself. Endogenous growth models examine the economic factors that cause growth.2. Pre-1800: Constant Per Capita Income across Time and SpacePost-1800: Sustained Growth in the Rich CountriesHigh Investment ↔ High Standard of LivingHigh Population Growth ↔ Low Standard of LivingDivergence of Per Capita Incomes: 1800–1950No Conditional Convergence amongst All CountriesConditional Convergence amongst the Rich Countries3. An increase in total factor productivity increases the size of the population, but has no effect on theequilibrium level of consumption per capita.4. Only a downward shift in the population growth function can increase the standard of living.5. Malthu’s model is quite successful in explaining economic growth prior to the industrial revolution.Malthu’s model has little relevance for more recent growth experience.6. In the steady state, all variables stay constant: per capita capital, output, consumption, savings. Also,this steady state is stable: whatever the initial capital (except zero), the economy will converge to this steady state.7. With an increase in the saving rate, it becomes possible to sustain a higher level of per capita capital,and thus higher output and consumption. With an increase in the population rate, the contraryhappens, as one needs to provide more newborns with the going per capita capital. A higher total factor productivity improves all per capita variables in the steady state.8. To maximize steady-state per capita consumption, the saving rate must be such that the marginalproduct of capital (the slope of the per capita production function) equals the population growth rate plus the depreciation rate.9. The Malthusian model gave no way out of misery, except for measures that reduce the population.Even technological advances would not raise the standard of living. The Solow model shows that it is possible to obtain a stable standard of living with growing population. And if total factor productivity increases, one can even obtain improvements in the standard of living despite population growth.Chapter 6 Economic Growth: Malthus and Solow 55 10. The Cobb-Douglas production function permits a simple decomposition of economic growth into itscomponent sources.11. In a competitive equilibrium, the parameter a is equal to the share of capital income in total income.12. The Solow residual measures increases in real GDP that are not accounted for by increases in capitaland labor. The Solow residual is highly procyclical as it explains the great majority of the cyclical component in GDP.13. The productivity slowdown could be explained by underestimates of output in the growing servicessector, increases in the relative price of energy, and the costs of adopting new technologies.14. American workers then knew how to incorporate the new technologies, in particular informationtechnology. These efficiency gains may have been realized by 2000, which explains the newslowdown, along with higher energy prices.15. Growth in capital, employment, and total factor productivity account for growth in GDP.16. During this period, growth in these countries was much larger than average. Growth rates for thesecountries were about three times as fast as growth in the United States. However, most of this growth can be attributed to increases in the capital stocks in these countries, and such rapid rates of growth of capital cannot be sustained for long periods of time.Problems1. The amount of land increases, and, at first, the size of the population is unchanged. Therefore,consumption per capita increases. However, the increase in consumption per capita increases the population growth rate, see the figure below. In the steady state, neither *c nor *l are affected by the initial increase in land. This fact can be discerned by noting that there will be no changes in either of the panels of Figure 6.8 in the textbook.56 Williamson • Macroeconomics, Third Edition2. A reduction in the death rate increases the number of survivors from the current period who will stillbe living in the future. Therefore, such a technological change in public health shifts the function ()g cupward. In problem #1 there were no effects on the levels of land per capita and consumption per capita. In this case, the ()g c function in the bottom figure below shifts upward. Equilibriumconsumption per capita decreases. From the top figure below, we also see that the decrease inconsumption per capita requires a reduction in the equilibrium level of land per capita. The size of the population has increased, but the amount of available land is unchanged.Chapter 6 Economic Growth: Malthus and Solow 57 3. For the marginal product of capital to increase at every level of capital, the shift in the productionfunction is equivalent to an increase in total factor productivity.(a) The original and new production functions are depicted in the figures below.(b) Equilibrium in the Solow model is at the intersection of ()n d k+szf k with the line segment ().The old and new equilibria are depicted in the bottom panel of the figure above. The newequilibrium is at a higher level of capital per capita and a higher level of output per capita.(c) For a given savings rate, more effective capital implies more savings, and in the steady state thereis more capital and more output. However, if the increase in the marginal product of capital were local, in the neighborhood of the original equilibrium, there would be no equilibrium effects. A twisting of the production function around its initial point does not alter the intersection point.4. An increase in the depreciation rate acts in much the same way as an increase in the populationgrowth rate. More of current savings is required just to keep the amount of capital per capita constant.In equilibrium output per capita and capital per capita decrease.58 Williamson • Macroeconomics, Third Edition5. A destruction of capital.(a) The long-run equilibrium is not changed by an alteration of the initial conditions. If the economystarted in a steady state, the economy will return to the same steady state. If the economy wereinitially below the steady state, the approach to the steady state will be delayed by the loss ofcapital.(b) Initially, the growth rate of the capital stock will exceed the growth rate of the labor force. Thefaster growth rate in capital continues until the steady state is reached.(c) The rapid growth rates are consistent with the Solow model’s predictions about the likelyadjustment to a loss of capital.6. A reduction in total factor productivity reduces the marginal product of capital. The golden rule levelof capital per capita equates the marginal product of capital with .n d + Therefore, for given ,n d + the golden rule amount of capital per capita must decrease as in the figure below. Therefore the golden rule savings rate must decrease.7. Government spending in the Solow model.(a) By assumption, we know that T = G, and so we may write:()(1)(1)K's Y G d K sY gN d K =−+−=−+−Now divide by N and rearrange as:(1)()(1)k'n szf k sg d k +=−+−Divide by (1 + n ) to obtain:()(1)(1)(1)(1)szf k sg d k k'n n n −=−++++Chapter 6 Economic Growth: Malthus and Solow 59Setting k = k ′, we find that:**()().szf k sg n d k =++This equilibrium condition is depicted in the figure below.(b) The two steady states are also depicted in the figure above.(c) The effects of an increase in g are depicted in the bottom panel of the figure above. Capital percapita declines in the steady state. Steady-state growth rates of aggregate output, aggregate consumption, and investment are all unchanged. The reduction in capital per capita isaccomplished through a temporary reduction in the growth rate of capital.8. The golden rule quantity of capital per capita, *,k is such that *().K MP zf k n d ′==+ A decrease in the population growth rate, n , requires a decrease in the marginal product of capital. Therefore, thegolden rule quantity of capital per capita must increase. The golden rule savings rate may either increase or decrease.60 Williamson • Macroeconomics, Third Edition9. (a) First, we need to determine how bN evolves over time:(bN )′ = (1 + f )(1 + n ) bNThen we just need to redo the analysis of the competitive equilibrium and the steady state as inthe book, replacing every N by bN , every (1 + n ) by (1 + f )(1 + n ), and every n by f + n . The new steady-state per efficiency unit capital is then******()(1)(1)(1)(1)(1)szf k d k k f n f n −=+++++ All aggregate variables then grow at the rate of f + n , while per capita aggregates grow at therate f .(b) An increase in f increases the growth rate of per capita income by the same amount, as f is itsgrowth rate. This happens because the exogenous growth in b raises instant capital and income for everyone without a need to invest in capital.10. Production linear in capital:()()Y K z zf k f k k N N==⇒= (a) Recall Equation (20) from the text, and replace ()f k with k to obtain:+−=+((1))(1)sz d k'k n Also recall that 11 and .Y Y Y'zk k k'N z N z N'=⇒== Therefore: ((1))(1)Y'sz d Y N'n N+−=+ As long as((1))1,(1)sz d n +−>+ per capita income grows indefinitely. (b) The growth rate of income per capita is therefore: ((1))1(1)()(1)Y'Y sz d N'N g Y n Nsz n d n −+−==−+−+=+ Obviously, g is increasing in s .(c) This model allows for the possibility of an ever-increasing amount of capital per capita. In theSolow model, the fact that the marginal product of capital is declining in capital is the key impediment to continual increases in the amount of capital per capita.Chapter 6 Economic Growth: Malthus and Solow 6111. Solow residual calculations.(a) To calculate the Solow residuals, we apply the formula, 0.360.64ˆˆˆˆ/,zY K N = to the values in the provided table. Adding a new column for these values, we obtain:Year ˆY ˆK ˆN ˆz 1995 8031.7 25487.3 124.9 9.4781996 8328.9 26222.3 126.7 9.6401997 8703.5 27018.1 129.6 9.8231998 9066.9 27915.9 131.5 10.0191999 9470.3 28899.9 133.5 10.2362000 9817.0 29917.1 136.9 10.3122001 9890.7 30793.4 136.9 10.2822002 10048.8 31599.6 136.5 10.3692003 10301.0 32426.2 137.7 10.4722004 10703.5 33304.9 139.2 10.7032005 11048.6 34191.7 141.7 10.820(b) Next, we compute the percentage changes in each of the table entries. These values arepresented in the table below.Year ˆˆY Y Δ/ (%) ˆˆK K Δ/ (%) ˆˆN N Δ/ (%) ˆˆzz Δ/ (%) 1996 3.70 2.88 1.44 1.71 1997 4.50 3.03 2.29 1.901998 4.18 3.32 1.47 2.001999 4.45 3.52 1.52 2.172000 3.66 3.52 2.55 0.742001 0.75 2.93 0.00 −0.292002 1.60 2.62 −0.29 0.852003 2.51 2.62 0.88 0.992004 3.91 2.71 1.09 2.212005 3.22 2.66 1.80 1.0962 Williamson • Macroeconomics, Third EditionTo compare the contributions to growth, we need to compare the magnitudes,ˆˆˆˆ0.36(/),0.64(/),KKNN ΔΔ and ˆˆ/.z z Δ These values are presented in the table below.Year ˆˆ0.36(Δ/K K) (%) ˆˆ0.64(Δ/N N)(%) ˆˆz z Δ/ (%)1996 1.04 0.92 1.711997 1.09 1.46 1.901998 1.20 0.94 2.001999 1.27 0.97 2.172000 1.27 1.63 0.742001 1.05 0.00 −0.292002 0.94 −0.19 0.852003 0.94 0.56 0.992004 0.98 0.70 2.212005 0.96 1.15 1.09Most often, when output is growing, the biggest contribution to growth comes from increases intotal factor productivity. In 1991 and in 2001, both bad years for growth, total factor productivity decreased. In the other years, growth in total factor productivity is usually the largest contributor to growth, while increases in capital and labor equally share the role of the leading cause of growth in the other years. In the later years, capital growth has come to be relatively more important than in the early years.。
宏观经济学 斯蒂芬威廉森chap06

Macroeconomics, 3e (Williamson)Chapter 6 E conomic Growth: Malthus and Solow1) I f changes in economic policy could cause the growth rate of real GDP to increase by 1% peryear for 100 years, then GDP would be ________ % higher after 100 years than it would havebeen otherwise.A) 1.3B) 2.0C) 2.7D) 3.8Answer: CQuestion Status: P revious Edition2) I n an exogenous growth model, growth is caused byA) c apital accumulation.B) g overnment policies.C) h uman capital accumulation.D) f orces that are not explained by the model itself.Answer: DQuestion Status: P revious Edition3) T he idea that an improvement in technology causes an increase in population but causes noincrease in the average standard of living is attributed toA) A dam Smith.B) T homas Malthus.C) R obert Solow.D) M ilton Friedman.Answer: BQuestion Status: P revious Edition4) T he Malthusian model performs poorly in explaining economic growth after theA) F rench Revolution.B) A merican Revolution.C) I ndustrial Revolution.D) B io-technology Revolution.Answer: CQuestion Status: P revious Edition5) T he Solow model emphasizes the role of which of the following factors of production?A) l andB) l aborC) c apitalD) n atural resourcesAnswer: CQuestion Status: P revious Edition6) B efore the Industrial Revolution, standards of living differedA) g reatly over time and across countries.B) l ittle over time, but differed greatly across countries.C) g reatly over time, but differed little across countries.D) l ittle over time and across countries.Answer: DQuestion Status: P revious Edition7) R ecent evidence suggests that output per worker isA) p ositively related to both the rate of investment and to the rate of population growth.B) p ositively related to the rate of investment and negatively related to the rate ofpopulation growth.C) n egatively related to the rate of investment and positively related to the rate ofpopulation growth.D) n egatively related to both the rate of investment and to the rate of population growth.Answer: BQuestion Status: P revious Edition8) T here is evidence that income per worker is converging inA) t he richest countries and the poorest countries.B) t he richest countries, but not the poorest countries.C) t he poorest countries, but not the richest countries.D) n either the richest nor the poorest countries.Answer: BQuestion Status: P revious Edition9) C onditional convergence means thatA) t he distance between poor and rich countries increases.B) t he distance between poor and rich countries stays the same.C) t he distance between poor and rich countries decreases.D) t here is no systematic pattern in how poor and rich countries grow.Answer: CQuestion Status: N ew10) F or conditional convergence to hold, it is required thatA) p oor countries grow.B) p oor countries grow faster and faster.C) p oor countries grow faster than rich countries.D) p oor countries become richer than currently rich countries.Answer: CQuestion Status: N ew11) C onditional convergence means thatA) p oorer countries have higher growth rates.B) p oorer countries have lower growth rates.C) p oorer countries have very diverse growth rates.D) p oorer countries have uniform growth rates.Answer: AQuestion Status: N ew12) I n the Malthusian model, the population growth rate isA) e xogenous.B) p ositively related to consumption per worker.C) n egatively related to consumption per worker.D) a ssumed to be constant.Answer: BQuestion Status: P revious Edition13) T he Malthusian model emphasizes fixity in which of the following factors of production?A) l aborB) l andC) e nergyD) n one of the aboveAnswer: BQuestion Status: P revious Edition14) I n the Malthusian model, an improvement in the technology of growing food is likely toA) i ncrease the equilibrium size of the population and increase the equilibrium level ofconsumption per worker.B) i ncrease the equilibrium size of the population and decrease the equilibrium level ofconsumption per worker.C) i ncrease the equilibrium size of the population and have no effect on the equilibriumlevel of consumption per worker.D) h ave no effect on the equilibrium size of the population and increase the equilibriumlevel of consumption per worker.Answer: CQuestion Status: P revious Edition15) T he Malthusian model predicts thatA) p opulation will keep increasing.B) t he standard of living will keep increasing.C) h ealth improvements increase the standard of living.D) p opulation control improves the standard of living.Answer: DQuestion Status: N ew16) I n a Malthusian world, why is misery recurrent?A) T he marginal returns of capital are decreasing.B) F ertility is endogenous.C) O utput is increasing in labor.D) M ortality depends on the standard of living.Answer: DQuestion Status: N ew17) I n a Malthusian world, what would improve the standard of living permanently?A) a warB) a new medical drugC) b irth controlD) d emocracyAnswer: CQuestion Status: N ew18) I n a Malthusian world, what would improve the standard of living temporarily?A) a warB) a new virusC) b irth controlD) d emocracyAnswer: AQuestion Status: N ew19) I n the Malthusian model, state-mandated population control policies are likely toA) d ecrease the equilibrium size of the population and increase the equilibrium level ofconsumption per worker.B) d ecrease the equilibrium size of the population and have no effect on the equilibriumlevel of consumption per worker.C) h ave no effect on the equilibrium size of the population and increase the equilibriumlevel of consumption per worker.D) h ave no effect on either the equilibrium size of the population or the equilibrium levelof consumption per worker.Answer: AQuestion Status: P revious Edition20) I n the Malthusian model, improvements in health care lead toA) h igher population and higher per-capita production.B) h igher population and lower per-capita production.C) l ower population and higher per-capita production.D) l ower population and lower per-capita production.Answer: BQuestion Status: N ew21) I f an epidemic hits a Malthusian economy, the immediate consequence isA) a n increase in the standard of living.B) a reduction in the standard of living.C) n o change in the standard of living.D) d ependent on the population growth rate.Answer: AQuestion Status: N ew22) I f an epidemic hits a Malthusian economy, the long-term consequence isA) a n increase in the standard of living.B) a reduction in the standard of living.C) n o change in the standard of living.D) d ependent on the population growth rate.Answer: CQuestion Status: N ew23) I n a Malthusian world, what events would improve temporarily the standard of living, asmeasured by output per capita?A) a peace keeping missionB) a n increase in violent crimeC) a new mutation of germsD) a new sewer systemAnswer: BQuestion Status: N ew24) I n a Malthusian world, what events would improve permanently the standard of living, asmeasured by output per capita?A) a peace keeping missionB) a n increase in violent crimeC) a new mutation of germsD) a new sewer systemAnswer: CQuestion Status: N ew25) I n more modern times as opposed to the times of Malthus, higher standards of living appeartoA) d ecrease death rates and increase birth rates.B) d ecrease death rates and also decrease birth rates.C) d ecrease death rates and have no effect on birth rates.D) h ave had effects on neither death rates nor birth rates.Answer: BQuestion Status: P revious Edition26) M althus was too pessimistic because he did not foresee the effects ofA) e ver increasing amounts of land for cultivation.B) i ncreases in the capital stock and the effects of such increases on production.C) i mproved nutrition and health care.D) i mproved family planning practices.Answer: BQuestion Status: P revious Edition27) T he Solow residual attempts to measure the amount of output not explained byA) t echnological progress.B) t he direct contribution of labor and capital.C) e conomic projections.D) t he amount of a nation's human capital.Answer: BQuestion Status: P revious Edition28) G rowth accounting, popularized by Robert Solow, attempts to attribute a change inaggregate outputA) t o its most important single cause.B) s eparately between changes in government policy and changes in total factorproductivity.C) s eparately between changes in total factor productivity and changes in the supplies offactors of production.D) s eparately between changes in the supplies of factors of production and changes ingovernment policy.Answer: CQuestion Status: P revious Edition29) For the production function, Y = zK 0.36N 0.64, if measured output is, ˆYmeasured capital input is ˆK, and measured labor input is ˆN , then the Solow residual would be equal to A) 0.360.64ˆˆˆK N Y. B) 0.360.64ˆˆK N× ˆY . C) 0.640.36ˆˆN K× ˆY . D) 0.360.64ˆˆˆY K N. Answer: DQuestion Status: P revious Edition30) A ll of the following increase total factor productivity exceptA) n ew inventions.B) m ore capital.C) n ew management techniques.D) f avorable changes in government regulations.Answer: BQuestion Status: P revious Edition31) W hich of the following increases total factor productivity?A) i nvestment in machineryB) a harsh winterC) b etter access to creditD) n ew production proceduresAnswer: DQuestion Status: N ew32) G rowth in the Solow residual was slowest in theA) 1950s.B) 1960s.C) 1970s.D) 1980s.Answer: CQuestion Status: P revious Edition33) G rowth in the Solow residual was fastest in theA) 1950s.B) 1960s.C) 1970s.D) 1980s.Answer: BQuestion Status: P revious Edition34) O ne plausible explanation of the U.S. productivity slowdown starting in 1973 is that it is anartifact of mismeasurement. This explanation would require that production ofA) g oods is underestimated.B) g oods is overestimated.C) s ervices is underestimated.D) s ervices is overestimated.Answer: CQuestion Status: P revious Edition35) O ne plausible explanation of the U.S. productivity slowdown starting in 1973 is that it was aresult of the increase in the relative price of energy. This explanation would require that, in light of higher energy costs, theA) c apital stock is overestimated.B) c apital stock is underestimated.C) l abor force is overestimated.D) l abor force is underestimated.Answer: AQuestion Status: P revious Edition36) O ne plausible explanation of the U.S. productivity slowdown starting in 1973 is that it wasthe result of the time needed to adapt to new technology. This explanation would require thatA) w orkers withdraw from the labor force to learn about the new technology.B) a large number of new entrants be attracted to the labor force.C) m anagers be reluctant to adopt changes.D) w orkers time at their jobs be diverted from production to learning the technology.Answer: DQuestion Status: P revious Edition37) P ercentage deviations from trend in the Solow residual areA) u nrelated to the business cycle.B) p rocyclical and smaller than percentage deviations from trend in GDP.C) p rocyclical and have about equal magnitude as percentage deviations from trend inGDP.D) p rocyclical and larger than percentage deviations from trend in GDP.Answer: CQuestion Status: P revious Edition38) T he biggest contribution to real U.S. GDP growth in the 1970s was due to growth inA) t otal factor productivity.B) t he capital stock.C) t he labor force.D) b oth the capital stock and the labor force.Answer: DQuestion Status: P revious Edition39) T he biggest contribution to real GDP growth in the "East Asian Tigers" during the period1966-1991 was due to growth inA) t otal factor productivity.B) t he capital stock.C) t he labor force.D) i nternational trade.Answer: BQuestion Status: P revious Edition40) T he per -worker production function relates output per workerA) t o capital per worker.B) t o the participation rate.C) t o production per worker.D) i n different countries.Answer: AQuestion Status: P revious Edition41) W e can express the per-worker production function as a function of only per-worker capitalthanks toA) t he decreasing marginal return of capital.B) t he decreasing marginal return of labor.C) t he constant returns to scale.D) t he impatience of households.Answer: CQuestion Status: N ew42) T he slope of the output per worker function is equal to theA) m arginal product of capital.B) m arginal product of labor.C) s avings rate.D) g rowth rate of the population.Answer: AQuestion Status: P revious Edition43) I n Solow's model of economic growth, suppose that s represents the savings rate, zrepresents total factor productivity, k represents the level of capital per worker, and f(k) represents the per-worker production function. Also suppose that n represents thepopulation growth rate and d represents the depreciation rate of capital. The equilibrium level of capital per worker, k *, will satisfy the equationA) s zf(k*) = (n + d)k*. B) = (n + d )f (k*).C) nf(k *) = *()sk s d +. D) f (k*) =()s n d +k *. Answer: AQuestion Status: P revious Edition44) T he saving rate has the following characteristic in Solow's exogenous growth modelA) i t increases with output.B) i t first decreases, then increases with output.C) i t first increases, then decreases with output.D) i t is constant.Answer: DQuestion Status: N ew45) I n Solow's exogenous growth model, the principal obstacle to continuous growth in outputper capita is due toA) t he declining marginal product of labor.B) t he declining marginal product of capital.C) l imits in the ability of government policymakers.D) t oo little savings.Answer: BQuestion Status: P revious Edition46) I n Solow's exogenous growth model, the economy reaches a stable steady state becauseA) t he marginal return of capital is decreasing.B) c apital is growing at a constant rate.C) t he substitution effect is stronger than the income effect.D) c onditional convergence holds.Answer: AQuestion Status: N ew47) I n the steady state of Solow's exogenous growth model, an increase in the savings rateA) i ncreases output per worker and increases capital per worker.B) i ncreases output per worker and decreases capital per worker.C) d ecreases output per worker and increases capital per worker.D) d ecreases output per worker and decreases capital per worker.Answer: AQuestion Status: P revious Edition48) W hich of the following is not a feature of the steady state in Solow's exogenous growthmodel?A) T he capital/output ratio is steady.B) C apital grows continuously.C) C onsumption per worker is steady.D) T otal saving is steady.Answer: DQuestion Status: N ew49) I f the population growth rate increases by the same percentage points as the depreciationrate, what happens to the steady-state, per-worker output in Solow's exogenous growth model?A) I t increases.B) I t decreases.C) I t does not change.D) I t cannot exist anymore.Answer: BQuestion Status: N ew50) I f the population growth rate increases by the same percentage points as the depreciationrate decreases, what happens to the steady-state, per-worker consumption in Solow'sexogenous growth model?A) I t increases.B) I t decreases.C) I t does not change.D) I t cannot exist anymore.Answer: CQuestion Status: N ew51) I n Solow's exogenous growth model, the steady-state growth rate of capital can be increasedbyA) h igher population growth.B) h igher depreciation rate.C) h igher saving rate.D) h igher interest rate.Answer: AQuestion Status: N ew52) T he Golden Rule of capital accumulation maximizes the steady-state level ofA) o utput per worker.B) c apital per worker.C) c onsumption per worker.D) i nvestment per worker.Answer: CQuestion Status: P revious Edition53) I n the Golden Rule steady state, the marginal product of capital is equal to theA) s avings rate plus the population growth rate.B) p opulation growth rate plus the depreciation rate.C) d epreciation rate plus the savings rate.D) s avings rate divided by the marginal product of labor.Answer: BQuestion Status: P revious Edition54) W ith the Golden Rule,A) s avings maximize output.B) s avings maximize consumption.C) s avings minimize costs.D) s avings optimize the population level.Answer: BQuestion Status: N ew55) T he Golden Rule says thatA) o ne should save as much as possible.B) o ne should save as little as possible.C) o ne should save something between A and B.D) s avings are irrelevant.Answer: CQuestion Status: N ew56) I n the steady state of Solow's exogenous growth model, an increase in the growth rate oflabor forceA) i ncreases output per worker and increases capital per worker.B) i ncreases output per worker and decreases capital per worker.C) d ecreases output per worker and increases capital per worker.D) d ecreases output per worker and decreases capital per worker.Answer: DQuestion Status: P revious Edition57) I n the steady state of Solow's exogenous growth model, an increase in total factorproductivityA) i ncreases output per worker and increases capital per worker.B) i ncreases output per worker and decreases capital per worker.C) d ecreases output per worker and increases capital per worker.D) d ecreases output per worker and decreases capital per worker.Answer: AQuestion Status: P revious Edition。
黎诣远《宏观经济学》(第3版)笔记(2.3第6章 劳动就业)

黎诣远《宏观经济学》(第3版)第6章 劳动就业跨考网独家整理最全经济学考研真题,经济学考研课后习题解析资料库,您可以在这里查阅历年经济学考研真题,经济学考研课后习题,经济学考研参考书等内容,更有跨考考研历年辅导的经济学学哥学姐的经济学考研经验,从前辈中获得的经验对初学者来说是宝贵的财富,这或许能帮你少走弯路,躲开一些陷阱。
以下内容为跨考网独家整理,如您还需更多考研资料,可选择经济学一对一在线咨询进行咨询。
一、就业与失业1.失业的测定(1)失业人口根据国际劳工组织的定义,失业人口是指一定劳动年龄以上,有劳动能力,在规定的调查时间范围内没有职业或工作时间、没有达到规定标准,正在寻找有报酬的工作并已在就业机构进行了登记的人员。
下列情况之一属于失业者:①工作合同已终结或暂时终止,正在寻找有报酬工作的人;②从未受雇工作,正在寻找有报酬工作的人;③已退休但在一定时期内仍然能够工作,并正在寻找有报酬工作的人;④目前尚无工作,但已安排好在某一时期开始从事新工作的人;⑤暂时被解雇而又没有薪金的人。
(2)劳动力人口失业的统计指标是失业率,指失业人数占劳动力总数的比例。
失业率实际上是指失业人口与民用劳动力人口之比,可用公式表示为:100%100%+=⨯=⨯失业人口失业人口失业率劳动力人口就业人口失业人口2.失业的类型(1)按失业的原因划分①摩擦性失业摩擦性失业是指由于劳动力的正常流动所导致的暂时失业。
摩擦性失业在任何时期都存在,即使在经济高速增长时期也不会消失。
②季节性失业季节性失业是指由于某些行业生产经营活动的季节性变化而导致劳动力市场失衡造成的失业。
这些行业的生产季节性是由自然条件决定的,表现为生产经营有淡季和旺季之分,难以改变。
因而,这种失业也是正常的。
③结构性失业结构性失业是指由于经济结构变化和产业兴衰转移,劳动力难以适应新的工作岗位要求而造成的失业。
结构性失业与摩擦性失业的共同点是职位空缺与失业并存,但结构性失业更强调劳动供求的结构失衡,失业的持续时间更长,而且集中在经济落后地区。
威廉森宏观经济学有投资的实际跨期模型PPT课件
原文:As we show, a firm invests more the lower its current capital stock, the higher its expected future total factor productivity, and the lower the real interest rate.
9பைடு நூலகம்19
企业的劳动需求
Copyright © 2012 蔡晓陈. All rights reserved.
9-20
全要素生产率或资本存量变化时 的劳动需求需求移动
Copyright © 2012 蔡晓陈. All rights reserved.
9-21
Representative代表性企业投资决 策
9-11
实际利率提高对当期劳动供给 的影响(闲暇的跨期替代效应)
Copyright © 2012 蔡晓陈. All rights reserved.
9-12
一生财富增加对当期劳动供给 曲线的影响
Copyright © 2012 蔡晓陈. All rights reserved.
9-13
当前消费需求(参见第八章)
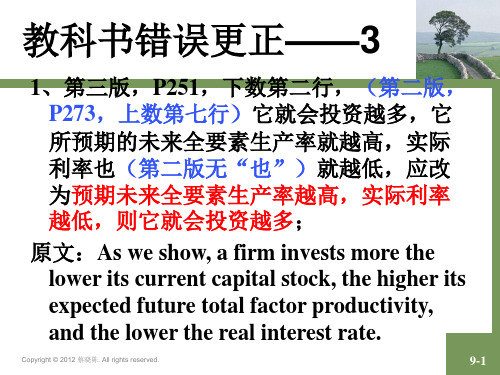
4、第三版,P300,式(10.15)应改为
A P Y P I P H ( X f) B f( 1 R ) B f
5、第三版,P300,式(10.16)应改为
A P Y P X f P H (X f)
Copyright © 2008 Pearson Addison-Wesley. All rights reserved.
9-26
第三节 政府
• 政府 ☆假设
1、当期购买G单位的消费品,未来购买G’单位的消费品; 2、当期的总税收是T,未来的总税收是T’; 3、政府当期发行B单位的政府债券;
- 1、下载文档前请自行甄别文档内容的完整性,平台不提供额外的编辑、内容补充、找答案等附加服务。
- 2、"仅部分预览"的文档,不可在线预览部分如存在完整性等问题,可反馈申请退款(可完整预览的文档不适用该条件!)。
- 3、如文档侵犯您的权益,请联系客服反馈,我们会尽快为您处理(人工客服工作时间:9:00-18:30)。
6-25
Figure 6.10 Adjustment to the Steady State in the Malthusian Model When z Increases
Copyright © 2008 Pearson Addison-Wesley. All rights reserved.
6-26
6-21
Figure 6.7 The Per-Worker Production Function
Copyright © 2008 Pearson Addison-Wesley. All rights reserved.
6-22
Figure 6.8 Determination of the Steady State in the Malthusian Model
6-4
Real Per Capita Income and the Investment Rate
Across countries, real per capita income and the investment rate are positively correlated.
Copyright © 2008 Pearson Addison-Wesley. All rights reserved.
• There is no tendency for rich countries to grow faster than poor countries, and vice-versa. • Rich countries are more alike in terms of rates of growth than are poor countries.
Copyright © 2008 Pearson Addison-Wesley. All rights reserved.
Copyright © 2008 Pearson Addison-Wesley. All rights reserved.
6-23
An increase in z in the Malthusian model
• If z increases, this shifts up the per-worker production function. • In the long run, the population increases to the point where per capita consumption returns to its initial level. • There is no long-run change in living standards.
Copyright © 2008 Pearson Addison-Wesley. All rights reserved.
6-24
Figure 6.9 The Effect of an Increase in z in the Malthusian Model
Copyright © 2008 Pearson Addison-Wesley. All rights reserved.
6-14
Equation 6.4: Equilibrium evolution of the population
This equation describes how the future population depends on current population.
Copyright © 2008 Pearson Addison-Wesley. All rights reserved.
Chapter 6
Economic Growth: Malthus and Solow
Copyright © 2008 Pearson Addison-Wesley. All rights reserved.
Chapter 6 Topics
• • • • Economic growth facts Malthusian model of economic growth Solow growth model Growth accounting
Population Control in the Malthusian Model
• Population control alters the relationship between population growth and per-capita consumption. • In the long run, per capita consumption increases, and living standards rise.
Copyright © 2008 Pearson Addison-Wesley. All rights reserved.
6-20
Equation 6.8
Population growth is increasing in consumption per worker, c
Copyright © 2008 Pearson Addison-Wesley. All rights reserved.
Copyright © 2008 Pearson Addison-Wesley. All rights reserved.
6-11
Equation 6.1: Production Function
Output is produced from land and labor inputs.
Copyright © 2008 Pearson Addison-Wesley. All rights reserved.
Copyright © 2008 Pearson Addison-Wesley. All rights reserved.
6-3
Figure 6.1 Natural Log of Real PerCapita Income in the United States, 1869–2005
Copyright © 2008 Pearson Addison-Wesley. All rights reserved.
6-18
Equation 6.6: The per-worker production function
Copyright © 2008 Pearson Addison-Wesley. All rights reserved.
6-19
Equation 6.7: Equilibrium condition in per-worker form
Across countries, real per capita income and the population growth rate are negatively correlated.
Copyright © 2008 Pearson Addison-Wesley. All rights reserved.
Copyright © 2008 Pearson Addison-Wesley. All rights reserved.
6-2
U.S. Per Capita Income Growth
In the United States, growth in per capita income has not strayed far from 2% per year (excepting the Great Depression and World War II) since 1900.
6-15
Figure 6.5 Population Growth Depends on Consumption per Worker in the Malthusian Model
Copyright © 2008 Pearson Addison-Wesley. All rights reserved.
6-12
Equation 6.2: Evolution of the population
Population growth is higher the higher is percapita consumption.
Copyright © 2008 Pearson Addison-Wesley. All rights reserved.
Copyright © 2008 Pearson Addison-Wesley. All rights reserved.
6-27
Figure 6.11 Population Control in the Malthusian Model
Copyright © 2008 Pearson Addison-Wesley. All rights reserved.
6-13
Equation 6.3: Equilibrium Condition
In equilibrium, consumption equals output produced.
Copyright © 2008 Pearson Addison-Wesley. All rights reserved.
6-5
Figure 6.2 Real Income Per Capita vs. Investment Rate
Copyright © 2008 Pearson Addison-Wesley. All rights reserved.
6-6
Real per capita income and the rate of population growth
Copyright © 2008 Pearson Addison-Wesley. All rights reserved.
6-10
A Malthusian Model of Economic Growth