用shainin方法(GM_Red-X)解决汽车转向振动异响
用GM复杂问题解决工具Red X解决新产品开发过程中降低产品和工艺的风险
ABSTRACTIn today's dynamic automotive environment, reducing the lead-time to introduce new product technologies to the market place can be a key competitive advantage. Employing proactive risk reduction techniques to define key product and process relationships is essential to enhance the production worthiness of a design while it is still in the advanced development phase of the program.This paper describes how Delphi Powertrain Systems applied the Shainin proactive risk reduction methodology in advanced product development to focus resources on understanding and mitigating the risk associated with the development of a new Delphi ammonia anizational and technical strategies to accelerate profound knowledge capture, along with corresponding test results, are presented and discussed.Due to the proprietary nature of the Delphi ammonia sensor's function and operation, this paper limits the disclosure of detailed product characteristics and specifications to generic nomenclature, while still maintaining the technical intent of the paper.INTRODUCTIONThe Delphi ammonia sensor uses a unique Delphi technology to directly measure ammonia levels in the exhaust of Diesel vehicles equipped with a selective catalytic reduction (SCR)aftertreatment system. The sensor output can be used to provide feedback to the SCR system helping provide optimal reduction of NO x emissions.In a Diesel engine SCR system, the ammonia sensor is typically situated behind the SCR catalyst. The SCR system helps reduce NO x emissions in Diesel powertrain systems through a chemical reaction in which ammonia reacts with NO x to produce nitrogen and water. Ammonia is typically introduced into the exhaust flow upstream from the SCR in the form of liquid urea. The ammonia sensor detects excess ammonia in the exhaust gas allowing for more precise dosing of urea and onboard diagnostics (OBD) functionality. This added precision allows for optimal SCR system efficiency and prevents the release of excess ammonia into the atmosphere.The Delphi ammonia sensor is typically used to detect ammonia within a range of 0 to 200 ppm. It is based on a planar alumina substrate with an integral temperature sensor and a thick-film heater for optimum performance. The sensor is equipped with two sensing electrodes. The first electrode outputs the concentration of ammonia as a voltage while the second electrode outputs the concentration of NO 2 as a voltage. Because the ammonia electrode is cross-sensitive to NO 2, the voltage from the NO 2 electrode is used as a correction factor to improve the accuracy of the ammonia sensor. [1]AMMONIA SENSORThe Delphi ammonia sensor (Figure 1) uses a unique Delphi technology to directly measure ammonia levels in the exhaust of a Diesel vehicle equipped with an SCR aftertreatment system. Electrical power is supplied by a sensor controller through an electrical harness with additional connector pinsfor data communication.Risk Reducing Product and Process Design During New Product Development2010-01-0391Published 04/12/2010Peter Bovenzi, Don Bender, Ray Bloink and Michael ConklinDelphi Corporation Advanced Powertrain - USAJohn AbrahamianShainin LLCCopyright © 2010 SAE InternationalFigure 1. Delphi ammonia sensor with harness electricalconnector - production intentFAST TO MARKET DEVELOPMENT STRATEGYThis product development methodology provides a framework for identifying and characterizing the significant factors contributing to the variation in key ammonia sensor product functions. It starts with a top-down management project selection that is provided to the team to ensure that the organizational priority is in place. It is an effective tool for getting a cross-functional team to rapidly define all the product's intended functions.Although this product is a sensor which provides both ammonia sensing and NO2gas sensing in the same planar ceramic element, this project's scope was limited to the ammonia sensing requirement.With management priorities established and the appropriate resources in place for this project, it took only approximately nine months to go from project selection to identification of key product characteristics that were driving variation in ammonia sensor outputs. CHARACTERIZATION OF THE NEW SENSOR BY HIGH RISK FUNCTION There are many customer requirements for this product, but all do not represent the same amount of risk. Some requirements are functions that have been successfully delivered in other products, while other functions are entirely new to this specific product. These new functions are referred to as high risk functions throughout this paper. To understand the relationship between customer requirements, risk and product function, a tool called function modeling was used. [2, 3, 4] The following high risk functions were included in the function model: 1) “Sense Ammonia” and 2) “Sense NO2,” both of which are customer requirements. The team's initial focus was on the “Sense Ammonia” function.The Function Model in Figure 2 shows that one of the key functions that must be achieved to “sense ammonia” is to create a voltage. There are many “intermediate functions”that must occur to “create voltage” as shown in Figure 2. Ultimately, those intermediate functions are achieved by “potential contributing variables” shown at the right side of the function model. The goal of the project team was to identify and separate the “vital few” from the “trivial many.”[5] These vital few characteristics then become the critical product and process characteristics that ultimately allow the“Sense Ammonia” function to be successfully achieved.Figure 2. Function Model - Functions to the right of a box answer the question “how” a function is achieved, or by what method. Functions to the left of a box answer the question “why” a function is achieved, or what is thegoal.Once completed, the function model provided those potential critical product characteristics (or potential critical process parameters) for the “Sense Ammonia” function.All prototype sensors built at the Delphi development facility were evaluated using a research-grade gas bench test. Performance run charts were created for important characteristics to assess product and process capability as shown in Figure 3. This historical prototype data indicated that performance characteristics tended to shift when new lots of materials were introduced. From this data, it was known that the raw materials in the ink used to make the sensor electrodes were among the most critical product characteristics. Thus the variables for the study were selected from among the materials used to formulate the ammonia electrode ink.Figure 3. Performance run chart of ammonia sensorvoltage output.The function model clearly identified the high risk process relationships that needed to be understood and confirmed. It also provided a deeper understanding of how the product actually worked and identified the need for critical process control features. The high-level functions to create a sensor output voltage are shown as “Intermediate Functions” in the function model format in Figure 2.RISK REDUCING HIGH RISK FUNCTIONSThe completed function model captures the critical product characteristics (from the far right-hand side of the function model) that ultimately drive the function that meets the customer requirements (at the far left-hand side of the function model).To ensure that engineering resources were focused on the highest-risk functions, risk priority numbers (RPN) were assigned to each of the critical product functions based on three ranking criteria:1). The amount of cause-effect characterization work that had been done to understand the physics of how the sensor actually functions. If the physics was well understood and documented, the risk is lower than if the physics was not well understood and documented (analogous to “Occurrence” in FMEA [5]).2). The effectiveness of the measurement systems being used to characterize the physics of the sensor function. If a variable measurement system existed that had sufficient accuracy and repeatability, it was lower risk than an attribute measurement system that could only tell “good” from “bad”(analogous to “Detection” in FMEA [5]).3). The risk associated with the sensor failing to achieve the high risk function (analogous to “Severity” in FMEA [5]). The product of these three ranking criteria defines the RPN. After compiling the RPN scores, a Pareto [6] of high-risk functions was established, and the appropriate project teams were assigned based on the highest combined RPN score(Figure 4).Figure 4. Leveraging cumulative risk score for strategicproject selectionOUTPUT MEASUREMENT SYSTEM VERIFICATIONWhen attempting to characterize any cause-effect relationships, it is necessary to have a measurement system that is sufficient to discriminate the desired product performance output. Real differences in product performance outputs are masked by the “blind spot” of measurement error-if the “blind spot” is too large, important changes in the output might not be seen because measurement error is large. Consequently, a measurement system analysis must be performed to determine the size of the measurement error, or “blind spot.”The tool chosen for analyzing the key measurement systems in this analysis was the Shainin Isoplot®. Once completed, the measurement systems that had acceptable measurement error were identified (see Figure 5), and those that had unacceptably high measurement error were studied in more detail to identify the source of the error and correct it (see Figure 6).The primary product outputs that were verified using the Shainin Isoplot® technique were:• Ammonia sensor output voltage• Ammonia sensor response time• Ammonia sensor impedanceFigure 5. Isoplot® of Sensor Output VoltageMeasurement System with Good RepeatabilityFigure 6. Isoplot® of ammonia measurement systemwith poor repeatability The poor repeatability of the ammonia impedance measurement system drove the team to look for an alternative measurement system. In the past, a change in product output due to measurement error may have been misinterpreted as a change due to actual product variation.UNDERSTANDING FACTORS THAT CONTROL KEY PRODUCT PERFORMANCE OUTPUTSEleven ink-related variables were identified from the function model as being potentially significant to the “sense ammonia”function. With eleven variables, a standard full factorial experiment would require 2,048 separate experimental ing fractional factorial experiments would significantly reduce the number of trials needed, but could provide unclear results from the inherent confounding of interactions with main effects in such designs. This is an important consideration when the cause-effect relationships of thecritical characteristics and their interactions are not yet fully understood.Ultimately, Variable Search™ [7] was selected as the technique to understand which of the eleven variables are critical in the ink formulation. Variable Search™ is a technique that can be used when there are a large number of variables that need to be experimentally quantified as to their physical and statistical significance. It is appropriate to use when the list of variables is so long that a DOE would be too time intensive or expensive to screen out critical factors. It relies on the concept of a “binary search” to systematically eliminate variables or groups of variables that may be contributing to the cause-effect relationships.To begin the Variable Search, the team needs to have the candidate factors arranged in two sets: one set where the factor levels are expected to result in a high output and a second set where the same factors are set to levels expected to result in a low output. Repeat tests are run to confirm that the output differences are significant enough and that the results are repeatable. If the differences repeat, then the levels between the two sets are swapped, one factor or a group of related factors at a time until a change in output is seen in one or both of the sets. In this way, main effects as well as interactions will be exposed.The levels for all the ink-related variables in the experiment were chosen to provide a significant difference between the sensor performance outputs. If a significant difference was achieved, that difference could then be attributed to differences in the ink variable levels. The deviations from the nominal ink formulation were chosen to be slightly outside the expected range of variation, but not so far out as to create a non-functioning sensor.The aforementioned three sensor outputs were evaluated using Variable Search™. For illustrative purposes, only the results from the sensor output voltage are presented here.Figure 7 shows the results of the Variable Search™. Each graphed data point represents the output from an individual sensor. The three left-most pairs (called Stage I) show that the significant variables were captured in the eleven variables tested because there is complete separation between the sensor outputs from the “low” and “high” level groups of variables. Decision limits are then calculated around each set of data (dashed blue and red lines in Figure 7).Stage II begins by swapping levels of variables or groups of variables to determine which drives a change to sensor voltage magnitude outside of the home decision limits. Any swap that results in a data point outside of its home decision limit means that variable is a suspected significant variable.Stage II, as shown in Figure 7, identified three potentialfactors that are suspected significant variables which appear to be driving sensor output voltage variation.Swapping levels of “Material A” caused the low-level combination data point to move out of its own decision limits and into the other. However, the high-level combination data point stayed in its home decision limits. Because there was not complete reversal of the data points, there must be another factor interacting with Material A.The next swap of levels of “Material B” showed a similar effect to swapping levels of Material A. In this case, however, the swap of levels resulted in the low-level combination data point to move outside its own decision limits and not into the other decision limits. Once again, there must be another factor interacting with Material B.The results of swapping levels of “Material D” were nearly identical to that of swapping levels of Material A. The magnitude of the change was slightly greater, however. The conclusion was again that Material D is interacting with another factor.At this point, a confirmation run (called Stage III) was performed involving a swap of all three factors' levels (A, B & D) together to confirm whether the difference seen in Stage I could be attributed to levels of those three materials.The confirmation run is shown as the last swap in Figure 7. Because swapping the levels of Materials A, B & D resulted in a complete reversal of data points, all three variables are significant.An additional conclusion can be drawn from these results. Because variation in these three materials' levels resulted in a complete reversal, the other eight factors not tested can be ruled out as significant contributors to the overall variation. By controlling the levels of these other eight factors to their Stage I values, the increase in variation in ammonia sensor output voltage will be minimal, providing Materials A, B & D are appropriately controlled.In summary, the Variable Search™ provided a sound framework to identify and confirm the significant factors that drive variation in ammonia sensor output voltage.The measurement device used to execute the initial Variable Search™ experiments was a research-grade gas test bench that required highly trained and certified personnel to operate the equipment. This research test bench only had the capability to test and collect product performance data on completed sensor assemblies. To accelerate test plan execution and avoid the complexity of the research gas bench, a simpler and leaner production-intent ammonia sensor element tester was designed and built. The product function model and measurement systems analysis were key inputs into the equipment specification created to define the ammonia sensor element tester requirements.Following the same methodology used to identify and reduce risk for the ammonia sensor element itself, the high-risk functions were identified for the element test equipment design and build. In this case, the customer requirements were internal, and were in regard to measurement system analysis (e.g. repeatability, reproducibility, stability, linearity, accuracy, etc.) for the sensor element outputs.The commissioned and qualified ammonia sensor element tester provides:1). the capture of lessons learned for both the production test equipment design and component performance characterization,2). development of software test modules that can be transferred to a production tester,3). more efficient testing with a device easily operated by non-specialized personnel, and4). faster execution of the “binary searches” in futureVariable Search™ experiments.Figure 7. Variable Search™ is used to identify potential significant factors that contribute to the overall variationof a given product output. MEANINGFUL SPECIFICATIONDEVELOPMENTOnce the most detailed product/process functions have been identified with the function model, and the cause-effect relationships of the variables that drive those functions have been identified and statistically confirmed with Variable Search™, the next step is to determine meaningful specifications for them.The Tolerance Parallelogram™ technique will be used to establish the natural tolerances for the critical productcharacteristics identified from the Variable Search™ (Figure 8). Tolerance Parallelogram™ establishes the cause-effect relationship between the independent and dependent variable using regression on a scatter plot, and then defines 95%tolerance bands based on the amount of scatter from the variation due to all of the other characteristics.The specifications for the product function are used to graphically determine the corresponding required control limits for the independent variable, vis-à-vis the criticalproduct characteristic.Figure 8. A Tolerance Parallelogram™ is used to define a realistic tolerance around a critical variable (Ink material D %) to capably meet the customer requirementfor ammonia sensor output voltage.TYING IT ALL TOGETHERThe linkage matrix (Figure 9) is a tool used to tie the new profound knowledge together in a single read-across document. The high-risk functions, all measurement system information, confirmation of cause-effect relationships of the critical characteristics to the high risk function and their corresponding natural tolerances are summarized in thelinkage matrix.Figure 9. Linkage matrix is a tool used to tie the profound knowledge together in a single read-across document. The high-risk function's documentation is shown on the left half of the document, with the causal variables and their corresponding tolerances and measurement systems shown on the right half.CONTROLLING VARIATION OF KEY PRODUCT PERFORMANCE OUTPUTSThe Variable Search™ experiments provided a methodology to more fully understand the cause-effect relationships of the product variables that are controlling critical sensor functions and outputs. This critical product / process understanding is essential to properly specify production-intent test equipment.The fully defined linkage matrix will be used to populate and develop the production process control plan [8] with significant control variables, realistic tolerances and meaningful reaction plans (Figure 10).It is important to fully understand all sensor product outputs and have the means to accurately test and measure the significant product variables upstream in the manufacturing process. Only by developing complete and thorough equipment specifications that fully define the testing requirements, can one be assured of compliant product moving forward through the manufacturing process.Figure 10. The linkage matrix drives development of ameaningful process control plan. LEVERAGING PROFOUND KNOWLEDGE IN THE ORGANIZATIONInstitutionalizing the applicable new knowledge to other sensor types and test equipment designs, current and future is the responsibility of management. The project leader needs to summarize discoveries in a clear and concise project format so that the rest of the organization can quickly assimilate the applicability of the new knowledge to existing product designs and/or manufacturing processes. The project sponsor is responsible for assessing the leverage opportunity of the new knowledge locally within the organization and communicating the findings to executive leadership for global leverage assessment.CONCLUSIONApplying the Shainin proactive risk reduction methodologies has been shown to accelerate profound knowledge capture in the early phases of new product development where risk can be more easily mitigated.This approach also provided an organizational framework to establish project priorities and promote early product and process cross-functional collaboration. The confirmed key factors that control critical product outputs can be used to develop meaningful specifications and a data-driven process control plan that targets processes to reduce variation.In this case study, the team identified the high risk function to be the “Sense Ammonia” function and developed a focused test plan to quantify the critical performance factors in the ink formulation controlling the ammonia sensor output voltage and other sensor performance characteristics. The Shainin ®Variable Search™ technique was able to quickly isolate the critical few factors responsible for controlling the ammonia sensor output without the need for sophisticated computer simulations or exhaustive full factorial Design of Experiments. This knowledge provides the basis for developing meaningful incoming ink material specifications as well as an element fabrication process control plan to effectively manage the sensor output variation in production. To date, this approach to product development has been shown to systematically expose problems earlier in the process as opposed to identifying them later when the risk to the product and customer would be much higher. ACKNOWLEDGMENTSThe authors would like to gratefully acknowledge the contribution of the Delphi Powertrain Systems Advanced Engineering Team responsible for the development of the ammonia sensor at the Customer Technology Center Michigan in Auburn Hills, Michigan, as well as the technical consulting provided by Shainin LLC. REFERENCES1. Wang, D.Y., Yao, S., Shost, M., Yoo, J.-H. et al.,“Ammonia Sensor for Closed-Loop SCR Control,” SAE Int. J. Passeng. Cars - Electron. Electr. Syst. 1(1):323-333, 2008.2. Kaufman J. Jerry, Value Engineering for the Practitioner, North Carolina State University, 3rd edition 19893. Bytheway Charles, Fast Creativity & Innovation: Rapidly Improving Processes, Product Development and Solving, J. Ross Publishing, 20064. Miles Lawerence, Techniques of Value Analysis and Engineering, Mcgraw-Hill (Tx); 2 edition, 19725. Automotive Industry Action Group (AIAG) Manual -Potential Failure Mode & Effects Analysis, 4th Edition, 20086. Pareto Vilfredo, Manual of political economy, Translated by Schwier Ann S.. Edited by Schwier Ann S. and Page Alfred N., MacMillan, 19727. Shainin Dorian and Shainin Peter, Better than Taguchi Orthogonal Tables, Shainin Consultants, Inc., Manchester, CT 19888. Automotive Industry Action Group (AIAG) Manual -Advanced Product Quality Planning and Control Plan (APQP), 2nd Edition, 2008The Engineering Meetings Board has approved this paper for publication. It has successfully completed SAE's peer review process under the supervision of the session organizer. This process requires a minimum of three (3) reviews by industry experts.All rights reserved. No part of this publication may be reproduced, stored in a retrieval system, or transmitted, in any form or by any means, electronic, mechanical, photocopying, recording, or otherwise, without the prior written permission of SAE.ISSN 0148-7191doi:10.4271/2010-01-0391Positions and opinions advanced in this paper are those of the author(s) and not necessarily those of SAE. The author is solely responsible for the content of the paper. SAE Customer Service:Tel: 877-606-7323 (inside USA and Canada)Tel: 724-776-4970 (outside USA)Fax: 724-776-0790Email: CustomerService@SAE Web Address: Printed in USA。
汽车液压转向系统共振噪音问题以及处理

车辆工程技术142维修驾驶汽车液压转向系统共振噪音问题以及处理祁丽华(豫北转向系统(新乡)有限公司,河南 新乡 453000)摘 要:液压转向系统一般被用在大中型汽车中,因为存在固定的特性,所以导致了转向系统共振噪音的产生,影响了驾驶者的体验。
如今,共振噪音已经成为汽车用户投诉最多的一个问题。
笔者对此进行了分析,并提出了处理对策,具体如下。
关键词:汽车;液压转向系统;噪音;问题0 前言 在汽车中,液压转向系统具有灵活轻便的优势,安全性和稳定性也很高,所以得到了广泛的运用。
然而这种系统非常复杂,其和整车的匹配性要求很高,可能会产生系统匹配不适的现象,最终产生共振噪音,对驾乘的舒适性产生不良影响,甚至损坏系统元件,所以需要得到解决。
1 液压转向系统共振噪音的原理和测试 在缓慢驾驶汽车,而且进行转向的过程中,底盘容易产生一些噪音。
特别是在转向到接近最大转角的时候,这种噪音更是非常明显,甚至方向盘和整车都会抖动。
在产生共振噪音时,观察汽车的底盘,发现转向进油管以及回油管均会产生抖动,而且在转向器和油缸活塞腔进行连接的部分,以及转向杆部分也会形成各种抖动。
尽管眼睛观看无法识别,然而当硬质物体触时便能发现其中的抖动。
需对液压转向系统的共振噪音进行测试,通过测试设备对转向油泵的出油口、转向器进油口和回油口的油压数据进行测试。
同时监控系统内部产生故障和抖动的位置,不管是正常情况,还是异常状态,转向器回油口的压力都没有故障。
转向器进油口、油泵出油口的压力却在产生异常现象时,形成了一定的波动[1]。
转向器进油口压力波动比油泵出油口的波动更小,压力波动以及振动噪音一起产生,同时频率也是相同的。
2 产生共振噪音的原因 系统里很多部件都会导致故障产生,最终引发振动和噪音。
通过上面的测试能了解到:异常振动大多数是因为压力波动所产生的,这些故障也属于压力波动导致的噪音。
在液压转向系统里,转向油泵能起到提供动力的作用。
油泵出口所输出的压力P 和流量Q 在运行时产生了异常状态,因为排油腔容积不断变化,所以油泵的输出流量Q 会跟随转子旋转产生有规律的脉动流量变化。
转向异响 原理-概述说明以及解释
转向异响原理-概述说明以及解释1.引言1.1 概述概述:转向异响是在行驶车辆转向时发出的一种异常噪音,常常会引起驾驶者和乘客的不适感。
这种异响不仅影响了驾驶的舒适性,还可能会影响行车安全。
因此,对转向异响进行深入的研究和分析具有重要意义。
本文将从异响的定义和表现、异响的成因分析以及转向异响的原理解析等方面展开讨论,旨在为读者提供对转向异响现象的全面了解。
同时,文章还将探讨影响转向异响的因素、处理方法建议以及对未来研究的展望,希望能为相关领域的研究和实践提供一定的参考价值。
文章结构部分的内容如下:1.2 文章结构本文主要分为引言、正文和结论三个部分。
在引言部分,将对异响现象进行概述,介绍文章的结构和目的。
在正文部分,将从异响的定义和表现入手,分析异响的成因,重点探讨转向异响的原理解析。
在结论部分,将综述影响异响的因素,提出处理方法的建议,并展望未来研究的发展方向。
通过以上结构安排,将全面深入地剖析转向异响的原理,为读者提供系统和全面的信息。
1.3 目的本文的目的在于深入探讨转向异响的原理,为读者提供对这一现象的全面理解。
通过分析异响的定义、表现以及成因,结合转向异响的原理解析,帮助读者了解为什么会出现转向异响,并探讨可能的影响因素和处理方法。
同时,本文也希望为未来相关研究提供一些建议和展望,促进对转向异响机制的进一步探讨和研究,以提高汽车安全性和驾驶舒适性。
2.正文2.1 异响的定义和表现异响是指车辆在行驶过程中出现的一种异常声音,通常表现为响声或者嘈杂的声音。
这种声音往往会给驾驶者带来不适,同时也可能是车辆出现问题的征兆。
异响可以来源于车辆的不同部位,如发动机、制动系统、转向系统等,其中转向异响是指在转向时发出的异常声音。
在日常驾驶中,转向异响可能表现为以下几种情况:1. 转向时发出嘎吱嘎吱或者响铃般的声音。
2. 车轮转向时出现摩擦声或者磨擦声。
3. 车辆转向时出现颤抖或震动的感觉,并伴随着异响声音。
汽车转向系统振动异响问题研究_吉彦栋
汽车转向系统振动异响问题研究吉彦栋 徐克林(同济大学机械与能源工程学院工业工程所上海 200092)摘 要 针对J公司N项目的转向系统在实车试验中发生振动异响的现象,论述了目前在产品质量中所存在的问题,分析了问题产生的根源。
为了解决汽车转向系统振动异响的问题,提出了调整产品的尺寸公差、追踪产品制造工艺流程等改进措施。
通过对零件的失效分析,结合试验及实车验证手段,解决了汽车转向系统振动异响的问题,并为今后其他项目的问题排查提供指导意义。
关键词 转向系统 震动异响 壳体 中间轴1 汽车转向系统的振动异响现象汽车转向系统的振动异响是整车厂的主观驾评工程师在整车耐久试验中发现的。
经现场确认后,发现有2种类型的异响存在。
一种为变速箱档位在1~2档、怠速700~1 500 r/min的转速下,会发出连续如“噔噔”的响声,并在转动方向盘的同时伴有明显的振动;另一种在把方向盘转到左右极限位置时,以绕同心圆的方式让整车以5 km/s的时速行驶,从方向盘处会传来轻微的、不规则的“咯咯”声,同时方向盘上伴有不明显的振动。
在实车试验中,共有10台试验车辆,其中3台发生了任意位置转向的振动异响,1台车辆的左右极限位置存在轻微异响。
由于在汽车底盘中,转向系统作为唯一与驾驶者发生相互作用的部件,也能够传递由于其他部件问题所导致的振动异响。
为排除这一因素对转向系统异响分析的干扰,准备了3辆试验车辆,每辆车底盘的其余部件都经过了测量和验证,事先都装配了没有异响振动的转向系统进行实车试验。
在确认无误后,换上了问题车辆的转向系统,经过再次的实际驾评,振动异响的问题在替换后的车辆上依然重现,且记录的噪声和振动类型与问题车辆上的实际驾评一致,于是确认转向系统存在异响问题。
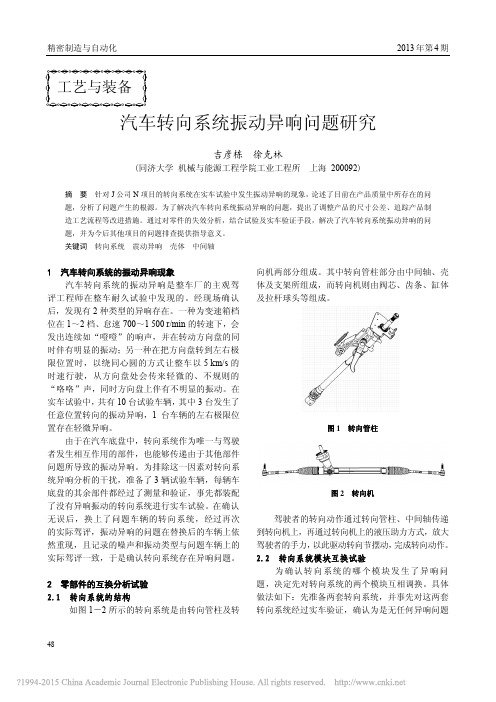
2 零部件的互换分析试验2.1 转向系统的结构如图1-2所示的转向系统是由转向管柱及转向机两部分组成。
其中转向管柱部分由中间轴、壳体及支架所组成,而转向机则由阀芯、齿条、缸体及拉杆球头等组成。
RED-X复杂问题解决策略1
粗糙路面
加重分离:BOB不响在粗糙的路 常规路面 面WOW在整个过程中都响
关联分离法: •焦(重)点分离法是当一个顾客的Green Y与另一个Green Y 有联系,哪一 个更有利于我们的工作或能提供更大的差异。
间隙
异响
关联分离:所有零件接触A表面都 会响,选择测量间隙(mm)
项目事例:
第二排后座外部控制杆能以抽离
传统问题解决: 策略:猜测
Red X策略: Red X策略是……
策略:事实组成和 排列图原理
运用有效的策略在Green Y 中衡量差异来查找Red X
项目定义树
什么是项目定义树?
•它是一个将定性项目转化为定量项 目的工具(Green Y) •它是如何进行测量的指导性的列表
什么时候你会用到项目定义树?
技术问题的解决不仅仅是 找到处置的办法
任何有能力的返修工人都能作到
技术问题的解决是要获取导致 问题产生的真正原因
在此基础上解决问题才是最 经济有效的
如何获取技术知识
1.从专家处获取 •通常有太多的信息 •被他们的意见和情感所驱使 •混淆事实与猜测 •缺少沟通 2.从经验中获得 •提出问题观察结果
Red X Shainin DOE
----Apprentice
GM 全球复杂问题的解决工具
学习目的
了解什么时候应该使用Red X 通过使用Red X提高取证能力 开拓技术问题解决者迅速获取问题产生原因 的能力
什么是问题
任何事物与标准都有 一定的偏差
所有问题来源于 与标准的差异
通常我们所遇到的问题类型主要有
过大尺寸 过小尺寸 圆度 等. . .
事件Green Y:是那些发生的或没有发生的“事情” (“物理”项目)事件可能是满意的也可能是不满意 的: 前门关闭 气缸爆裂 挡风玻璃雨刷不动 刹车尖叫 发动机呜呜声 仪表板发出咯哒声 窗卷上 活动车顶泄漏 变矩器振动 等. . .
转向系统异响案例分析
转向系统异响案例分析一、案例概述在汽车维修过程中,转向系统异响是一个常见的问题。
本文将以一个具体的案例为例,对转向系统异响的产生原因、诊断与排除过程进行深入分析。
二、案例描述一辆新款轿车,行驶里程为2万公里,出现转向系统异响问题。
车主反映,在行驶过程中,尤其是在低速转弯时,车辆的转向系统会发出明显的“吱吱”声。
声音具有一定的规律性,与方向盘的转动角度无关。
三、故障诊断与排除1、初步检查:维修技师对车辆进行了初步检查,发现异响确实存在。
初步判断异响可能来自转向机、转向柱或轮胎。
2、进一步诊断:为了确定异响的具体来源,维修技师进行了更深入的检查。
首先,检查了轮胎,发现轮胎磨损正常,无异物卡住。
接着,检查了转向柱,发现转向柱的润滑良好,无磨损痕迹。
最后,对转向机进行检查时,发现转向机内部有些许杂质,且油脂较脏。
3、故障排除:根据诊断结果,维修技师对转向机进行了清理和润滑,更换了转向机内部的油脂。
同时,对轮胎和转向柱进行了常规保养。
四、案例分析本案例中,转向系统异响的主要原因是转向机内部的杂质和油脂污染。
在长时间的运行过程中,这些杂质和油脂相互作用,导致转向机内部的零件磨损加剧,从而产生异响。
此外,低速转弯时,由于方向盘转动的速度较慢,使得杂质和油脂在局部形成较大的摩擦力,进一步加剧了异响的产生。
五、经验总结1、对于转向系统异响问题,应从多个方面进行诊断。
首先要检查轮胎、转向柱和转向机,观察是否存在明显的问题。
2、如果发现转向机内部存在杂质或油脂污染,应立即进行清理和润滑。
同时,要更换干净的油脂,以保证转向机的正常运行。
3、在日常保养过程中,要加强对轮胎、转向柱和转向机的检查和维护。
特别是在高速行驶过程中,要留意是否存在异常声音或振动,及时排除问题。
五线谱响人生路五线谱,对于音乐家来说,是音乐的载体,是他们表达情感、传递思绪的工具。
而人生路,对于每一个人来说,都是一段旅程,充满了无数的挑战与机遇,也是我们追求梦想、实现价值的道路。
常见汽车异响排除方法技巧(大全)

常见汽车异响排除方法技巧(大全)平衡杆胶套异响慢速通过减速带的瞬间,听到底盘处传来“滋儿”的干摩擦声,(多在冷车时出现,热车后响声不再出现),可判断为平衡杆胶套与平衡杆摩擦产生。
拆下胶套,在胶套内测涂抹润滑脂再装回胶套,即可解决。
减震器响车辆在水泥路面,中速行驶时,底盘传来沉闷的“咚咚”声,响声频率跟路面的平整性有关,一般是减震器响,更换减震器可解决。
伺服电机或鼓风机响开空调,安静的时候,在中控台内偶尔听到“吱吱”或者“咔咔”声,关闭空调后响声不再出现。
多为调整内或者冷暖风的伺服电机响或者鼓风机有异物,必要的话,更换伺服电机。
轮胎有石子响车辆在行驶中,听到“哒、哒、哒”的响声,响声的频率随车速加快而加快,开着车窗时响声更加明显,遇到这种情况,基本可以判断是轮胎的胎纹缝隙里卡了大粒的石子(或者扎钉子了),将石子抠掉即可解决。
喇叭有问题按下喇叭开关,喇叭的响声变得沙哑或者跟之前比声音异常,可能是其中一个喇叭有问题,需要更换。
(很多车有两个喇叭)刹车盘法兰盘异响行驶时,车轮附近传来连续不断的金属摩擦声,车辆完全停止后,响声消失。
考虑是刹车盘的导风法兰盘变形,跟刹车盘摩擦导致,确定后,用老虎钳等工具校正法兰盘即可解决。
玻璃升级支架故障在升级过程中,出现升降不平顺,且伴随着咔咔的响声,一般是玻璃升级支架问题,需要更换玻璃升级支架。
传动轴外球笼故障当方向盘往某一边(左或右)打到底,准备掉头或者转弯的时候,从底盘处传来连续的、清脆的“咔咔咔”声,响声的频率随着车速增加而加快,当方向稍微回正,或者直线行驶时,该响声消失,可判断为某一侧的传动轴外球笼有故障,需更换外球笼。
万向节松动异响每次转动方向盘到某一个角度的时候,就会从方向盘下部传来沉闷的“咚”的声音,响声的同时用手能感觉到方向盘也会轻微震动,此现象多为转向管柱的万向节松动,或者管柱与方向机插合部位缺少润滑脂导致,后者更常见,此时,只需要在插合部位涂抹足量的润滑脂,即可解决。
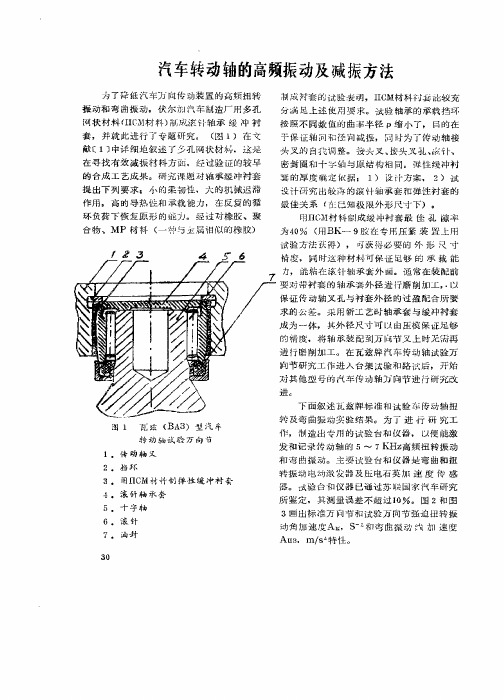
汽车转动轴的高频振动及减振方法
据 采 集 系 统 ( CDAS , 以 实 现 现 场 数 据 P )
处 理 和 按 照 等 距 离 取 样 在 进 行 等 问 黼 有 效 ・
立 以 I —P BM C— O 2 5 O微 机 为 主 体 的公 路 养
振 动 和 弯 曲振 动, 伏 尔 加 汽 车 制 造 厂用 多 孔
网 状 材 料 (I, 料 ) j 滚 针轴 霞 缓 冲 衬 IC M材 成 套 , 并就 此 进 行 了 专 题 研 究 。 ( 1 在 文 图 ) 献 [1 中详 细 地 叙 述 了多 孔 网 状 材 料 , 这 是 ] 在 寻 找 有 效 减 振 材 料 方 面 ,经 过验 证 的 较 早 的 合 成 工 艺成 果 。 研 究 课 题 对 轴 承 缓 冲 衬 套 提 出 下 列 要求 小 的 柔 韧 性 , 大 的 机 械 迟 滞 作 用 , 高 的 导 热 性 和 承 载 能力 ,在 反 复 的 循
条 路 线 上 测 量路 面的 平 整 度 , 在 汽 车行 驶 方
向大 约 每 隔 5 mm采 集 一 个 数 据 , 测 量 路 面 0 纵 断 面平 整 度 并 记 录 下来 。三 条路 线 是 -外
轮轮 迹 线 ( 乘 客 坐 的 一 边 ) , 内 轮 轮 迹 线 在 ( 驶员 乘坐的一边)和 两车轮 中 央 的 路 驾
环 负 荷 下 恢 复 原 形 的 能力 。 经 过 对 橡胶 、聚
合 物 、 M P 材 料 ( 种 与来自盆 属 相 似 的橡 胶 ) 一
求 的 公 差 。 采 用新 工 艺 时 轴 承 套 与 缓 冲 衬套
成 为 一 体 , 其 外 径 尺寸 可 以 由压 模 保 证 足够 的 精 度 , 将 轴 承装 配 到 万 向节 叉 上 时无 需再