散热器扩散热阻的计算
热阻的公式
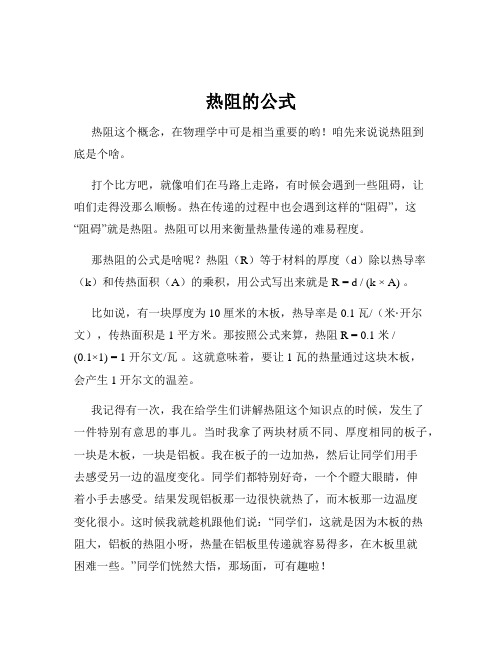
热阻的公式热阻这个概念,在物理学中可是相当重要的哟!咱先来说说热阻到底是个啥。
打个比方吧,就像咱们在马路上走路,有时候会遇到一些阻碍,让咱们走得没那么顺畅。
热在传递的过程中也会遇到这样的“阻碍”,这“阻碍”就是热阻。
热阻可以用来衡量热量传递的难易程度。
那热阻的公式是啥呢?热阻(R)等于材料的厚度(d)除以热导率(k)和传热面积(A)的乘积,用公式写出来就是 R = d / (k × A) 。
比如说,有一块厚度为 10 厘米的木板,热导率是 0.1 瓦/(米·开尔文),传热面积是 1 平方米。
那按照公式来算,热阻 R = 0.1 米 /(0.1×1) = 1 开尔文/瓦。
这就意味着,要让 1 瓦的热量通过这块木板,会产生 1 开尔文的温差。
我记得有一次,我在给学生们讲解热阻这个知识点的时候,发生了一件特别有意思的事儿。
当时我拿了两块材质不同、厚度相同的板子,一块是木板,一块是铝板。
我在板子的一边加热,然后让同学们用手去感受另一边的温度变化。
同学们都特别好奇,一个个瞪大眼睛,伸着小手去感受。
结果发现铝板那一边很快就热了,而木板那一边温度变化很小。
这时候我就趁机跟他们说:“同学们,这就是因为木板的热阻大,铝板的热阻小呀,热量在铝板里传递就容易得多,在木板里就困难一些。
”同学们恍然大悟,那场面,可有趣啦!再深入讲讲热阻这个公式哈。
其中的热导率(k),它反映了材料本身导热的能力。
像金属的热导率一般就比较高,比如铜、铝这些,所以它们常常被用来制作散热器,能快速把热量散出去。
而像木头、塑料这些材料,热导率就低,热阻就大。
厚度(d)就很好理解啦,材料越厚,热量要穿过它就越难,热阻也就越大。
传热面积(A)也会影响热阻哦。
如果传热面积大,热量传递就相对容易些,热阻就会小一点。
在实际生活中,热阻的概念用处可大了。
比如说咱们家里的暖气,管道和暖气片的材质选择、厚度设计,都得考虑热阻,这样才能保证咱们的屋子能暖暖和和的。
散热器的扩散热阻计算.docx

散热器的扩散热阻计算
1、什么是扩散热阻?
当热源与底板的面积相差比较大时,热量从热源中心往边缘扩散所形成热阻叫扩散热阻。
图1扩散热阻示意
2、如何计算?
针对一个底板上贴一个热源的散热状况,如何计算扩散热阻?分两种情况,一个是热源在底板中心,另一个是不在中心。
针对第一种情况的扩散热阻计算如下:
As:热源面积
Ap:底板面积
t:底板厚度
R0:散热器的平均热阻(从地板厚度的一半之处到环境的热阻)k:散热器材料的导热系数
假设其他参数已知,扩散热阻Rc的计算公式如下:
其中,系数λ是一个由Ap和As计算出来的因子。
从上可以看出,总热阻为扩散热阻与散热器的平均热阻的总和。
针对热源不在中心的情况,需要对公示1进行修正。
增加修正系数C:
而C的计算如下:
假设一个正方形的底板,热源也是正方形,由于对称的关系,取四分之一底板来做分析:
图2:2种热源不在中心的状况
如图2所示,左侧的图,热源的坐标为(x,0),右侧的图中热源坐标为(x,x)。
左侧图中的C=1.414(根号2)。
右侧的C=2 ,如何推算需另外讨论。
如图2中的2种热源位置,热源的大小为25*25mm的话,最大的扩散热阻分别计算如下:
总热阻分别为2.259℃/W和3.334℃/W。
对于上述两种状况,平均热阻R0是不变的,即平均热阻与热源的位置无关。
散热器的计算
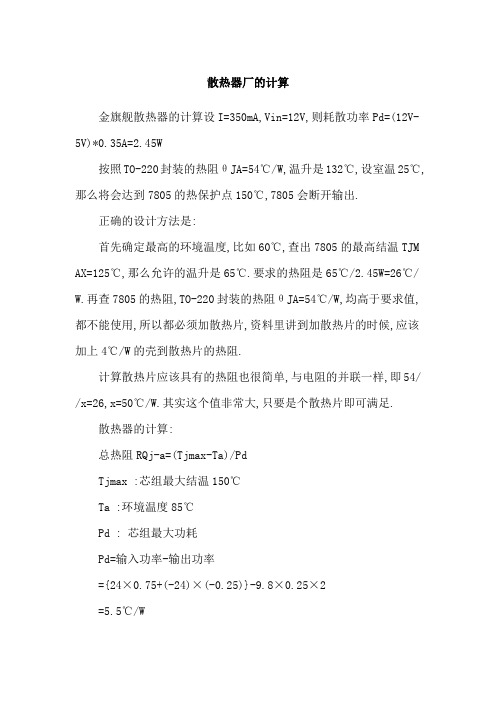
散热器厂的计算金旗舰散热器的计算设I=350mA,Vin=12V,则耗散功率Pd=(12V-5V)*0.35A=2.45W按照TO-220封装的热阻θJA=54℃/W,温升是132℃,设室温25℃,那么将会达到7805的热保护点150℃,7805会断开输出.正确的设计方法是:首先确定最高的环境温度,比如60℃,查出7805的最高结温TJM AX=125℃,那么允许的温升是65℃.要求的热阻是65℃/2.45W=26℃/ W.再查7805的热阻,TO-220封装的热阻θJA=54℃/W,均高于要求值,都不能使用,所以都必须加散热片,资料里讲到加散热片的时候,应该加上4℃/W的壳到散热片的热阻.计算散热片应该具有的热阻也很简单,与电阻的并联一样,即54/ /x=26,x=50℃/W.其实这个值非常大,只要是个散热片即可满足.散热器的计算:总热阻RQj-a=(Tjmax-Ta)/PdTjmax :芯组最大结温150℃Ta :环境温度85℃Pd : 芯组最大功耗Pd=输入功率-输出功率={24×0.75+(-24)×(-0.25)}-9.8×0.25×2=5.5℃/W总热阻由两部分构成,其一是管芯到环境的热阻RQj-a,其中包括结壳热阻RQj-C和管壳到环境的热阻RQC-a.其二是散热器热阻RQd-a,两者并联构成总热阻.管芯到环境的热阻经查手册知 RQj-C=1.0 R QC-a=36 那么散热器热阻RQd-a应<6.4. 散热器热阻RQd-a=[(10/kd) 1/2+650/A]C其中k:导热率铝为2.08d:散热器厚度cmA:散热器面积cm2C:修正因子取1按现有散热器考虑,d=1.0 A=17.6×7+17.6×1×13算得散热器热阻RQd-a=4.1℃/W,散热器选择及散热计算目前的电子产品主要采用贴片式封装器件,但大功率器件及一些功率模块仍然有不少用穿孔式封装,这主要是可方便地安装在散热器上,便于散热。
LED散热器各部分热阻及其影响因素
⑶.产热功率的影响:同一散热器,同样环境下,实际产热功率越大,散热器的热阻反而略有减小。
所以散热器的总热阻不仅与散热器的散热面积、几何尺寸、表面材料的辐射系数等自身因素有关,还受LED的产热功率以及周围环境的对流系数等外部因素的影响,并不是一个恒定的数值。但一般来说,在自然对流情况下对流系数变化并不大,正常情况下LED产热功率的变化也不会太大,对热阻的影响应该很小。为便于分析和计算,我们在应用时可近似认为散热器的总热阻是一定的。
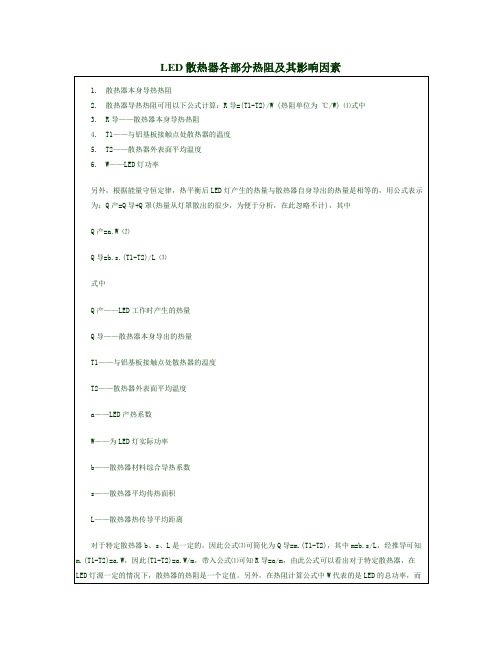
Q产=a.W⑵
Q导=b.s.(T1-T2)/L⑶
式中
Q产——LED工作时产生的热量
Q导——散热器本身导出的热量
T1——与铝基板接触点处散热器的温度
T2——散热器外表面平均温度
a——LED产热系数
W——为LED灯实际功率
b——散热器材料综合导热系数
s——散热器平均传热面积
L——散热器热传导平均距离
对于特定散热器b、s、L是一定的,因此公式⑶可简化为Q导=m.(T1-T2),其中m=b.s/L,经推导可知m.(T1-T2)=a.W,因此(T1-T2)=a.W/m,带入公式⑴可知R导=a/m,由此公式可以看出对于特定散热器,在LED灯源一定的情况下,散热器的热阻是一个定值。另外,在热阻计算公式中W代表的是LED的总功率,而LED在工作中一部分功率用于发光,一部分功率转变为热能,因此既然是计算热阻,公式中的W换成产热功率(a.W)更为科学,这样R导=1/m=L/(b.s),就是说散热器本身热阻与电阻一样,是一个仅跟散热器本身参数有关的常数,它与散热器平均传热距离成正比,与散热器平均传热面积、散热器材料导热系数成反比。
LED散热器各部分热阻及其影响因素
散热器散热计算公式:
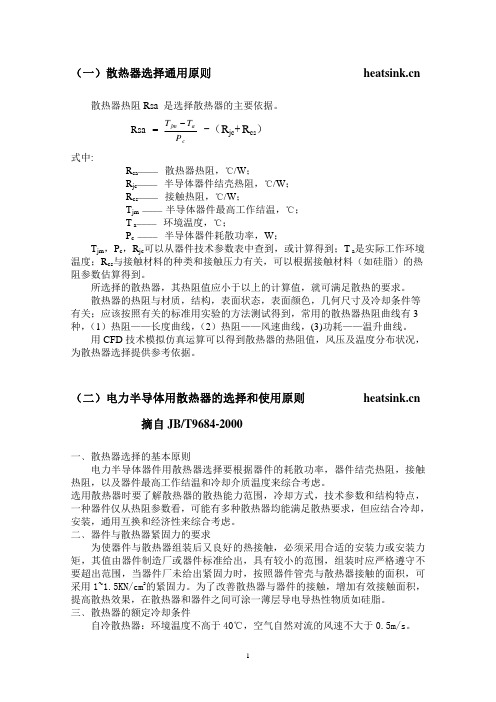
(一)散热器选择通用原则 散热器热阻Rsa 是选择散热器的主要依据。
Rsa=c ajm P TT−-(R jc+R cs)式中:R sa────散热器热阻,℃/W;R jc────半导体器件结壳热阻,℃/W;R cs────接触热阻,℃/W;T jm ────半导体器件最高工作结温,℃;T a────环境温度,℃;P c ────半导体器件耗散功率,W;T jm,P c,R jc可以从器件技术参数表中查到,或计算得到;T a是实际工作环境温度;R cs与接触材料的种类和接触压力有关,可以根据接触材料(如硅脂)的热阻参数估算得到。
所选择的散热器,其热阻值应小于以上的计算值,就可满足散热的要求。
散热器的热阻与材质,结构,表面状态,表面颜色,几何尺寸及冷却条件等有关;应该按照有关的标准用实验的方法测试得到,常用的散热器热阻曲线有3种,(1)热阻——长度曲线,(2)热阻——风速曲线,(3)功耗——温升曲线。
用CFD技术模拟仿真运算可以得到散热器的热阻值,风压及温度分布状况,为散热器选择提供参考依据。
(二)电力半导体用散热器的选择和使用原则 摘自JB/T9684-2000一﹑散热器选择的基本原则电力半导体器件用散热器选择要根据器件的耗散功率,器件结壳热阻,接触热阻,以及器件最高工作结温和冷却介质温度来综合考虑。
选用散热器时要了解散热器的散热能力范围,冷却方式,技术参数和结构特点,一种器件仅从热阻参数看,可能有多种散热器均能满足散热要求,但应结合冷却,安装,通用互换和经济性来综合考虑。
二﹑器件与散热器紧固力的要求为使器件与散热器组装后又良好的热接触,必须采用合适的安装力或安装力矩,其值由器件制造厂或器件标准给出,具有较小的范围,组装时应严格遵守不要超出范围,当器件厂未给出紧固力时,按照器件管壳与散热器接触的面积,可采用1~1.5KN/cm2的紧固力。
为了改善散热器与器件的接触,增加有效接触面积,提高散热效果,在散热器和器件之间可涂一薄层导电导热性物质如硅脂。
大功率半导体器件用散热器风冷热阻计算公式和应用软件
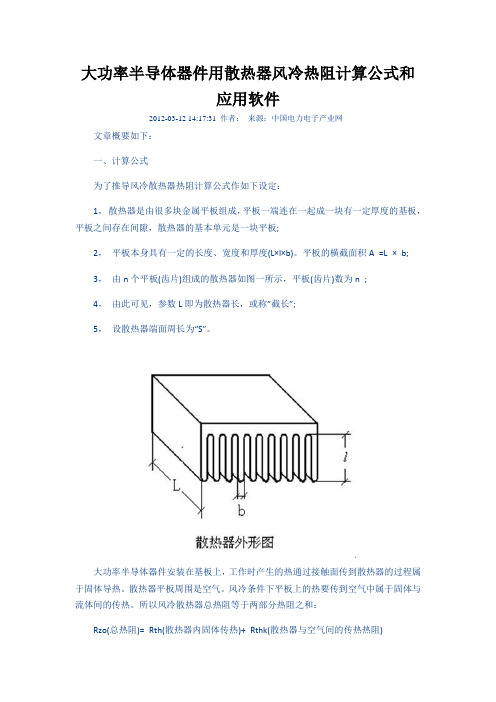
大功率半导体器件用散热器风冷热阻计算公式和应用软件2012-03-12 14:17:31 作者:来源:中国电力电子产业网文章概要如下:一、计算公式为了推导风冷散热器热阻计算公式作如下设定:1,散热器是由很多块金属平板组成,平板一端连在一起成一块有一定厚度的基板,平板之间存在间隙,散热器的基本单元是一块平板;2,平板本身具有一定的长度、宽度和厚度(L×l×b)。
平板的横截面积A =L × b;3,由n个平板(齿片)组成的散热器如图一所示,平板(齿片)数为n ;4,由此可见,参数L即为散热器长,或称“截长”;5,设散热器端面周长为“S”。
大功率半导体器件安装在基板上,工作时产生的热通过接触面传到散热器的过程属于固体导热。
散热器平板周围是空气。
风冷条件下平板上的热要传到空气中属于固体与流体间的传热。
所以风冷散热器总热阻等于两部分热阻之和:Rzo(总热阻)= Rth(散热器内固体传热)+ Rthk(散热器与空气间的传热热阻)引用埃克尔特和..德雷克著的“传热与传质”中的基本原理和公式。
推导出如下实用公式:Ks 为散热器金属材料的导热系数。
20℃时,纯铝:KS = 千卡/ 小时米℃;纯铜:Ks = 332 千卡/ 小时米℃;参数L、l、b、S的单位:米;风速us 单位:米/秒如散热器端面的周边长为S 、散热器的长为L,忽略两端面的面积,散热器的总表面积为: A = S L 。
代入上式后,强迫风冷条件下散热器总热阻公式也可写成:对某一型号的散热器来说参数Ks、b、n、S 都是常数。
用此公式即可求出不同长度L、不同风速us条件下的总热阻,并可作出相应曲线。
本公式的精确性受到多种因素的影响存在一定误差。
主要有:ⅰ,受到环境空气的温度、湿度、气压等自然因素的影响。
如散热器金属的热导系数“Ks”与金属成分及散热器工作时温度有关,本文选用的是20℃时的纯铝。
ⅱ,文中所用的“风速”是指“平均风速”。
电子仪器中散热器热阻的计算方法
2)如果守门员离开球门线向前,球从底线袭来时守门员会漏球或 者会导致“乌龙球”。
因此,实践证明守门员在球门线上的位置为最佳位置。 4.结论 本文对Voronoi图功能及足球机器人的运动进行了介绍.提出并 实现一种简单、高效的Voronoi多边形面积计算方法。创造性的提出了 机器人判别动作的算法模型。利用Vomnoi图的几何特性分析并解决 足球机器人的任务规划问题。实践证明,用voronoi图来提出的足球机 器人动作判别算法提高了足球机器人的判别能力,降低了判别的失误 率,并实现了足球机器人的分工协作,在一定程度上增强了足球机器人
科技信息
。机械与电子O
2008年第4期
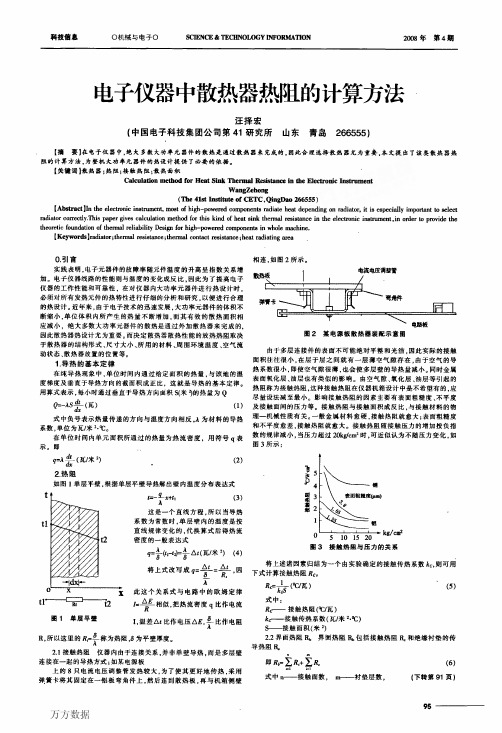
电子仪器中散热器热阻的计算方法
汪择宏 (中国电子科技集团公司第41研究所 山东青岛266555)
【摘要】在电子仪器中,绝大多数大功率元器件的散热是通过散热器来完成的。因此合理选择散热器尤为重要。本文提出了该类散热器热
阻的计算方法,为整机大功率元器件的热设计提供了必要的依据。
的智能化。《
【参考文献】 [11张颖霞,杨宜民,陈波.多智能体团队合作在机器人足球赛中的应用.微机发 展.2004年第7期. [2]吴丽娟,翟玉人.足球机器人系统众角色分配策略的设计.基础自动化.2000 年第7卷. [3]尚路彦,张小川,李祖枢.关于机器人足球区域射门动作算法的改进.重庆工 学院学报.2∞5年3月. [4]柳长安,刘冈,刘春阳.机器人足球防守算法研究.哈尔滨工业大学学报.2002 年第36卷第7期.
5
鼍P事p
4
3
碰壤曩鞲
2●
5 lO 15 20
散热器扩散热阻的计算
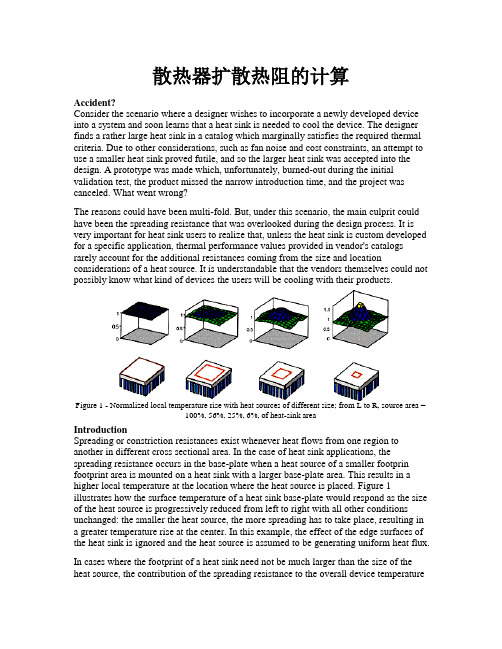
散热器扩散热阻的计算Accident?Consider the scenario where a designer wishes to incorporate a newly developed device into a system and soon learns that a heat sink is needed to cool the device. The designer finds a rather large heat sink in a catalog which marginally satisfies the required thermal criteria. Due to other considerations, such as fan noise and cost constraints, an attempt to use a smaller heat sink proved futile, and so the larger heat sink was accepted into the design. A prototype was made which, unfortunately, burned-out during the initial validation test, the product missed the narrow introduction time, and the project was canceled. What went wrong?The reasons could have been multi-fold. But, under this scenario, the main culprit could have been the spreading resistance that was overlooked during the design process. It is very important for heat sink users to realize that, unless the heat sink is custom developed for a specific application, thermal performance values provided in vendor's catalogs rarely account for the additional resistances coming from the size and location considerations of a heat source. It is understandable that the vendors themselves could not possibly know what kind of devices the users will be cooling with their products.Figure 1 - Normalized local temperature rise with heat sources of different size; from L to R, source area =100%, 56%, 25%, 6%, of heat-sink areaIntroductionSpreading or constriction resistances exist whenever heat flows from one region to another in different cross sectional area. In the case of heat sink applications, the spreading resistance occurs in the base-plate when a heat source of a smaller footprin footprint area is mounted on a heat sink with a larger base-plate area. This results in a higher local temperature at the location where the heat source is placed. Figure 1 illustrates how the surface temperature of a heat sink base-plate would respond as the size of the heat source is progressively reduced from left to right with all other conditions unchanged: the smaller the heat source, the more spreading has to take place, resulting in a greater temperature rise at the center. In this example, the effect of the edge surfaces of the heat sink is ignored and the heat source is assumed to be generating uniform heat flux. In cases where the footprint of a heat sink need not be much larger than the size of the heat source, the contribution of the spreading resistance to the overall device temperaturerise may be insignificant and usually falls within the design margin. However, in an attempt to remove more heat from today's high performance devices, a larger heat sink is often used and, consequently, the impact of spreading resistance on the performance of a heat sink is becoming an important factor that must not be ignored in the design process. It is not uncommon to find in many high performance, high power applications that more than half the total temperature rise of a heat sink is attributed to the spreading resistance in the base-plate.The objectives of this article are:1) to understand the physics and parameters associated with spreading resistance2) to provide a simple design correlation for accurate prediction of the resistance3) to discuss and clarify the concept of spreading resistance with an emphasis on the practical use of the correlation in heat sink applicationsThe correlation provided herein was originally developed in references 1 and 2. This article is an extension of the earlier presentation.Spreading ResistanceBefore we proceed with the analysis, let us attend to what the temperature distributions shown in Fig. 1 are telling us. The first obvious one, as noted earlier, is that the maximum temperature at the center increases as the heat source becomes smaller. Another important observation is that, as the temperature rises in the center, the temperatures along the edges of the heat sink decrease simultaneously. It can be shown that this happens in such a way that the area-averaged surface temperature of the heat sink base-plate has remained the same. In other words, the average heat sink thermal performance is independent of the size of a heat source. In fact, as will be seen later, it is also independent of the location of the heat source.The spreading resistance can be determined from the following set of parameters: ∙footprint or contact area of the heat source, A s∙footprint area of the heat sink base-plate, A p∙thickness of the heat sink base-plate, t∙thermal conductivity of the heat sink base-plate, k∙average heat sink thermal resistance, R0We will assume, for the time being, that the heat source is centrally mounted on the base-plate, and the heat sink is cooled uniformly over the exposed finned surface. These two assumptions will be examined in further detail. Figure 2 shows a two-dimensional side view of the heat sink with heat-flow lines schematically drawn in the base-plate whose thickness is greatly exaggerated. At the top, the corresponding surface temperature variation across the center line of the base-plate is shown by the solid line. The dotted line represents the average temperature of the surface which is, again, independent of theheat source size and can be easily determined by multiplying R0 with the total amount of heat dissipation, denoted as Q.As indicated in Fig. 2, the maximum constriction resistance R c, which accounts for the local temperature rise over the average surface temperature, is the only additional quantity that is needed for determining the maximum heat sink temperature. It can be accurately determined from the following correlation.Figure 2 - Two dimensional schematic view of local resistance or temperature variation of a heat sinkshown with heat flow LinesNote that the correlation addresses neither the shape of the heat source nor that of the heat sink base-plate. It was found in the earlier study that this correlation typically results in an accuracy of approximately 5% over a wide range of applications with many combinations of different source/sink shapes, provided that the aspect ratio of the shapes involved does not exceed 2.5. See references 1 and 2 for further discussions.Example ProblemConsider an aluminum heat sink (k = 200W/mK) with base-plate dimensions of 100 x 100 x 1.3 mm thick. According to the catalog, the thermal resistance of this heat sink under a given set of conditions is 1.0 °C/W. Find the maximum resistance of the heat sink if used to cool a 25 x 25 mm device.SolutionsWith no other specific descriptions, it is assumed that the heat source is centrally mounted, and the given thermal resistance of 1.0 °C/W represents the average heat sink performance. From the problem statement, we summarize:∙A s = 0.025 x 0.025 = 0.000625 m2∙A p = 0.1 x 0.1 = 0.01 m2∙t = 0.0013 m∙k = 200 W/mK∙R0 = 1.0 °C/WTherefore,Hence, the maximum resistance, R total , is:R total = R o + R c = 1.0 + 0.66 = 1.66 °C/WReaders should note the far right temperature distribution in Fig. 1 which is the result of a numerical simulation for the present problem in rectangular coordinates.Effect of Source LocationIn the following two sections, we will limit our examination to the current example problem. As we shall see, the result of this limited case study will allow us to draw some general yet useful conclusions. Suppose the same heat source in the above example was not centrally located, but mounted a distance away from the center. Obviously, the maximum temperature would further rise as compared to that found in the above example. Figure 3 shows the local resistances corresponding to two such cases:Figure 3 - Heat-sink local resistance showing the effect of source location:from L to R, heat source at (37.5,0) and (37.5,37.5)the first one is for the case where the heat source is mounted midway along the edge, and the other, where it is mounted on one corner of the heat sink. For these two special cases,the maximum spreading resistance can be calculated by using Eq. (1) for R c with input parameters t and R0 modified as shown below:R c = C x R c (A p,A s,k,t/C,R0/C)(3) with for the first case, and C = 2 for the second case. It is to be noted that this expression is independent of the source size. Numerically, for the current problem with a 25 x 25 mm heat source, it results in the maximum spreading resistances of 1.29 and2.38 °C/W, or the total resistances of 2.29 and3.38 °C/W for the first and second cases, respectively. For both cases, it can be shown that the average surface resistance has not changed from unity.For other intermediate source locations, numerical simulations were carried out and a plot is provided in Fig. 4 for the correction factor C f which can be used to compute the total resistance asR total = R0 + C f R c(4) where R c is determined from Eq. (1), given for the case with the heat source placed at the center.Figure 4 - Correction factor as a function of source locationThe coordinates in Fig. 4 indicate the location of the center of the heat source measured from the center of the base-plate in mm: the case with a centrally located heat source corresponds to (0,0), and the cases shown in Fig. 3 correspond to (37.5,0) and (37.5,37.5) for the first and second cases, respectively. Only one quadrant is shown in Fig. 4 as they would be, owing to the assumption of uniform cooling, symmetrical about (0,0). As can be seen from the figure, the correction factor increases from 1 as the heat source is placed away from the center. It is worthwhile noting that the increase is, however, very minimal over a wide region near the center, and most increases occur closer to the edges.Unlike C in the earlier expression, C f is case dependent (i.e. it depends on the heat-source size). However, it was found that the plots of C f obtained for many other cases exhibit essentially the same profile as that shown in Fig. 4, with magnitudes at the corners determined from Eq. (3), and the domain of the plot defined by the maximum displacement of the heat source. Based on this observation, a general conclusion can be made: for all practical purposes, as long as the heat source is placed closer to the center than to the edges of the heat sink, the correctional increase in the spreading resistance may be ignored, and C f =1 may be used. As noted above, this would introduce a small error of no greater than 5-10% in the spreading resistance which, in turn, is a fraction of the total resistance.So far, we have assumed a uniform cooling over the entire finned-surface area of the base-plate. Although this is a useful assumption, it is seldom realized in actual situations. It is well known that, due to the thinner boundary layer and the less down-stream heating effect, a device would be cooled more effectively if it is mounted toward the air inlet side. Again, a numerical simulation is carried out using our example problem with the boundary layer effect included.Figure 5 shows the resulting modified correction factor as a function of the distance from the center of the heat sink to the heat source placed along the center line at y=0: x = -37.5 mm corresponds to the front most leading edge location of the heat source and x = 37.5 mm the rear most trailing edge placement.Figure 5 - Correction factor modified for boundary layer effect at y=0As can be seen from the figure, it is possible to realize a small improvement by placing the heat source forward of the center location where C f < 1. However, it was experienced in practice that accommodating a heat source away from the center and ensuring its mounting orientation often cause additional problems during manufacturing and assembly processes.Summary and DiscussionA simple correlation equation is presented for determining spreading resistances in heat sink applications. A sample calculation is carried out for a case with a heat source placed at the center of the heat sink base-plate and a means to estimate the correction factor to account for the effect of changing the heat-source location is provided. It is to be noted that the correlation provided herein is a general solution which reduces to the well known Kennedy's solution3 when R0 approaches 0: the mathematical equivalent of isothermal boundary condition. Kennedy's solution is valid only when R0 is sufficiently small such that the fin-side of the heat sink base-plate is close to isothermal. Otherwise, Kennedy's solution, representing the lower boundary of the spreading resistance, may result in gross underestimation of the resistance.The earlier study revealed that, depending on the relative magnitude of the average heat sink resistance, the spreading resistance may either increase or decrease with the base-plate thickness. If the heat sink resistance is sufficiently small, as in liquid cooled heat sink applications, the spreading resistance always increases with the thickness, and an optimum thickness does not exist. On the other hand, if the heat sink resistance is large, as experienced in most air-cooled applications, the spreading resistance decreases with the thickness and a finite optimum thickness exists.It is to be noted that the present correlation calculates the spreading resistance only in the base-plate and does not account for the effect of additional spreading that may exist in other places, such as the fins in a planar heat sink. This additional spreading in the fins usually affects the spreading resistance in a similar way to a thicker base-plate. The current author found that an increase of 20% in the base-plate thickness during the calculation roughly accounts for the effect of this additional spreading in the fins of the same material for most planar heat sinks under air cooling. No modification is required for pin-fin heat sinks.Seri LeeAmkor Electronics, Inc.1900 South Price RoadChandler, AZ 85248, USATel: +1 (602) 821-2408 x 5459Fax: +1 (602) 821-6730Email: lees@References1.S. Lee, S. Song, V. Au, and K.P. Moran, Constriction/Spreading Resistance Model for ElectronicPackaging, Proceedings of the 4th ASME/JSME Thermal Engineering Joint Conference, Vol. 4, 1995, pp. 199-206.2.S. Song, S. Lee, and V. Au, Closed Form Equation for Thermal Constriction/Spreading Resistanceswith Variable Resistance Boundary Condition, Proceedings of the 1994 IEPS Conference, 1994, pp.111-121.3. D. P. Kennedy, Spreading Resistance in Cylindrical Semiconductor Devices, Journal of AppliedPhysics, Vol. 31, 1960, pp. 1490-1497.。
- 1、下载文档前请自行甄别文档内容的完整性,平台不提供额外的编辑、内容补充、找答案等附加服务。
- 2、"仅部分预览"的文档,不可在线预览部分如存在完整性等问题,可反馈申请退款(可完整预览的文档不适用该条件!)。
- 3、如文档侵犯您的权益,请联系客服反馈,我们会尽快为您处理(人工客服工作时间:9:00-18:30)。
散热器扩散热阻的计算Accident?Consider the scenario where a designer wishes to incorporate a newly developed device into a system and soon learns that a heat sink is needed to cool the device. The designer finds a rather large heat sink in a catalog which marginally satisfies the required thermal criteria. Due to other considerations, such as fan noise and cost constraints, an attempt to use a smaller heat sink proved futile, and so the larger heat sink was acceptedinto the design. A prototype was made which, unfortunately, burned-outduring the initial validation test, the product missed the narrowintroduction time, and the project was canceled. What went wrong?The reasons could have been multi-fold. But, under this scenario, the main culprit could have been the spreading resistance that was overlooked during the design process. It is very important for heat sink users to realize that, unless the heat sink is custom developed for a specific application, thermal performance values provided in vendor's catalogs rarely account for the additional resistances coming from the size and location considerations of a heat source. It is understandable that the vendors themselves could not possibly know what kind of devices the users will be cooling with their products.Figure 1 - Normalized local temperature rise with heat sources of different size; from L to R, source area = 100%,56%, 25%, 6%, of heat-sink areaIntroductionSpreading or constriction resistances exist whenever heat flows from one region to another in different cross sectional area. In the case of heatsink applications, the spreading resistance occurs in the base-plate when a heat source of a smaller footprin footprint area is mounted on a heat sink with a larger base-plate area. This results in a higher local temperature at the location where the heat source is placed. Figure 1 illustrates how the surface temperature of a heat sink base-plate would respond as the size ofthe heat source is progressively reduced from left to right with all otherconditions unchanged: the smaller the heat source, the more spreading has to take place, resulting in a greater temperature rise at the center. In this example, the effect of the edge surfaces of the heat sink is ignored and the heat source is assumed to be generating uniform heat flux.In cases where the footprint of a heat sink need not be much larger than the size of the heat source, the contribution of the spreading resistance to the overall device temperature rise may be insignificant and usually fallswithin the design margin. However, in an attempt to remove more heat from today's high performance devices, a larger heat sink is often used and, consequently, the impact of spreading resistance on the performance of a heat sink is becoming an important factor that must not be ignored in the design process. It is not uncommon to find in many high performance, high power applications that more than half the total temperature rise of a heat sink is attributed to the spreading resistance in the base-plate.The objectives of this article are:1) to understand the physics and parameters associated with spreading resistance2) to provide a simple design correlation for accurate prediction of the resistance3) to discuss and clarify the concept of spreading resistance with an emphasis on the practical use of the correlation in heat sink applicationsThe correlation provided herein was originally developed in references 1 and 2. This article is an extension of the earlier presentation.Spreading ResistanceBefore we proceed with the analysis, let us attend to what the temperature distributions shown in Fig. 1 are telling us. The first obvious one, as noted earlier, is that the maximum temperature at the center increases as the heat source becomes smaller. Another important observation is that, as the temperature rises in the center, the temperatures along the edges of the heat sink decrease simultaneously. It can be shown that this happens in such a way that the area-averaged surface temperature of the heat sink base-plate has remained the same. In other words, the average heat sink thermal performance is independent of the size of a heat source. In fact, as will be seen later, it is also independent of the location of the heat source.The spreading resistance can be determined from the following set of parameters:footprint or contact area of the heat source, A sfootprint area of the heat sink base-plate, A pthickness of the heat sink base-plate, tthermal conductivity of the heat sink base-plate, kaverage heat sink thermal resistance, R0We will assume, for the time being, that the heat source is centrally mounted on the base-plate, and the heat sink is cooled uniformly over the exposed finned surface. These two assumptions will be examined in further detail. Figure 2 shows a two-dimensional side view of the heat sink withheat-flow lines schematically drawn in the base-plate whose thickness is greatly exaggerated. At the top, the corresponding surface temperature variation across the center line of the base-plate is shown by the solid line. The dotted line represents the average temperature of the surfacewhich is, again, independent of the heat source size and can be easily determined by multiplying R0 with the total amount of heat dissipation, denoted as Q.As indicated in Fig. 2, the maximum constriction resistance R c, whichaccounts for the local temperature rise over the average surface temperature, is the only additional quantity that is needed for determining the maximum heat sink temperature. It can be accurately determined from the following correlation.Figure 2 - Two dimensional schematic view of local resistance or temperature variation of aheat sink shown with heat flow LinesNote that the correlation addresses neither the shape of the heat source nor that of the heat sink base-plate. It was found in the earlier study thatthis correlation typically results in an accuracy of approximately 5% over a wide range of applications with many combinations of different source/sink shapes, provided that the aspect ratio of the shapes involved does notexceed . See references 1 and 2 for further discussions.Example ProblemConsider an aluminum heat sink (k = 200W/mK) with base-plate dimensions of 100 x 100 x mm thick. According to the catalog, the thermal resistance ofthis heat sink under a given set of conditions is °C/W. Find the maximum resistance of the heat sink if used to cool a 25 x 25 mm device.SolutionsWith no other specific descriptions, it is assumed that the heat source is centrally mounted, and the given thermal resistance of °C/W represents the average heat sink performance. From the problem statement, we summarize:A s = x = m2A p = x = m2t = mk = 200 W/mKR0= °C/WTherefore,Hence, the maximum resistance, R total , is:R total = R o + R c= + = °C/WReaders should note the far right temperature distribution in Fig. 1 whichis the result of a numerical simulation for the present problem in rectangular coordinates.Effect of Source LocationIn the following two sections, we will limit our examination to the current example problem. As we shall see, the result of this limited case study will allow us to draw some general yet useful conclusions. Suppose the same heat source in the above example was not centrally located, but mounted a distance away from the center. Obviously, the maximum temperature would further rise as compared to that found in the above example. Figure 3 shows the local resistances corresponding to two such cases:Figure 3 - Heat-sink local resistance showing the effect of source location:from L to R, heat source at ,0) and ,the first one is for the case where the heat source is mounted midway along the edge, and the other, where it is mounted on one corner of the heat sink. For these two special cases, the maximum spreading resistance can be calculated by using Eq. (1) for R c with input parameters t and R0 modified as shown below:R c = C x R c (A p,A s,k,t/C,R0/C)(3)with for the first case, and C = 2 for the second case. It is to be noted that this expression is independent of the source size. Numerically,for the current problem with a 25 x 25 mm heat source, it results in the maximum spreading resi stances of and °C/W, or the total resistances of and °C/W for the first and second cases, respectively. For both cases, it can be shown that the average surface resistance has not changed from unity.For other intermediate source locations, numerical simulations were carried out and a plot is provided in Fig. 4 for the correction factor C f which can be used to compute the total resistance asR total = R0 + C f R c(4)where R c is determined from Eq. (1), given for the case with the heat source placed at the center.Figure 4 - Correction factor as a function of source locationThe coordinates in Fig. 4 indicate the location of the center of the heat source measured from the center of the base-plate in mm: the case with a centrally located heat source corresponds to (0,0), and the cases shown in Fig. 3 correspond to ,0) and , for the first and second cases, respectively. Only one quadrant is shown in Fig. 4 as they would be, owing to the assumption of uniform cooling, symmetrical about (0,0). As can be seen from the figure, the correction factor increases from 1 as the heat source is placed away from the center. It is worthwhile noting that the increase is, however, very minimal over a wide region near the center, and most increases occur closer to the edges.Unlike C in the earlier expression, C f is case dependent . it depends on the heat-source size). However, it was found that the plots of C f obtained for many other cases exhibit essentially the same profile as that shown in Fig. 4, with magnitudes at the corners determined from Eq. (3), and the domain of the plot defined by the maximum displacement of the heat source. Based on this observation, a general conclusion can be made: for all practical purposes, as long as the heat source is placed closer to the center than to the edges of the heat sink, the correctional increase in the spreading resistance may be ignored, and C f =1 may be used. As noted above, this would introduce a small error of no greater than 5-10% in the spreading resistance which, in turn, is a fraction of the total resistance.So far, we have assumed a uniform cooling over the entire finned-surface area of the base-plate. Although this is a useful assumption, it is seldom realized in actual situations. It is well known that, due to the thinnerboundary layer and the less down-stream heating effect, a device would be cooled more effectively if it is mounted toward the air inlet side. Again, a numerical simulation is carried out using our example problem with the boundary layer effect included.Figure 5 shows the resulting modified correction factor as a function of the distance from the center of the heat sink to the heat source placed along the center line at y=0: x = mm corresponds to the front most leading edge location of the heat source and x = mm the rear most trailing edge placement.Figure 5 - Correction factor modified for boundary layer effect at y=0As can be seen from the figure, it is possible to realize a small improvement by placing the heat source forward of the center location where C f < 1. However, it was experienced in practice that accommodating a heat source away from the center and ensuring its mounting orientation often cause additional problems during manufacturing and assembly processes.Summary and DiscussionA simple correlation equation is presented for determining spreading resistances in heat sink applications. A sample calculation is carried out for a case with a heat source placed at the center of the heat sink base-plate and a means to estimate the correction factor to account for theeffect of changing the heat-source location is provided. It is to be noted that the correlation provided herein is a general solution which reduces to the well known Kennedy's solution3 when R0 approaches 0: the mathematical equivalent of isothermal boundary condition. Kennedy's solution is valid only when R0 is sufficiently small such that the fin-side of the heat sink base-plate is close to isothermal. Otherwise, Kennedy's solution, representing the lower boundary of the spreading resistance, may result in gross underestimation of the resistance.The earlier study revealed that, depending on the relative magnitude of the average heat sink resistance, the spreading resistance may either increase or decrease with the base-plate thickness. If the heat sink resistance is sufficiently small, as in liquid cooled heat sink applications, the spreading resistance always increases with the thickness, and an optimum thickness does not exist. On the other hand, if the heat sink resistance islarge, as experienced in most air-cooled applications, the spreading resistance decreases with the thickness and a finite optimum thickness exists.It is to be noted that the present correlation calculates the spreading resistance only in the base-plate and does not account for the effect of additional spreading that may exist in other places, such as the fins in a planar heat sink. This additional spreading in the fins usually affects the spreading resistance in a similar way to a thicker base-plate. The current author found that an increase of 20% in the base-plate thickness during the calculation roughly accounts for the effect of this additional spreading in the fins of the same material for most planar heat sinks under air cooling. No modification is required for pin-fin heat sinks.Seri LeeAmkor Electronics, Inc.1900 South Price RoadChandler, AZ 85248, USAReferences1.S. Lee, S. Song, V. Au, and . Moran, Constriction/Spreading Resistance Model forElectronic Packaging, Proceedings of the 4th ASME/JSME Thermal Engineering JointConference, Vol. 4, 1995, pp. 199-206.2.S. Song, S. Lee, and V. Au, Closed Form Equation for Thermal Constriction/SpreadingResistances with Variable Resistance Boundary Condition, Proceedings of the 1994 IEPS Conference, 1994, pp. 111-121.3. D. P. Kennedy, Spreading Resistance in Cylindrical Semiconductor Devices, Journal ofApplied Physics, Vol. 31, 1960, pp. 1490-1497.。