2013年数学建模A优秀论文2
2013年研究生数学建模优秀论文E2

二、模型假设
假设一: 收入是划分中等收入的主要依据。但反映收入水平的具体指标可以有多 种可能,如城镇居民人均年全部收入、人均年生活费收入、人均年可支配收入, 农村居民可以有人均年纯收入等,因为虽然这些指标的口径不同,但并不影响反 映居民收入水平的真实性只是在同一范围内应选用相同口径的指标进行分析
3
假设二:中等收入一个用区域值表示的数量,而不是一个确定的数值 假设三: 收入域值的界定具有一定的假定性从下面中等收入的界定方法中,可以 看到最低收入水平和最高收入水平的界定都有假定条件 假设四:收入域值的边界也是模糊的,可以有一定的上下浮动空间。
参赛密码 (由组委会填写)
第十届华为杯全国研究生数学建模竞赛
学
校
贵州大学
参赛队号
10657008 1.秦书琳
队员姓名
2.王影 3.任丽
参赛密码 (由组委会填写)
第十届华为杯全国研究生数学建模竞赛
题 目
E:中等收入人口度量与实证研究
摘
要:
本文对中等收入人口进行了定量研究, 并建立了有效的度量中等人口范围的 数学模型。 Lorentz 曲线是研究人口收入的一个重要手段,为此,本文首先提出了一种 拟合 Lorentz 曲线的模型,用 L( p) p (1 (1 p) ) , 1, 0 , 0 1, 来拟 合 Lorentz 曲线,得到了相当精确的结果(MSE 精确到 106 ) 。该模型在此时成 立,这是之前所没有的结论。 为了度量中等收入人口,本文提出了衡量社会分配公平的局部公平指数
此模型有效地解决了传统“人口空间”模型对两极分化不敏感的问题。 基于以上研究,本文提出了更为一般的中等收入人口的定义、原理、即经济 学意义,并提出了测算方法。 关键词:中等收入;Lorentz 曲线;分配公平度
2013年美国数学建模比赛提交论文-二等奖

Print This Page Close This WindowFor office use only T1________________T2________________T3________________T4________________Team Control Number22940Problem ChosenAFor office use only F1________________F2________________F3________________F4________________2013Mathematical Contest in Modeling (MCM)Summary Sheet(Attach a copy of this page to your solution paper.)Type a summary of your results on this page.Do not include the name of your school,advisor,or team members on this page.SummaryThis paper aims to design the optimal shape of Brownie pan on the given conditions.The influencing factors include the shape of pan,the ratio of width and the length of the oven,and the weight be conferred to the quantity of Brownie pans that can be put in a oven and evenness of heat distribution.We have a scientific study about the three typical shapes,namely rectangular circular and oval,and we get the following conclusion that the time required by circular pans is the shortest,while rectangular pan can maximize the use of space.To solve the problem,we simplify the influencing factors and assume that the area of being effective baking inside the oven can be exactly fulfilled by rectangular pans.So that we can easily solve the condition 1,and be aware of that the rectangular pans is the optimal shape;and the same to the condition 2,we believe that the temperature distribution on the outer edge of circular pans is completely uniform,so the optimal solution is circular.When it comes to the third condition,it’s a typical linear programming problem.We use the idea of normalizing to construct design objectivefunction:(1)s A nZ p p N A=+−.In the formula above,the calculation of area being effective heated adopt the view of discrete,which is very innovative (formula (k)).By using the above objective function,whose results is roughly the same with the results of MATLAB,This can be used to confirm each other.We obtain the desired optimal solution to a maximum of 1.215,which is larger than other shapes’maximum by 21.5%.Its advantages are obvious,so this further illustrates the correctness of the ideal optimal shape.So we can say the pan we design is the Ultimate Brownie Pan!ContentsI.Introduction (4)II.Assumptions (4)III.Analysis&Models (5)IV.Solutions (12)4.1rectangular Brownie Pans (12)4.2circular Brownie Pans (14)4.3oval Brownie Pans (15)V.Optimization of the model (12)5.1rectangular Brownie Pans (16)5.2circular Brownie Pans (16)5.3oval Brownie Pans (17)References (18)Advertising sheet (19)Appendix (20)List of Figures1.Region of discrete (8)2.Volumetric controlled by internal node (8)3.The simulation isotherms of rectangular pan (10)4.The simulation isotherms of circular pan (10)5.The simulation isotherms of oval pan (10)6.Temperature curve of the rectangular pan center (11)7.Temperature curve of the circular pan center (11)8.Temperature curve of the oval pan center (11)9.How the rectangular pans are placed in the oven (14)10.The placement of round Brownie Pan in the oven (14)11.The ideal shape of the Brownie Pan (15)12.The distribution of the pans in the oven (15)13.The placement of rectangular Brownie Pan in the oven (16)14.The zoning figure of the extended the oven (17)15.The arrangement of Brownie Pans in theoretical optimal shape in the oven (18)16.Distribution of temperature of rectangular pan (20)17.Distribution of temperature of circular pan (20)18.Distribution of temperature of oval pan (20)1Introduction:When baking in a rectangular pan heat is concentrated in the4corners and the product gets overcooked at the corners(and to a lesser extent at the edges).In a round pan the heat is distributed evenly over the entire outer edge and the product is not overcooked at the edges.However,since most ovens are rectangular in shape using round pans is not efficient with respect to using the space in an oven.Since both have their own advantages and can complement each other,we consider that a combination of the two will be a better choice.The purpose of this article is to identify the pan in best shape to satisfy various needs.2Assumption:1.The heat inside the oven is Changeless,After a Brownie Pan have been put in the oven,the heat is conducted to the center from the edge.2.The initial temperature of the food is25C o.3.The coefficient of thermal conductivity of the food is0.1.4.To make full use of the area of a rectangular oven,We assume that the area of being effective baking inside the oven can just be fulfilled by rectangular Brownie Pans.Table 1NotationParameter MeaningFThe heat of per unit time through a given area λThermal conductivity TTemperaturetThe temperature field in the Cartesian coordinate system A Cross-sectional areaΔx,ΔyThe amount of change of the x-direction,y-direction τ∆Time variation amount ∆o F The number of grid FourierT ij The temperature of the arbitrary point (i,j)T oThe temperature of the center of the pant j i T ,The temperature of the arbitrary point (i,j)at time t 0div ∇The gradient value at a certain point3Analysis &ModelsWe solved this problem using numerical solution of heat conduction.The numerical solution is based on the basic knowledge of heat transfer,and a method of using partial differential equations solving a heat conduction problem.Heat conduction partial differential equations:⎪⎪⎪⎪⎩⎪⎪⎪⎪⎨⎧⎟⎟⎠⎞⎜⎜⎝⎛∂∂+∂∂+∂∂=∇=∂∂conditions Initial conditions dary B z T y T x T T t T oun 2222222ααThe basic idea:putting the problem of the temperature within the object continuously changing with time and space transformed into the problem of the temperature value in a finite number of discrete points within the area of the field of time and space.Further,using the temperature value of these discrete units to approximate the continuous temperature distribution.Models:1.The establishment of the physical modelAccording to the meaning of the questions,we construct three models,which are rectangular pan,circular pan and oval pan.2.The establishment of the mathematical modelOne of the main purpose of the study heat conduction problem is obtained under certain boundary conditions the state of objects within the temperature distribution with spatial location and time.⑴.Equations of heat conductionThe equations of the temperature distribution in the description of thermal conductivity inside the object is called the partial differential equation of heat conduction,which also known as the heat diffusion w of conservation of energy and the Fourier law are its fundamental basis.Once solving the temperature distribution,the heat conduction rate of inside the object or surface at any point on can be obtained by Fourier law.That is the heat flux density.Unsteady heat conduction problem for the temperature field varies with time,by obtaining the temperature distribution inside the object at different times,can determine the thermal stress and thermal deformation of the various parts.The general form of the equation of heat conduction in the Cartesian coordinate system:v ztz y t y x t x t cφλλλτρ+∂∂∂∂+∂∂∂∂+∂∂∂∂=∂∂)(((................................(a)This formula reflects the relationship between the thermal conductivity of the object within the total energy conservation.In the calculation,the thermal conductivity is seen as a constant,so the above equation reduces to:c zty t x t t v ρφατ+∂∂+∂∂+∂∂=∂∂)(222222...............................................................(b)It is composed by three physical properties of a physical parameter,called thermal diffusivity,can also be referred to the coefficient of thermal conductive,whose unit iss m /2.It indicates the temperature tends to be uniform capacity of the object in the heating or cooling process.This comprehensive parameters in the non-steady-state heat transfer process is a very important parameter.⑵.Single -Valued Property conditionsAll pure heat conduction problem can be described with the equation of heat conduction in the corresponding coordinates,including one-dimensional and multidimensional,steady-state and non-steady-state,constant material properties and Variable physical properties,the internal heat source and no internal heat source heat conduction problems.Differential equations (The mathematical said general solution)must contain the pending integration constant.In addition to the differential equation,for these constants to be determined uniquely determined must be attached to a certain characteristics of solving this particular heat conduction problem and limited of external environment or supplementary explanation.These additional instructions and restriction condition is Single -Valued Property conditions,and mathematics known as boundary conditions.Mathematical model of any one specific full heat conduction problems,in addition to the equation of heat conduction in the appropriately selected coordinates,must be given the corresponding Single -Valued Property conditions.In terms of the general problem of thermal conductivity,the Single -Valued property conditions consist of the following two parts:①.Time conditionsFor unsteady-state heat conduction,the temperature field of the object at the start time must be given,so the time conditions are known as initial conditions.In the three-dimensional Cartesian coordinate system,the initial conditions can generally be expressed as the following form:),,(0z y x f t ==τ....................................................................(c)Under normal circumstances,the object having a completely uniform temperature at the beginning of the process,so we can think that the distribution function (),,(z y x f )is a constant in the above formula.②.Boundary conditionsThe boundary conditions refers to the contact and interaction in the heat exchange of hot objects between the boundary surface and the external environment.For unsteady heat conduction,it is often the external driving force making process take place and develop.Here we consider the first category.Stipulate:The surface temperature is a room temperature.),(y x f t w =,The boundary temperature.Notes:tcons t w tan =3.Discrete the solution domainDiscretization is divided the substantially continuous object into a series of tiny unit,while the center of the unit is called a node.Divided the spatial domain x into n subparagraph,the step is Δx,get 0,l,2,...,i,...,n x node of the n +1;divided the spatial domain y into n subparagraph,while the step is Δy,get 0,l,2,...,i,...,n y node of the n +1.Intersection point (i,j)of the separation line represents the spatial domain position.The size of space and time step depends on the specific circumstances of the problem,and sometimes cannot bearbitrarily selected,needing to consider the node temperature equation solving stability problems which are as shown in the following figure:Figure 1Region of discreteTime can also be divided into many inter-cell.The physical significance of the zone discretization is that we can think a node focus the heat capacity around its tiny area.Thus the node temperature is the average temperature of this tiny area.Thus,the temperature of all the nodes together represents the distribution of the temperature within this continuous region.4.Establish the difference equation of nodes’temperatureUsing difference quotient instead of the derivative,and then on the basis of the relationship of the heat balance we can a establish differential equation.The same as the steady heat conduction,using the method of heat balance,you can establish the temperature difference equations of objects internal nodes and boundary nodes at unsteady heat conduction.As shown in the following figure:Figure 2V olumetric controlled by internal nodeFor the two-dimensional unsteady heat conduction problems of constant material properties and no internal heat source,the internal nodes (i,j)represents the thermal eq uilibrium of the control volume is expressed as:In unit time,the heat flow rate jQ λand iQ λcoming from the adjacent control volume ),1()1j i j i +−,,(and)1,()1,(+−j i j i ,is equal to the control volume thermodynamic energy increase dU .dU Q Q j i =+λλ.Therefore,for each node Differential established as follows:tj,i 2222j,i y T x T t T ⎟⎟⎠⎞⎜⎜⎝⎛∂∂+∂∂α=⎟⎠⎞⎜⎝⎛∂∂................................................(d)for the left side:tT T t T (t j,i t t j ,i j ,i ∆−=∂∂∆+.................................................................(e)for the right side:2,1,,1,222)(x T T T x Tt j i t j i t j i j i ∆+−=∂∂−+........................................................(f)21,,1,,222(y T T T y Tt j i t j i t j i j i ∆+−=∂∂−+...................................................................(g)Making y x ∆=∆,2xF o ∆∆=∆τα,∆o F :called grid Fourier number.(e),(f)and (g)substituted into the formula (d).After finishing,the following equations can be obtained:t j i o t j i t j i t j i t j i o t t j i T F T T T T F T ,1,1,,1,1,)41()(∆+−+−∆∆+−++++=......(h)This equation can draw two conclusions:1).Any node temperature of an internal node at a particular moment can be obtained directly from the temperature of the node and its collar node at the former time.Do not have the simultaneous solution of the equations.This is the advantages of the explicit difference scheme.So we can start from the initial temperature sequentially obtainsτ∆,τ∆2,...,τ∆k each time nodes temperature.2).In front of the t j i T ,coefficient in the formula (h)can not be negative.So041≥−∆o F ,which is equivalent to 41≤∆o F ................................(i )This is the stability conditions of two-dimensional non-steady-state thermal conductivity inside the object node temperature equation explicit difference scheme.Physical meaning:The temperature of any internal node at time t t ∆+all dependson the temperature of this node and its surrounding nodes at time t .When the temperature of surrounding nodes to are known,the higher the temperature of the node is,the higher the temperature of the node will be at time t t ∆+.Therefore,the coefficient in front of the formula can not be negative,which must meet the formula (i)that represents the stability condition.5.Solve temperature algebra equation and obtain the temperature of all nodes Assuming the area of each Brownie Pan is 2600cm A =and it will be heated for ing Matlab programming solve the problem of rectangular,round and oval pan heat conduct to the center from all sides into the incubator.As shown in the following figures:Figure 6The simulation isothermsFigure 7The simulation isothermsof rectangular panof circular panFigure 8The simulation isothermsof oval panyy102030405060708090100yWe can know from the figures above:whatever the shape of the pan is,the isothermal lines are arcuate curve,and they are nearly circular in its center position.Therefore,in the design of the shape of baking pan,we should try to design it in arc-shape in order to make the baking pan to be evenly heated.Temperature curve of the pan centerFigure 9Temperature curve of Figure 10Temperature curve ofthe rectangular pan centerthe circular pan centerFigure 11Temperature curve of oval pan center6.Conclusion⑴.The circular baking pan temperature rises very quickly.When the food reaches a certain temperature,the time required is the shortest.However,the space utilization of the pan in the rectangular oven is low,not efficient of using energy;⑵.Rectangular baking pan to maximize the use of space,effective use of energy.However,the temperature difference between the center and the periphery will cause the food being heated unevenly;⑶.The oval pan space utilization and degree of heat evenly is between the circular baking pan and rectangular baking pan.T e m p e r a t u r e /T e m p e r a t u r e /T e m p e r a t u r e /4Solutions Solutions::For the condition 1:Based on the assumption 4,it’s obvious that if we use a rectangular Brownie Pan,The Pans can exactly fulfill the oven.That’s to say,the number of pans in rectangular shape used is maximum.For the condition 2:①.How to determine the area where temperature is uniformly distributedWe use temperature variance of all the discrete points as a threshold value to determine whether a point is in the area where temperature is uniformly ly,whether its temperature can satisfy the following inequality:00ij T T div −≤∇..............................(j)If the above equation can be satisfied,we believe that this point is at the place where temperature is evenly distributed.②.The area of the region where temperature is uniformly distributedWhen we calculating the area of the region where temperature is uniformly distributed,We apply the previous concept of discretization.Firstly,we use MATLAB to calculate the number of points(N)in a given range,then,we can know that the area occupied by each discrete point isyx A d d d ×=...........................................(k)so,the total area occupied by all the discrete point isyx a d d N A ××=............................................(l)According to the temperature distribution figure of various Brownie Pan in geometric shapes in the first question,we measure the uniformity of the temperature distribution with the temperature variance22211((,))n navg i j T i j T n σ==−=∑∑..............................(m)and it’s obvious that:2rectangle22circle σσσ>>oval And we can know that only when Brownie Pan is round,can the heat on outer edge ofthe Brownie Pan be completely evenly distributed.For the condition 3:Based on the above two considerations,We think the combination of the above two optimization conditions we can use the following normalized method and get the Objective function :(1)sA nZ p p N A=+−...................................(n)In addition,there are other restrictions:1.Different kinds of pan share the same area;2.The temperature reached after a specific time(6mins);3.The coefficient of thermal conductivity of the food is similar.(0.1)4.1Firstly,for rectangular Brownie Pans whose heating time is 6mins,we know in the objective function above,n=N,while the area where temperature is uniformly distributed ,A s ,need to be worked out.In this paper we can use the MATLAB program programmed in the Question 1,and we can get the area where temperature is uniformly distributed by directly substituting into the length and width of a rectangle,and the objective function turns into:(1)s AZ p p A=+−........................(o)the equation shows objective function becomes a single-valued function of p,and ithas no relationship with WL,while 'L NL =By using the MATLAB program written in the Analysis &Models,we can get we can obtain the output of 12sets of data(in the table 2),Fitting the relationship between a and b,and we can get the following function:2234.49()469.05599.16s W WA L L=−+Notes:to obtain their solutions,we assume that the area of a rectangle is 600cm 2,And the objective function turns into600/)16.59905.469(49.234)(1(2+−−+=LWL W p p Z With the constrains:..(0,1)[0,1]s t p W L∈∈And the optimal solution is Z=1,if and only if 1&Wp L=it can be satisfied Table 2Scatter values calculated by the MATLABL W 0.800.760.630.600.580.55A s /cm 2374.78378.69397.52402.94406.01412.92LW 0.490.450.420.380.350.32A s /cm 2426.43436.38444.33455.59464.53473.89Figure 12How the rectangular pans are placed in the oven4.2Secondly,for circular Brownie Pan which have been heated in the oven for 6mins,We already know from the question1that heat is evenly distributed on the outer edge of the round pan.Therefore,we can think in round Brownie Pans A A=and the objective function turns into:1nZ p p N=+−........................................(p)Figure 13The placement of round Brownie Pan in the ovenTo simplify the calculation,We make'W L for the fixed value k,namely 'Wk L =,And we know that by calculating the horizontal distance between two round pan is(n −............................(q)And we can obtain constraint condition of circular as following:(1n L −+≤.....................(r)4.3thirdly,according to the above calculation results,we think it will be a good ideato combine the advantages of round Brownie Pan and rectangle Brownie Pan.And we can draw the following diagram of ideal shape of Brownie Pan:We will have a study on the ideal Brownie Pan.In order to ensure the area of the pan unchanged,we can see how Brownie Pan's width changes:224'''2r r L L W rπ−=+−.............(s)To ensure the pan will not exceed the scope of the oven,which is impossible,we can get a restriction on the oven:224''2r r n L NL W r π⎛⎞−+≤⎜⎟−⎝⎠..........(t)Figure 14The ideal shape of the Brownie Pan And the distribution of the pans in the oven as follows.Figure 15The distribution of the pans in ideal shape in ovenAnd the objective function turns into:(1)s A nZ p p N A=+−........................................................(u)By using the MATLAB as well,we know that the optimal solution isWhen p=0.75and 0.8WL=,Z can get the optimal solution,andZ=1.215Taking that the oven has two racks into account ,all of the above data required to be multiplied by a expansion of the coefficient α=2,which has no influence on the relative difference among different shape.5Optimization of the modelIn the optimized design above,we consider that the Brownie Pans can only be placed in a row in the oven.Next,we intend to expand the previously conclusion.And we consider that the Brownie Pans can be placed in N rows in the oven.5.1Firstly,for rectangular Brownie PansFigure 16The placement of rectangular Brownie Pan in the ovenAt this point,we know that:the specifications of Brownie pan is:L W N M×It’s obvious that the Brownie Pan optimization function does not change,which still is:**(1)(1)**ss A A M N Z p p p p M N A A =+−=+− (v)Namely max 1Z =.5.2Secondly,for round Brownie Pans,we divide the extended the oven into threeparts,which is as follows:Figure 17The zoning figure of the extended ovenThe reasons why we adopt the above area dividing method are based on the following two considerations:1.To Simplify the calculation;2.To take advantage of the inequality (r)above.And we can obtain constraint condition of circular are as follows:1.Region 1:the number of the circulars is1([1)([]1)W Ln d d=−×−...........................................(w)Notes:[]tan W Ws ds for the Gauss number ofd d2.Region 2:We assume the number of the circulars is n 2and the constraint condition is(21n L −≤..............................(x)Notes:L L =',d dWW W )1(['−−=3.Region 2:We assume the number of the circulars is n 3and the constraint condition is(31'n L −≤....................(y)Notes:d n L L 1''−=,d n W 1''=and it’s obvious that max 1Z <5.3Thirdly,for Brownie Pans in theoretical optimal shapeFigure18The arrangement of Brownie Pans in theoretical optimal shape in the oven It’s obvious that in the oven that can arrange multi-row Brownie Pans the optimal solution keeps unchanged.Namely,Z f=Z=1.215From all above,we can know that the Brownie Pan in the theoretical optimal shape can get greater optimal solution than either rectangular pans or round pans.So it’s a smart idea to choose a Brownie Pan in the theoretical optimal shape to cook your Brownie cakes!6References[1]Lars Mönch Robert Unbehaun You In Choung,Minimizing Earliness–Tardiness on a Single Burn-in Oven with a Common due Date and Maximum Allowable Tardiness Constraint, /static/pdf/374/art%253A10.1007%252Fs00291-005-0013-4.pdf?aut h66=1360982955_54758b58d2754d71008329400df3c11e&ext=.pdf,10Dec.2005[2]K.Venkateshmurthy&K.S.M.S.Raghavarao,Analysis of Modes of Heat Transfer in Baking Indian Rice Pan Cake(Dosa,)a Breakfast Food, /static/pdf/517/art%253A10.1007%252Fs13197-010-0204-0.pdf?aut h66=1360983288_e6bf23e753296afd9fcd43eea80dad4a&ext=.pdf,06Dec.2010[3]Jiang Qiyuan and Xie Jinxing,Mathematical model Mathematical programming model,3rd edn, Mathematical Modeling,Accessed Feb.2003[4]D.Pitts et al,Schaum's Outline of Theory and Problems of Heat Transfer,2nd edn,Science Press,2002[5]M.N.Aoqi Sigg,Heat Conduction,Higher Education Press,1984A dvertising sheet:AppendixFigure3Distribution of temperature of rectangular pan199.5198.5Figure4Distribution of temperature of circular panFigure5Distribution of temperature of oval pan。
数学建模竞赛优秀大学生论文

数学建模竞赛优秀大学生论文随着科学技术的高速发展,数学的应用价值越来越得到众人的重视,因此数学建模也被逐渐的引起重视了。
下面是店铺为大家整理的数学建模优秀论文,供大家参考。
数学建模优秀论文篇一:《数学建模用于生物医学论文》1数学建模的过程1.1模型准备首先要了解实际背景,寻找内在规律,形成一个比较清晰的轮廓,提出问题。
1.2模型假设在明确目的、掌握资料的基础上,抓住问题的本质,舍弃次要因素,对实际问题做出合理的简化假设。
1.3模型建立在所作的假设条件下,用适当的数学方法去刻画变量之间的关系,得出一个数学结构,即数学模型。
原则上,在能够达到预期效果的基础上,选择的数学方法应越简单越好。
1.4模型求解建模后要对模型进行分析、求解,求解会涉及图解、定理证明及解方程等不同数学方法,有时还需用计算机求数值解。
1.5模型分析、检验、应用模型的结果应当能解释已存的现象,处理方法应该是最优的决策和控制方案,所以,对模型的解需要进行分析检验。
把求得的数学结果返回到实际问题中去,检验其合理性。
如果理论结果符合实际情况,那么就可以用它来指导实践,否则需再重新提出假设、建模、求解,直到模型结果与实际相符,才能进行实际应用。
总之,数学建模是一项富有创造性的工作,不可能用一些条条框框的规则规定的十分死板,只要是能够做到全面兼顾、能抓住问题的本质、最终检验结果合理,都是一个好的数学模型。
2数学建模在生物医学中的应用2.1DNA序列分类模型DNA分子是遗传信息存储的基本单位,许多生命科学中的重大问题都依赖于对这种特殊分子的深入了解。
因此,关于DNA分子结构与功能的问题,成为二十一世纪最重大的课题之一。
DNA序列分类问题是研究DNA分子结构的基础,它常用的方法是聚类分析法。
聚类分析是使用数据建模简化数据的一种方法,它将数据分成不同的类或者簇,同一个簇中的数据有很大的同质性,而不同的簇中的数据有很大的相异性。
在对DNA序列进行分类时,需首先引入样品变量,比如说单个碱基的丰度、两碱基丰度之比等;然后计算出每条DNA序列的样品变量值,存入到向量中;最后根据相似度度量原理,计算出所有序列两两之间的Lance与Williams距离,依据距离的远近进行分类。
2013美国大学生数学建模竞赛论文
summaryOur solution paper mainly deals with the following problems:·How to measure the distribution of heat across the outer edge of pans in differentshapes and maximize even distribution of heat for the pan·How to design the shape of pans in order to make the best of space in an oven·How to optimize a combination of the former two conditions.When building the mathematic models, we make some assumptions to get themto be more reasonable. One of the major assumptions is that heat is evenly distributedwithin the oven. We also introduce some new variables to help describe the problem.To solve all of the problems, we design three models. Based on the equation ofheat conduction, we simulate the distribution of heat across the outer edge with thehelp of some mathematical softwares. In addition, taking the same area of all the pansinto consideration, we analyze the rate of space utilization ratio instead of thinkingabout maximal number of pans contained in the oven. What’s more, we optimize acombination of conditions (1) and (2) to find out the best shape and build a function toshow the relation between the weightiness of both conditions and the width to lengthratio, and to illustrate how the results vary with different values of W/L and p.To test our models, we compare the results obtained by stimulation and our models, tofind that our models fit the truth well. Yet, there are still small errors. For instance, inModel One, the error is within 1.2% .In our models, we introduce the rate of satisfaction to show how even thedistribution of heat across the outer edge of a pan is clearly. And with the help ofmathematical softwares such as Matlab, we add many pictures into our models,making them more intuitively clear. But our models are not perfect and there are someshortcomings such as lacking specific analysis of the distribution of heat across theouter edge of a pan of irregular shapes. In spite of these, our models can mainlypredict the actual conditions, within reasonable range of error.For office use onlyT1 ________________T2 ________________T3 ________________T4 ________________ Team Control Number18674 Problem Chosen AFor office use only F1 ________________ F2 ________________ F3 ________________ F4 ________________2013 Mathematical Contest in Modeling (MCM) Summary Sheet(Attach a copy of this page to your solution paper.)Type a summary of your results on this page. Do not includethe name of your school, advisor, or team members on this page.The Ultimate Brownie PanAbstractWe introduce three models in the paper in order to find out the best shape for the Brownie Pan, which is beneficial to both heat conduction and space utility.The major assumption is that heat is evenly distributed within the oven. On the basis of this, we introduce three models to solve the problem.The first model deals with heat distribution. After simulative experiments and data processing, we achieve the connection between the outer shape of pans and heat distribution.The second model is mainly on the maximal number of pans contained in an oven. During the course, we use utility rate of space to describe the number. Finally, we find out the functional relation.Having combined both of the conditions, we find an equation relation. Through mathematical operation, we attain the final conclusion.IntroductionHeat usage has always been one of the most challenging issues in modern world. Not only does it has physic significance, but also it can influence each bit of our daily life. Likewise,space utilization, beyond any doubt, also contains its own strategic importance. We build three mathematic models based on underlying theory of thermal conduction and tip thermal effects.The first model describes the process and consequence of heat conduction, thus representing the temperature distribution. Given the condition that regular polygons gets overcooked at the corners, we introduced the concept of tip thermal effects into our prediction scheme. Besides, simulation technique is applied to both models for error correction to predict the final heat distribution.Assumption• Heat is distributed evenly in the oven.Obviously, an oven has its normal operating temperature, which is gradually reached actually. We neglect the distinction of temperature in the oven and the heating process, only to focus on the heat distribution of pans on the basis of their construction.Furthermore, this assumption guarantees the equivalency of the two racks.• Thermal conductivity is temperature-invariant.Thermal conductivity is a physical quantity, symbolizing the capacity of materials. Always, the thermal conductivity of metal material usually varies with different temperatures, in spite of tiny change in value. Simply, we suppose the value to be a constant.• Heat flux of boundaries keeps steady.Heat flux is among the important indexes of heat dispersion. In this transference, we give it a constant value.• Heat conduction dom inates the variation of temperature, while the effects ofheat radiation and heat convection can be neglected.Actually, the course of heat conduction, heat radiation and heat convectiondecide the variation of temperature collectively. Due to the tiny influence of other twofactors, we pay closer attention to heat conduction.• The area of ovens is a constant.I ntroduction of mathematic modelsModel 1: Heat conduction• Introduction of physical quantities:q: heat fluxλ: Thermal conductivityρ: densityc: specific heat capacityt: temperature τ: timeV q : inner heat sourceW q : thermal fluxn: the number of edges of the original polygonsM t : maximum temperaturem t : minimum temperatureΔt: change quantity of temperatureL: side length of regular polygon• Analysis:Firstly, we start with The Fourier Law:2(/)q gradt W m λ=- . (1) According to The Fourier Law, along the direction of heat conduction, positionsof a larger cross-sectional area are lower in temperature. Therefore, corners of panshave higher temperatures.Secondly, let’s analyze the course of heat conduction quantitatively.To achieve this, we need to figure out exact temperatures of each point across theouter edge of a pan and the variation law.Based on the two-dimension differential equation of heat conduction:()()V t t t c q x x y yρλλτ∂∂∂∂∂=++∂∂∂∂∂. (2) Under the assumption that heat distribution is time-independent, we get0t τ∂=∂. (3)And then the heat conduction equation (with no inner heat source)comes to:20t ∇=. (4)under the Neumann boundary condition: |W s q t n λ∂-=∂. (5)Then we get the heat conduction status of regular polygons and circles as follows:Fig 1In consideration of the actual circumstances that temperature is higher at cornersthan on edges, we simulate the temperature distribution in an oven and get resultsabove. Apparently, there is always higher temperature at corners than on edges.Comparatively speaking, temperature is quite more evenly distributed around circles.This can prove the validity of our model rudimentarily.From the figure above, we can get extreme values along edges, which we callM t and m t . Here, we introduce a new physical quantity k , describing the unevennessof heat distribution. For all the figures are the same in area, we suppose the area to be1. Obviously, we have22sin 2sin L n n n ππ= (6) Then we figure out the following results.n t M t m t ∆ L ksquare 4 214.6 203.3 11.3 1.0000 11.30pentagon 5 202.1 195.7 6.4 0.7624 8.395hexagon 6 195.7 191.3 4.4 0.6204 7.092heptagon 7 193.1 190.1 3.0 0.5246 5.719octagon 8 191.1 188.9 2.2 0.4551 4.834nonagon 9 188.9 187.1 1.8 0.4022 4.475decagon 10 189.0 187.4 1.6 0.3605 4.438Table 1It ’s obvious that there is negative correlation between the value of k and thenumber of edges of the original polygons. Therefore, we can use k to describe theunevenness of temperature distribution along the outer edge of a pan. That is to say, thesmaller k is, the more homogeneous the temperature distribution is.• Usability testing:We use regular hendecagon to test the availability of the model.Based on the existing figures, we get a fitting function to analyze the trend of thevalue of k. Again, we introduce a parameter to measure the value of k.Simply, we assume203v k =, (7) so that100v ≤. (8)n k v square 4 11.30 75.33pentagon 5 8.39 55.96hexagon 6 7.09 47.28heptagon 7 5.72 38.12octagon 8 4.83 32.23nonagon9 4.47 29.84 decagon 10 4.44 29.59Table 2Then, we get the functional image with two independent variables v and n.Fig 2According to the functional image above, we get the fitting function0.4631289.024.46n v e -=+.(9) When it comes to hendecagons, n=11. Then, v=26.85.As shown in the figure below, the heat conduction is within our easy access.Fig 3So, we can figure out the following result.vnActually,2026.523tvL∆==.n ∆t L k vhendecagons 11 187.1 185.8 1.3 0.3268 3.978 26.52Table 3Easily , the relative error is 1.24%.So, our model is quite well.• ConclusionHeat distribution varies with the shape of pans. To put it succinctly, heat is more evenly distributed along more edges of a single pan. That is to say, pans with more number of peripheries or more smooth peripheries are beneficial to even distribution of heat. And the difference in temperature contributes to overcooking. Through calculation, the value of k decreases with the increase of edges. With the help of the value of k, we can have a precise prediction of heat contribution.Model 2: The maximum number• Introduction of physical quantities:n: the number of edges of the original polygonsα: utility rate of space• Analysis:Due to the fact that the area of ovens and pans are constant, we can use the area occupied by pans to describe the number of pans. Further, the utility rate of space can be used to describe the number. In the following analysis, we will make use of the utility rate of space to pick out the best shape of pans. We begin with the best permutation devise of regular polygon. Having calculated each utility rate of space, we get the variation tendency.• Model Design:W e begin with the scheme which makes the best of space. Based on this knowledge, we get the following inlay scheme.Fig 4Fig 5According to the schemes, we get each utility rate of space which is showed below.n=4 n=5 n=6 n=7 n=8 n=9 n=10 n=11 shape square pentagon hexagon heptagon octagon nonagon decagon hendecagon utility rate(%)100.00 85.41 100.00 84.22 82.84 80.11 84.25 86.21Table 4Using the ratio above, we get the variation tendency.Fig 6 nutility rate of space• I nstructions:·The interior angle degrees of triangles, squares, and regular hexagon can be divided by 360, so that they all can completely fill a plane. Here, we exclude them in the graph of function.·When n is no more than 9, there is obvious negative correlation between utility rate of space and the value of n. Otherwise, there is positive correlation.·The extremum value of utility rate of space is 90.69%,which is the value for circles.• Usability testing:We pick regular dodecagon for usability testing. Below is the inlay scheme.Fig 7The space utility for dodecagon is 89.88%, which is around the predicted value. So, we’ve got a rather ideal model.• Conclusion:n≥), the When the number of edges of the original polygons is more than 9(9 space utility is gradually increasing. Circles have the extreme value of the space utility. In other words, circles waste the least area. Besides, the rate of increase is in decrease. The situation of regular polygon with many sides tends to be that of circles. In a word, circles have the highest space utility.Model 3: Rounded rectangle• Introduction of physical quantities:A: the area of the rounded rectanglel: the length of the rounded rectangleα: space utilityβ: the width to length ratio• Analysis:Based on the combination of consideration on the highest space utility of quadrangle and the even heat distribution of circles, we invent a model using rounded rectangle device for pans. It can both optimize the cooking effect and minimize the waste of space.However, rounded rectangles are exactly not the same. Firstly, we give our rounded rectangle the same width to length ratio (W/L) as that of the oven, so that least area will be wasted. Secondly, the corner radius can not be neglected as well. It’ll give the distribution of heat across the outer edge a vital influence. In order to get the best pan in shape, we must balance how much the two of the conditions weigh in the scheme.• Model Design:To begin with, we investigate regular rounded rectangle.The area224r ar a A π++= (10) S imilarly , we suppose the value of A to be 1. Then we have a function between a and r :21(4)2a r r π=+--(11) Then, the space utility is()212a r α=+ (12) And, we obtain()2114rαπ=+- (13)N ext, we investigate the relation between k and r, referring to the method in the first model. Such are the simulative result.Fig 8Specific experimental results arer a ∆t L k 0.05 0.90 209.2 199.9 9.3 0.98 9.49 0.10 0.80 203.8 196.4 7.4 0.96 7.70 0.15 0.71 199.6 193.4 6.2 0.95 6.56 0.20 0.62 195.8 190.5 5.3 0.93 5.69 0.25 0.53 193.2 189.1 4.1 0.92 4.46Table 5According to the table above, we get the relation between k and r.Fig 9So, we get the function relation3.66511.190.1013r k e -=+. (14) After this, we continue with the connection between the width to length ratioW Lβ=and heat distribution. We get the following results.krFig 10From the condition of heat distribution, we get the relation between k and βFig 11And the function relation is4.248 2.463k β=+ (15)Now we have to combine the two patterns together:3.6654.248 2.463(11.190.1013)4.248 2.463r k e β-+=++ (16)Finally, we need to take the weightiness (p) into account,(,,)()(,)(1)f r p r p k r p βαβ=⋅+⋅- (17)To standard the assessment level, we take squares as criterion.()(,)(1)(,,)111.30r p k r p f r p αββ⋅⋅-=+ (18) Then, we get the final function3.6652(,,)(1)(0.37590.2180)(1.6670.0151)1(4)r p f r p p e rββπ-=+-⋅+⋅++- (19) So we get()()3.6652224(p 1)(2.259β 1.310)14r p f e r r ππ--∂=-+-+∂⎡⎤+-⎣⎦ (20) Let 0f r∂=∂,we can get the function (,)r p β. Easily,0r p∂<∂ and 0r β∂>∂ (21) So we can come to the conclusion that the value of r decreases with the increase of p. Similarly, the value of r increases with the increase of β.• Conclusion:Model 3 combines all of our former analysis, and gives the final result. According to the weightiness of either of the two conditions, we can confirm the final best shape for a pan.• References:[1] Xingming Qi. Matlab 7.0. Beijing: Posts & Telecom Press, 2009: 27-32[2] Jiancheng Chen, Xinsheng Pang. Statistical data analysis theory and method. Beijing: China's Forestry Press, 2006: 34-67[3] Zhengshen Fan. Mathematical modeling technology. Beijing: China Water Conservancy Press, 2003: 44-54Own It NowYahoo! Ladies and gentlemen, please just have a look at what a pan we have created-the Ultimate Brownie Pan.Can you imagine that just by means of this small invention, you can get away of annoying overcookedchocolate Brownie Cake? Pardon me, I don’t want to surprise you, but I must tell you , our potential customers, that we’ve made it! Believing that it’s nothing more than a common pan, some people may think that it’s not so difficult to create such a pan. To be honest, it’s not just a simple pan as usual, and it takes a lot of work. Now let me show you how great it is. Here we go!Believing that it’s nothing more than a common pan, some people may think that it’s not so difficult to create such a pan. To be honest, it’s not just a simple pan as usual, and it takes a lot of work. Now let me show you how great it is. Here we go!Maybe nobody will deny this: when baked in arectangular pan, cakes get easily overcooked at thecorners (and to a lesser extent at the edges).But neverwill this happen in a round pan. However, round pansare not the best in respects of saving finite space in anoven. How to solve this problem? This is the key pointthat our work focuses on.Up to now, as you know, there have been two factors determining the quality of apan -- the distribution of heat across the outer edge of and thespace occupied in an oven. Unfortunately, they cannot beachieved at the same time. Time calls for a perfect pan, andthen our Ultimate Brownie Pan comes into existence. TheUltimate Brownie Pan has an outstandingadvantage--optimizing a combination of the two conditions. As you can see, it’s so cute. And when you really begin to use it, you’ll find yourself really enjoy being with it. By using this kind of pan, you can use four pans in the meanwhile. That is to say you can bake more cakes at one time.So you can see that our Ultimate Brownie Pan will certainly be able to solve the two big problems disturbing so many people. And so it will! Feel good? So what are you waiting for? Own it now!。
2013全国数模竞赛A题优秀论文祥解
2013高教社杯全国大学生数学建模竞赛编号专用页赛区评阅编号(由赛区组委会评阅前进行编号):全国统一编号(由赛区组委会送交全国前编号):全国评阅编号(由全国组委会评阅前进行编号):车道被占用对城市道路通行能力的影响摘要本文主要研究车道被占用对城市道路通行能力的影响并建立了相应的数学模型。
针对问题一,考虑到交通信号灯的周期,我们选择1分钟为周期,结合不同车辆的标准车当量的折算系数,求出每个采样点的交通量,通过MATLAB作图,从定性方面对道路通行能力进行分析,然后通过基本通行能力和4个修正系数建立动态通行能力的模型。
图像显示,事故发生后(采样点5附近),实际通行能力下降至一个较低水平,并且横断面处的实际能力变化过程呈先下后上的波形变化,在事故解决(第20个采样点)以后,由图像看出实际通行能力持续上升。
针对问题二,利用问题一建立的模型,结合视频二,比较交通事故所占不同车道时横断面的实际通行能力,可以发现二者实际通行能力变化趋势大致相同,但视频二实际通行能力大于视频一实际通行能力。
可见占用车流量大的车道使道路通行能力降低更多。
针对问题三,首先我们建立单车道排队车辆数目的积分模型,单个车道的滞留车辆为上游车流量和实际通行能力的差值。
我们以30s为一个时间段,对视频一中的车流量进行统计,得到横截面处每个监测段的实际通行能力。
本题要求考虑三车道,总体排队长度不容易通过积分模型确定,所以我们将队列长度问题转化为车辆数目问题,通过视频资料统计120米对应24辆车,据此关系转换,从而得到车辆排队长度与事故横断面实际通行能力、事故持续时间和上游车流量的关系。
针对问题四,在对问题3研究的基础上,根据问题3建立的数学模型,建立起某一段时间间隔车辆排队的长度,然后,通过求得的关系得到当排队长度为140m的时候所对应的时间段,由于每段时间间隔设为30s,因此,可以求得排队长度到达上游时用的时间为347.7273s。
关键词:交通事故车道占用通行能力排队论一、问题的重述车道被占用是指因交通事故、路边停车、占道施工等因素,导致车道或道路横断面通行能力在单位时间内降低的现象。
优秀的数学建模论文范文(通用8篇)
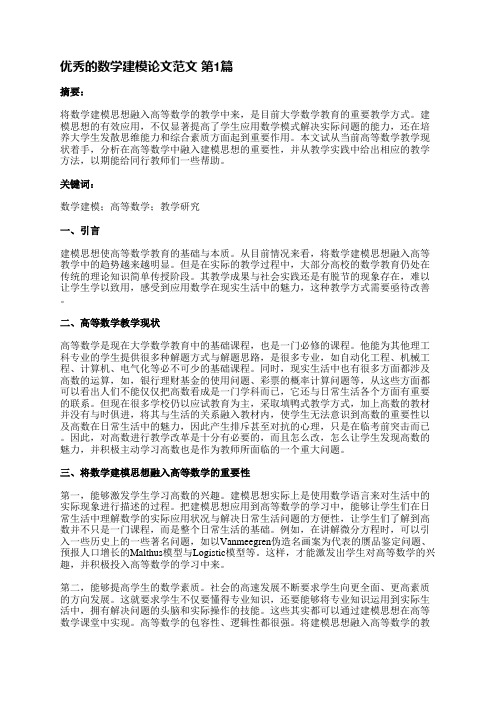
优秀的数学建模论文范文第1篇摘要:将数学建模思想融入高等数学的教学中来,是目前大学数学教育的重要教学方式。
建模思想的有效应用,不仅显著提高了学生应用数学模式解决实际问题的能力,还在培养大学生发散思维能力和综合素质方面起到重要作用。
本文试从当前高等数学教学现状着手,分析在高等数学中融入建模思想的重要性,并从教学实践中给出相应的教学方法,以期能给同行教师们一些帮助。
关键词:数学建模;高等数学;教学研究一、引言建模思想使高等数学教育的基础与本质。
从目前情况来看,将数学建模思想融入高等教学中的趋势越来越明显。
但是在实际的教学过程中,大部分高校的数学教育仍处在传统的理论知识简单传授阶段。
其教学成果与社会实践还是有脱节的现象存在,难以让学生学以致用,感受到应用数学在现实生活中的魅力,这种教学方式需要亟待改善。
二、高等数学教学现状高等数学是现在大学数学教育中的基础课程,也是一门必修的课程。
他能为其他理工科专业的学生提供很多种解题方式与解题思路,是很多专业,如自动化工程、机械工程、计算机、电气化等必不可少的基础课程。
同时,现实生活中也有很多方面都涉及高数的运算,如,银行理财基金的使用问题、彩票的概率计算问题等,从这些方面都可以看出人们不能仅仅把高数看成是一门学科而已,它还与日常生活各个方面有重要的联系。
但现在很多学校仍以应试教育为主,采取填鸭式教学方式,加上高数的教材并没有与时俱进,将其与生活的关系融入教材内,使学生无法意识到高数的重要性以及高数在日常生活中的魅力,因此产生排斥甚至对抗的心理,只是在临考前突击而已。
因此,对高数进行教学改革是十分有必要的,而且怎么改,怎么让学生发现高数的魅力,并积极主动学习高数也是作为教师所面临的一个重大问题。
三、将数学建模思想融入高等数学的重要性第一,能够激发学生学习高数的兴趣。
建模思想实际上是使用数学语言来对生活中的实际现象进行描述的过程。
把建模思想应用到高等数学的学习中,能够让学生们在日常生活中理解数学的实际应用状况与解决日常生活问题的方便性,让学生们了解到高数并不只是一门课程,而是整个日常生活的基础。
2013年五一数学建模联赛 A题论文
图 1 男女大学生体重指数一览表
人数
体重指数一览表
800
712
700
600 500
475
400
300
200 100
10264 38
237 183157 26
0
7267 5
低体重者
正常体重者
超重者
四类人群
肥胖者
学生数 男生数 女生数
2
4.2.3 结果与分析
对照表 1 及相关的频数表,反映出大学生 BMI 指数基本正常,正常体重人群相对集
关键词: 独立样本 t 检验 方差检验 K-S 检验 模糊综合评价 SPSS
一 问题重述
据数据显示,近年来中国大学生的体质健康水平呈下降趋势。学生或者过重或者过 瘦,对大学生体质健康的评价问题对于如何提高大学生的体质健康水平具有指导意义。
根据对某高校大一新生 36 个班级共 1000 多名学生进行的体质与健康测试,得到了 一组相关资料,由于测试过程中学生未能按照要求规范测试,导致测量结果中出现一些 偏差,进而影响了体质健康的测试,请结合各项测试评分标准,回答下列问题: 问题 1:影响大一新生的体质健康状况的因素很多,体重是体现体质健康状况的重要指 标,分析体重对体质健康的影响;在体质健康测试中,测试结果可能存在误差,在附表 1 中,有些测量资料不能反映同学的真实水平,根据附表 1 数据,请建立数学模型检验 测试结果的正确性和准确性,找出附表 1 中 1、2、3 班同学的可能偏差测试结果,并说 明理由。 问题 2:生源地是影响体质健康状况的因素,请在不同生源地选取适当的样本,试检验 不同地区学生的体能健康是否具有显著差别。 问题 3:目前,我国体能测试主要采用《国家体质健康标准》对学生体质进行评价,根 据附表 2 中(男生:sheet1;女生:sheet2)项目评价标准,试建立体质健康评价模型, 评价该校学生的体质健康状况,并对 1 班的 30 名同学进行体质健康评价。 问题 4:我国大多数高校学生体质健康合格率未达到国家要求,对于未达标的大一新生 来说,就如何让学生在在校期间提高自身的体质健康写一份建议报告书,其中包括提高 体质健康水平的措施和手段,如何量化提高体质健康指标等问题。
2013美国数学建模A题优秀论文
终极布朗尼烤烤盘一、摘要根据题意,我们把把要解决的分成三个问题;第一个就是建立一个模型来表示整个烤盘的外边缘热量的分布。
第二个就是优化组合题目中条件1和条件2,使得权重p和(1- p)能够描述随着W/L和p值的改变,最佳的烤烤盘形状和热量分布情况是如何改变的第三个问题就是为布朗尼美食家杂志准备一到两页的宣传广告,需要突出设计和结果。
对于第一个问题,我们结合傅里叶定律构建了二维热传导模型;然后通过模型中的S来限定范围得到六种不同形状烤盘对应的热传导偏微分方程。
然后对模型赋值和第二类边界条件(Neumann边界条件)下,应用comsol得出六种烤盘稳定热量分布图像和烤盘外边缘热量分布图像。
通过输出的图像,我们得出结论:矩形四角处温度较高,圆形外边缘热量分布比较均匀;随着烤盘边数的增加,烤盘外边缘热量分布愈加均匀,但在角处温度仍然会高一些对于问题二对于问题三关键词:二、问题重述当用一个长方形的平底烤盘(盘)烘烤时,热量被集中在4个角,在角落处,食物可能被烤焦了,而边缘处烤的不够熟。
在一个圆形的平底烤盘(盘)热量被均匀地分布在整个外边缘,在边缘处食物不会被烤焦。
但是,大多数的烤箱的形状是矩形的,采用了圆形的烤盘(盘)相对于烤箱的使用空间而言效率不高。
为所有形状的烤盘(盘)----包括从矩形到圆形以及中间的形状,建立一个模型来表示整个烤盘(盘)的外边缘热量的分布。
假设:1. 形状是矩形的烤箱宽长比为W/L;2. 每个烤烤盘(盘)的面积为A;3. 每个烤箱最初只有两个均匀放置的烤架。
根据以下条件,建立一个能使用的最佳类型或形状的烤烤盘(盘):1.放入烤箱里的烤烤盘(盘)数量的最大值为(N);2.烤烤盘(盘)的平均分布热量最大值为(H);3.优化组合条件1和条件2,使得权重p和(1- p)能够描述随着W/L和p值的改变,最佳的烤烤盘形状和热量分布情况是如何改变的。
除了完成规定的解决方案,为布朗尼美食家杂志准备一到两页的宣传广告,需要突出你的设计和结果。
2013年美国大学生数学建模大赛A题 一等奖
最终的布朗尼蛋糕盘Team #23686 February 5, 2013摘要Summary/Abstract为了解决布朗尼蛋糕最佳烤盘形状的选择问题,本文首先建立了烤盘热量分布模型,解决了烤盘形态转变过程中所有烤盘形状热量分布的问题。
又建立了数量最优模型,解决了烤箱所能容纳最大烤盘数的问题。
然后建立了热量分布最优模型,解决了烤盘平均热量分布最大问题。
最后,我们建立了数量与热量最优模型,解决了选择最佳烤盘形状的问题。
模型一:为了解决烤盘形态转变过程中所有烤盘形状热量分布的问题,我们假设烤盘的任意一条边为半无限大平板,结合第三边界条件下非稳态导热公式,建立了不同形状烤盘的热量分布模型,模拟出不同形状烤盘热量分布图。
最后得到结论:在烤盘由多边形趋于圆的过程中,烤焦的程度会越来越小。
模型二:为了解决烤箱所能容纳最大烤盘数的问题,本文建立了随烤箱长宽比变化下的数量最优模型。
求解得到烤盘数目N 随着烤箱长宽比和烤盘边数n 变化的函数如下:AL W L W cont cont cont N 4n2nsin 1222⎪⎭⎫ ⎝⎛⎥⎥⎥⎦⎤⎢⎢⎢⎣⎡⎪⎪⎭⎫ ⎝⎛+⋅--=π模型三:本文定义平均热量分布H 为未超过某一温度时的非烤焦区域占烤盘边缘总区域的百分比。
为了解决烤盘平均热量分布最大问题,本文建立了热量分布最优模型,求解得到平均热量分布随着烤箱长宽比和形状变化的函数如下:n sin n cos -n 2nsin 22ntan1H ππδπδπ⎪⎪⎪⎪⎪⎭⎫⎝⎛⎪⎭⎫ ⎝⎛⋅-=A结论是:当烤箱长宽比为定值时,正方形烤盘在烤箱中被容纳的最多,圆形烤盘的平均热量分布最大。
当烤盘边数为定值时,在长宽比为1:1的烤箱中被容纳的烤盘数量最多,平均热量分布H 最大。
模型四:通过对函数⎪⎭⎫ ⎝⎛n ,L W N 和函数⎪⎭⎫⎝⎛n ,L W H 作无量纲化处理,结合各自的权重p 和()p -1,本文建立了数量和热量混合最优模型,得到烤盘边数n 随p值和LW的函数。
2013高教社杯全国大学生数学建模竞赛A题论文.
2013高教社杯全国大学生数学建模竞赛承诺书我们仔细阅读了《全国大学生数学建模竞赛章程》和《全国大学生数学建模竞赛参赛规则》(以下简称为“竞赛章程和参赛规则”,可从全国大学生数学建模竞赛网站下载)。
我们完全明白,在竞赛开始后参赛队员不能以任何方式(包括电话、电子邮件、网上咨询等)与队外的任何人(包括指导教师)研究、讨论与赛题有关的问题。
我们知道,抄袭别人的成果是违反竞赛章程和参赛规则的,如果引用别人的成果或其他公开的资料(包括网上查到的资料),必须按照规定的参考文献的表述方式在正文引用处和参考文献中明确列出。
我们郑重承诺,严格遵守竞赛章程和参赛规则,以保证竞赛的公正、公平性。
如有违反竞赛章程和参赛规则的行为,我们将受到严肃处理。
我们授权全国大学生数学建模竞赛组委会,可将我们的论文以任何形式进行公开展示(包括进行网上公示,在书籍、期刊和其他媒体进行正式或非正式发表等)。
我们参赛选择的题号是(从A/B/C/D中选择一项填写): A我们的参赛报名号为(如果赛区设置报名号的话):所属学校(请填写完整的全名):吉林医药学院参赛队员(打印并签名) :1. 于邦文2. 薛盈军3. 杨国庆指导教师或指导教师组负责人(打印并签名):霍俊爽(论文纸质版与电子版中的以上信息必须一致,只是电子版中无需签名。
以上内容请仔细核对,提交后将不再允许做任何修改。
如填写错误,论文可能被取消评奖资格。
)日期: 2013 年 9 月 16 日赛区评阅编号(由赛区组委会评阅前进行编号):2013高教社杯全国大学生数学建模竞赛编号专用页赛区评阅编号(由赛区组委会评阅前进行编号):全国统一编号(由赛区组委会送交全国前编号):全国评阅编号(由全国组委会评阅前进行编号):车道被占用对城市道路通行能力的影响摘要本文通过对城市中车道因交通事故被占用问题的分析,探讨了事故所处道路横断面的实际通行能力的变化过程,并依据事故路段车辆排队长度与实际通行能力、事故持续时间、路段上游车辆流量之间的关系,最后针对各个问题建立模型并求解。
- 1、下载文档前请自行甄别文档内容的完整性,平台不提供额外的编辑、内容补充、找答案等附加服务。
- 2、"仅部分预览"的文档,不可在线预览部分如存在完整性等问题,可反馈申请退款(可完整预览的文档不适用该条件!)。
- 3、如文档侵犯您的权益,请联系客服反馈,我们会尽快为您处理(人工客服工作时间:9:00-18:30)。
4 17:00:07—17:00:23 16s 5 17:02:09—17:03:29 80s 根据事故发生时间和事故结束时间,知道事故发生期间有 3 段时间没有信息可用, 因此需要对缺失信息进行处理, 为了简单起见, 取平均值代替第 1 段缺失信息,16:56:00 以后缺失时间较多,舍弃这些时间的数据。 对于统计数据的规则,取事故发生横断面中间为准线,作垂直于道路的直线(实际 统计是用眼估计此直线位置) ,从 16:43:00 开始每 30s 统计通过直线(车身一半经过此 直线的车算通过此直线)的小轿车、电动车(包括自行车) 、公交车的数量,到 16:56:00 结束,共 26 组数据。 4.2.2 标准车当量数 查阅相应参考文献 [1] ,得到小轿车,电动车,公交车转化成标准车当量系数为 1,0.5,1.5.统计出现事故之后每隔 30s 交通事故发生的横截面处出现的小轿车,电动车 和公交车的数量,并根据如下所示的公式计算: (4.1) C ' =+ si1 0.5si 2 + 1.5si 3 式中 C ' 表示标准车当量数, si1 , si 2 , si 3 表示第 i 个时刻小轿车,电瓶车和公交车的数量 得到标准车当量数如下所示: 表 2:部分交通事故横截面各种车辆数及标准车当量数记录表 小轿车 电动车 公交车 标准车当量数 7 0 2 10 6 2 2 10 ⋮ ⋮ ⋮ ⋮ 6 3 1 9 10 0 0 10 9 5 0 11.5 4.2.3 交通事故发生前后横断面标准车当量数 统计事故发生前的道路的小轿车,电动车和公交车,并根据式(*)计算相应的结 果,得到如下所示的表格: 表 3:事故前后基本通行能力记录表 事故前基本通行能力(pcu/30s) 9.5 9.7 9.8 事故后基本通行能力(pcu/30s) 18 18.1 4.3 模型的建立 4.3.1 基本通行能力[2] 基本通行能力是在理想道路交通条件下通行能力,其理论值可以由如下所示的公式 表达: 3600 (4.2) CB = t + 7.2 (la + lb ) / (254ϕ ) 计算得到,其中的 t 为驾驶员反应时间, ϕ 为轮胎与路面间的附着系数, la 为车辆 间最小安全停车间隙, lb 为车辆平均长度。由于按照以上公式得到的计算结果远小于实 际观察得到的最大交通量, 因此美国和日本关于基本通行能力的规定值来源于实际观测 结果,因此,用实际交通事故发生处横断面上的单位时间通过的标准车辆数代替基本通 行能力。
C n
电动车数 公交车数 实际通行能力 可用车道数 驾驶员总体特征影响修正系数 横向干扰修正系数 可能通行能力 事故发生处到路口距离修正系数 服务水平比值 横向干扰系数影响力 车道宽度影响力 临界速度 稳定性 差异度 实际交通能力差异度 稳定性差异度
意义 车辆密度 排队长度 通行量 堵塞密度 道路堵塞密度 畅通速度 两小区路口的综合车流量 上游截面车流量
3
辆 辆 pcu/h 个
η
f CP
fl
α
S1 S2
V
ωi
B P T
符号
P
L Q
Pmax
0 Pmax
单位 pcu/m m pcu pcu/km pcu/km km/h pcu/h pcu/h
vf
E (t) QU (t)
QD (t) N (t)
拥堵处截面车流量 上下游流量差的累和 扩散速度 退化系数
pcu/h pcu/h km/h —
赛区评阅记录(可供赛区评阅时使用): 评 阅 人 评 分 备 注
全国统一编号(由赛区组委会送交全国前编号):
全国评阅编号(由全国组委会评阅前进行编号):
车道占用对城市道路通行能力影响
摘要
车道占用将改变道路的通行能力,对城市交通秩序产生影响。本文建立数学模型, 就事故发生车道、 发生位置和堵车类型等因素定量分析车道占用对城市道路实际通行能 力的影响。 针对第一问,首先统计上下游路段通行量并换算成标准车当量,并引入实际问题修 正系数,建立横截面实际通行能力动态模型,利用 matlab 编程计算,绘制交通事故横 断面实际通行能力变化曲线, 得到事故处理中事故点处通行能力为 16.8pcu/min,事故发 生 3min 后开始出现堵塞。然后对小区路口车流量和车道宽度进一步分析,得到小区路 口车流量与横断面通行能力不相关,以及横向干扰和车道宽度增加一个等级,通行能力 分别平均下降 5.6%和 28%。 针对第二问,用相同方法处理视频二中数据,定义实际通行能力差异度和稳定性差 异度,建立基于差异度的不同占道横断面通行能力差异模型。求解得到占用 2、3 车道 对实际通行能力的影响比占用 1、2 车道大 6.9%。对车辆取向比较分析,得到公交车主 要在 2,3 车道行驶,车道占用率为 42%和 58%,对车流速度分析,得到事故发生在 2,3 车道公交车速度减少量比事故发生在 1,2 车道速度减少量大 1.21m/s,得出小轿车速度 对发生事故的车道位置比公交车更敏感。 针对第三问,由守恒公式和交通波理论,推导 2 种适应范围不同的排队长度估算公 式构成道路拥堵排队长度估算模型。模型显示完全堵塞时,排队长度与上下游截面车流 量之差对时间积分值成正比;不完全堵塞时,排队长度与上下游截面车流密度之和对时 间积分值成正比。利用附件一中数据对模型进行检验,得到两公式估算值与实际值的关 联度分别为 0.79、0.68,模型估算结果良好。然后分析车道最优车流密度,得到该道路 需将车流密度控制在 44.9pcu/km 以下,并对上游车流量作敏感性分析,得到当上游车流 量增大 10%时,平均队伍长度增加 57%。 针对第四问,首先对第三问模型进行匹配修改,估算上游路口和事故截断面车流量 随时间变化的函数关系式和相关参数,考虑红绿灯的周期性影响,得到排队长度预测模 型。用 matlab 软件解得 5min 33s 后排队长度将到达上游路口,队伍长度平均增长速度 为 22m/min。 然后对上游路口红绿灯周期进行敏感性分析, 得到队伍长度达到 140m 的耗 时与红绿灯周期负相关。 最后,给出了模型的优缺点和改进方案。
我们参赛选择的题号是(从 A/B/C/D 中选择一项填写) : 我们的参赛报名号为(如果赛区设置报名号的话) : 所属学校(请填写完整的全名) : 参赛队员 (打印并签名) :1. 2. 3. 指导教师或指导教师组负责人 华中科技大学 黄小敏 黄程 王露 (打印并签名):
A 13241002
指导教师组
2013 高教社杯全国大学生数学建模竞赛
承
诺
书
我们仔细阅读了《全国大学生数学建模竞赛章程》和《全国大学生数学建模竞赛参 赛规则》 (以下简称为 “竞赛章程和参赛规则” , 可从全国大学生数学建模竞赛网站下载) 。 我们完全明白,在竞赛开始后参赛队员不能以任何方式(包括电话、电子邮件、网 上咨询等)与队外的任何人(包括指导教师)研究、讨论与赛题有关的问题。 我们知道,抄袭别人的成果是违反竞赛章程和参赛规则的,如果引用别人的成果或 其他公开的资料(包括网上查到的资料) ,必须按照规定的参考文献的表述方式在正文 引用处和参考文献中明确列出。 我们郑重承诺,严格遵守竞赛章程和参赛规则,以保证竞赛的公正、公平性。如有 违反竞赛章程和参赛规则的行为,我们将受到严肃处理。 我们授权全国大学生数学建模竞赛组委会,可将我们的论文以任何形式进行公开展 示(包括进行网上公示,在书籍、期刊和其他媒体进行正式或非正式发表等) 。
(论文纸质版与电子版中的以上信息必须一致,只是电子版中无需签名。以上内容 请仔细核对,提交后将不再允许做任何修改。如填写错误,论文可能被取消评奖资格。) 日期: 2013 年 9 月 16 日
赛区评阅编号(由赛区组委会评阅前进行编号):
2013 高教社杯全国大学生数学建模竞赛
编 号 专 用 页
赛区评阅编号(由赛区组委会评阅前进行编号):
关键词: 实际通行能力
差异度
交通波
排队长度预测
1
1、问题重述
1.1 背景 车道占用发生的原因有很多,根据城市道路交通流密度大,连续性强的特点,一旦 发生车道占用,将降低路段所有车道的通行能力,引起道路阻塞,影响居民的出行。正 确估计车道占用对城市交通的影响程度将为交通管理部门的决策提供理论依据。 1.2 需要解决的问题 根据附件所示的内容,考察处于同一路段同一横断面发生的两个交通事故,研究以 下的问题: (1)根据视频 1(附件 1) ,描述视频中交通事故发生至撤离期间,事故所处横断 面实际通行能力变化过程。 (2)根据问题 1 所得结论,结合视频 2(附件 2) ,分析说明同一横断面交通事故 所占车道不同对该横断面实际通行能力影响的差异。 (3)构建数学模型,分析视频 1(附件 1)中交通事故所影响的路段车辆排队长度 与事故横断面实际通行能力,事故持续时间,路段上车流量之间的关系。 (4)假如视频 1(附件 1)中的交通事故所处的横断面距离上游路口变为 140 米。 路段下游方向需求不变, 路段上游车流量为 1500pcu/h,事故发生时车辆初始排队长度为 零,且事故持续不撤离。请估算,从事故发生开始,经过多长时间,车辆排队长度将到 达上游路口。
ω η
注:未列出符号及重复的符号以出现处为准
4、问题一的建模与求解
4.1 问题分析 根据附件一视频,统计上游路口及事故发生横截面处小轿车,电瓶车,公交车的数 量,查找车辆换算系数,计算得到道路基本交通能力,作为一个侧面,反映道路的实际 通行能力大小。 实际通行能力不仅受到车道数量,道路基本交通能力的影响,还受到交通环境的影 响,实际计算时,需要引入相应的修正系数反映交通环境的不同。根据统计得到的公交 车出现的频数,计算重型车辆修正系数,通过查找参考文献,确定其他参数。 实际中,道路的服务水平也将影响实际通行能力,而这个水平是由最大服务量和实 际通行能力的比值来确定的。查找相关的文献,确定比值应取为 1,最终,得到横截面 实际通行能力动态模型,根据计算结果,分析交通事故发生和疏散时实际通行能力的变 化状况,得出结论。 问题一的流程图如下所示: