RNAsoft a suite of RNA secondary structure prediction and design software tools
如何改善RNA提取质量

如何改善RNA提取质量1.在收获组织及细胞死亡之后,应立即灭活内源的RNA酶,以防止RNA降解。
以下3个方法均可有效使内源RNA酶失活:1)用含离液(如胍盐)的细胞裂解液收获样品,并立即匀浆。
2)用液氮瞬间冻结样品。
值得特别注意的是:组织块必须保证足够小,在浸入液氮的瞬间就能冻结,以确保瞬间令RNA酶失活3)立即将样品置于RNAlater? Tissue Collection: RNA Stabilization Solut ion中。
它是一种水相、无毒的收集试剂,能立即稳定并保护完整、未冻结的组织和细胞样品中的RNA。
关键要点是组织样品切片一定要够薄(<0.5 cm),这样RNAlater才能在RNase破坏RNA之前迅速渗入组织块中。
2.使用正确的细胞或组织储存条件在样品用液氮瞬间冻结之后,应该储存在-80°C,千万不能解冻。
即使是置于含有胍盐的裂解液中作匀浆前的短暂解冻,也会导致RNA的降解和损失。
瞬间冻结的组织应该首先在超低温条件下先研磨成粉,然后置于裂解液中进行匀浆。
RNAlater使样品储存更为便利。
储存在RNAlater中的细胞或组织可在室温下稳定保存长达1个星期,在4°C可稳定保存长达1个月,或永久保存在-20°C。
有关RNAlater的更多信息请参考/techlib/resources/RNAlat er.3.彻底匀浆样品细胞或组织的彻底匀浆对RNA提取来说,是一个很关键的步骤,它能够防止RNA 的损失和降解。
匀浆的方法应根据细胞或组织的类型来选择。
大部分培养的细胞可以置于细胞裂解液中,通过简单的涡旋震荡来匀浆;而动物组织、植物组织、酵母和细菌则常常需要更加剧烈的方法。
比如说细菌的细胞壁,就需要酶消化来实现彻底的细胞裂解和RNA的最大回收。
有关各种不同的样本类型,哪些方法是最适合的匀浆方法,请参考/techlib/tb/tb_183.html.4.在RNA提取之前预处理样品裂解液对于某些样品来说,在匀浆之后,RNA提取之前,还需要一些额外的处理步骤。
qRT-PCR of Small RNAs
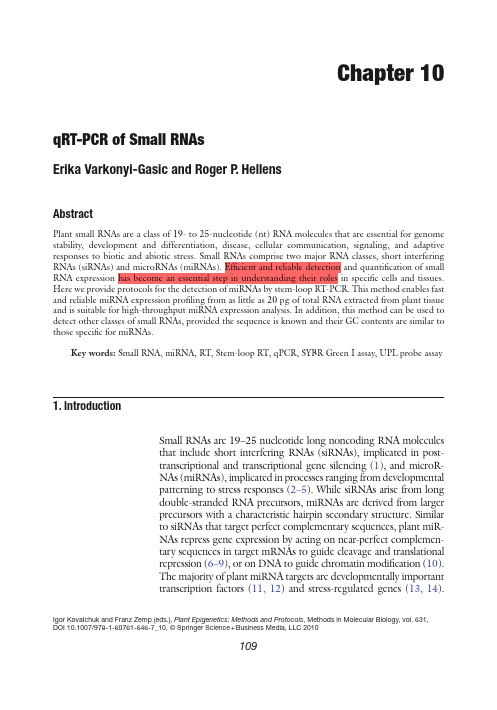
Chapter 10qRT-PCR of Small RNAsErika Varkonyi-Gasic and Roger P. HellensAbstractPlant small RNAs are a class of 19- to 25-nucleotide (nt) RNA molecules that are essential for genome stability, development and differentiation, disease, cellular communication, signaling, and adaptive responses to biotic and abiotic stress. Small RNAs comprise two major RNA classes, short interfering RNAs (siRNAs) and microRNAs (miRNAs). Efficient and reliable detection and quantification of small RNA expression has become an essential step in understanding their roles in specific cells and tissues. Here we provide protocols for the detection of miRNAs by stem-loop RT-PCR. This method enables fast and reliable miRNA expression profiling from as little as 20 pg of total RNA extracted from plant tissue and is suitable for high-throughput miRNA expression analysis. In addition, this method can be used to detect other classes of small RNAs, provided the sequence is known and their GC contents are similar to those specific for miRNAs.Key words: Small RNA, miRNA, RT, Stem-loop RT, qPCR, SYBR Green I assay, UPL probe assay 1. I ntroductionSmall RNAs are 19–25 nucleotide long noncoding RNA moleculesthat include short interfering RNAs (siRNAs), implicated in post-transcriptional and transcriptional gene silencing (1), and microR-NAs (miRNAs), implicated in processes ranging from developmentalpatterning to stress responses (2–5). While siRNAs arise from longdouble-stranded RNA precursors, miRNAs are derived from largerprecursors with a characteristic hairpin secondary structure. Similarto siRNAs that target perfect complementary sequences, plant miR-NAs repress gene expression by acting on near-perfect complemen-tary sequences in target mRNAs to guide cleavage and translationalrepression (6–9), or on DNA to guide chromatin modification (10).The majority of plant miRNA targets are developmentally importanttranscription factors (11, 12) and stress-regulated genes (13, 14).Igor KovaIchuk and Franz Zemp (eds.), Plant Epigenetics: Methods and Protocols,Methods in Molecular Biology,vol. 631,DOI 10.1007/978-1-60761-646-7_10, © Springer Science + Business Media, LLC 2010109110Varkonyi-Gasic and HellensDue to the miRNA action, these targets are either eliminated completely during cell-fate changes (12, 15, 16), or are reduced to appropriate levels of expression in tissues, where both the miRNA and the target mRNA are co-expressed (17, 18). In addition, a pos-sible long-distance signaling role was proposed for some miRNAs (19, 20), in contrast to miRNAs with demonstrated cell-autonomous expression and effects (21, 22).This complexity in miRNA modes of action demonstrates that reliable detection and quantification of miRNA expression in spe-cific tissues is an essential first step for better understanding of miRNA-mediated gene regulation. Although miRNAs represent a relatively abundant class of transcripts, their expression levels can vary dramatically between cells and tissues and they often escape detection by conventional technologies such as cloning, northern hybridization, and microarray analysis because of low abundance combined with high complexity of the small RNA population in plants (11, 23). High sensitivity and specificity of reverse transcription-polymerase chain reaction (RT-PCR) detec-tion methods provide a superior detection and quantification method over the conventional technologies. Stem-loop reverse transcription primers were shown to provide better specificity and sensitivity than linear primers (24), and a pulsed reverse transcrip-tion (RT) reaction further increases the sensitivity of miRNA detection (25). These features were utilized to derive a two-step miRNA detection method. First, the stem-loop RT primer is hybridized to the miRNA molecule and then reverse transcribed in a pulsed RT reaction. Next, the RT product is amplified using a miRNA-specific forward primer and the universal reverse primer. The product can be visualized by gel-electrophoresis upon a set number of PCR cycles or monitored in real-time using a SYBR Green I assay or a UPL probe assay that involves a dual labeled hydrolysis probe to increase specificity (Fig. 1).In addition to expression analysis of endogenous miRNAs, this method is amenable for the detection and quantification of other small RNAs, including artificial miRNAs and synthetic siRNAs.1. Plant tissue collected into liquid nitrogen and handled accord-ing to standard practices to prevent degradation of RNA.1. TRIzol reagent for isolation of total RNA (Invitrogen, Carlsbad, CA) (see Note 1).2. Solutions listed in the TRIzol protocol: chloroform, isopro-panol, 75% ethanol, water to resuspend the RNA pellet (see Note 2).2. M aterials2.1. Plant Material 2.2. Isolation and Gel-Electrophoresis of RNA111qRT -PCR of Small RNAs3. 12.3 M formaldehyde-containing 1% agarose gel. CAUTION: Formaldehyde is toxic through skin contact and inhalation of vapours. Manipulations involving formaldehyde should be done in a chemical fume hood.5’-UGACAGAAGAGAGUGAGCAC-3’5’-UGACAGAAGAGAGUGAGCAC GTTGGCTCTGGTGC 3’-CTCGTG CAaccgagacCACG A G G G T C C G A G GT A T T C 5’-GTTGGCTCTGGTGC 3’-CTCGTG CAaccgagacCACG A G G G T C C G A G G T A T TC5’-UGACAGAAGAGAGUGAGCACGTTGGCTCTGGTGC 3’-ACTGTCTTCTCTCACTCGTG CAaccgagacCACG A G G G T C CG A G G T A T T C CAaccgagacCACGCTTATGGAGCCTGGGACGTGGTCTCGGTTG-5’5’-GCGGCGG TGACAGAAGAGAGT-3’miR156stem-loop RT primer forward primer 5’-GCGGCGG TGACAGAAGAGAGT-3’3’-ACTGTCTTCTCTCACTCGTG CAaccgagacCACGCTTATGGAGCCTGGGACGTGGTCTCGGTTG-5’3’-ACTGTCTTCTCTCACTCGTG CAaccgagacCACGCTTATGGAGCCTGGGACGTGGTCTCGGTTG-5’5’-GCGGCGG TGACAGAAGAGAGTGAGCAC GTTGGCTCTGGTGCGAATACCTCGGACCCTGCACCAGAGCCAAC-3’by the quenching label 5’-GCGGCGG TGACAGAAGAGAGTGAGCAC GTTGGCTCTGGTGCGAATACCTCGGACCCTGCACCAGAGCCAAC-3’3’-CGCCGCC ACTGTCTTCTCTCACTCGTG CAaccgagacCACGCTTATGGAGCCTGGGACGTG-5’5’-tggctctg-3’+5’-GTGCAGGGTCCGAGGT-3’3’-ACTGTCTTCTCTCACTCGTG CAaccgagacCACGCTTATGGAGCCTGGGACGTGGTCTCGGTTG-5’5’-GCGGCGG TGACAGAAGAGAGTGAGCAC GTTGGCTCTGGTGCGAATACCTCGGACCCTGCACCAGAGCCAAC-3’3’-TGGAGCCTGGGACGTG-5’5’-GCGGCGG TGACAGAAGAGAGTGAGCAC GTTGGCTCTGGTGCGAATACCTCGGACCCTGCACCAGAGCCAAC-3’3’-CGCCGCC F 5’-tggctctg-3’Q 3’-CGCCGCC “unquenched”signal universal reverse primerSYBR Green I21435687910RTPCR UPLprobe SYBR Green I Fig. 1. Schematic showing the primer design and RT-qPCR process using the example of miR156. A stem-loop RT primer binds to the 3¢ portion of the miRNA, initiating reverse transcription. Then, the RT product is amplified using a miRNA specific forward primer and the universal reverse primer. Quantification is achieved either through SYBR Green I incorporation during amplification, or by the fluorescence generated upon cleavage of the UPL probe. Sequences related to miR156 are presented in grey. Sequences related to UPL probe #21 are in lower case. (1) Annealing, (2) Pulsed RT, (3) Denaturation,(4) Annealing, (5) Extension, (6) Denaturation, (7) Annealing, (8) Extension, (9) Hybridisation, (10) Cleavage112Varkonyi-Gasic and Hellens4. 10× MOPS buffer: 0.4 M MOPS, pH 7.0, 0.1 M sodium acetate, 0.01 M EDTA.5. Formaldehyde Load Dye (Ambion, Austin, TX).6. Ethidium bromide to final 10 m g/ml. CAUTION: Ethidium bromide is a strong mutagen and should be handled with extreme care .7. Molecular weight markers, e.g. 0.5–10 Kb RNA Ladder (Invitrogen). 1. Stem-loop RT primers. Prepare 100 m M stocks for long-term storage and 1 m M dilutions for immediate use. 2. 10 mM dNTP mix. Prepare by mixing dATP, dCTP, dGTP, and dCTP stock solutions, aliquot out and store at −20°C. 3. Reverse transcriptase, e.g. SuperScript III RT, 200 units/m l that is supplied with the First-Strand buffer for cDNA synthesis and 0.1 M DTT (Invitrogen). 4. RNase inhibitor such as RNaseOUT, 40 units/m l (Invitrogen). 5. Nuclease free water, e.g. UltraPure DEPC-treated Water (Invitrogen). 1. LightCycler FastStart SYBR Green I master mix (Roche Diagnostics, Mannheim, Germany), prepared according to manufacturer’s instructions. 2. Universal reverse primer. Prepare 100 m M stock for long-term storage and 10 m M dilution for immediate use. 3. Forward miRNA-specific primer. Prepare 100 m M stock for long-term storage and 10 m M dilution for im mediate use. 4. 10 mM dNTP mix as above. 5. Nuclease free water. 1. LightCycler TaqMan master mix (Roche Diagnostics) prepared according to manufacturer’s instructions. 2. UPL probe #21 prepared as 10 m M stock (Roche Diagnostics). 3. Universal reverse oligo. Prepare 100 m M stock for long-term storage and 10 m M dilution for immediate use. 4. Forward miRNA-specific oligonucleotide. Prepare 100 m M stock for long-term storage and 10 m M dilution for immediate use. 5. 10 mM dNTP mix as above. 6. Nuclease free water. 1. Standard laboratory equipment for isolation of RNA (fume hood, centrifuge, tubes, pipettes, and tips).2.3. Stem-LoopedPulsed ReverseTranscription2.4. qPCR2.4.1. miRNA SYBR GreenAssay2.4.2. miRNA UPL ProbeAssay2.5. Equipment113qRT -PCR of Small RNAs 2. A spectrophotometer for quantification of RNA, e.g. NanoDrop ND-1000 Spectrophotometer (NanoDrop Technologies, Wilmington, DE) (see Note 3).3. Standard gel electrophoresis equipment (casting trays, gel tanks, power supply, UV transilluminator).4. A thermal cycler for pulsed reverse transcription. Our reverse transcription reactions and end-point PCR analyses were per-formed on the Mastercycler (Eppendorf, Hamburg, Germany).5. A real-time thermal cycler for qPCRs. All our real-time PCR anal-yses were performed on LightCycler 1.5 (Roche Diagnostics).The primers are designed according to Chen et al. (24) with some modifications (26) (Fig. 1). The stem-loop RT primers have a universal backbone and a specific extension. The universal back-bone sequence is as follows:5¢-GTTGGCTCTG GTGCAGGGTCCGAGGT ATTCGCACcagagccaAC-3¢.This backbone sequence can form a stem-loop structure because of the complementarity between the nucleotides in the 5¢ and 3¢ end; it includes the reverse complement of the UPL probe #21 (in lower case) and the universal reverse primer site in the loop region (in bold).The specificity of a stem-loop RT primer to an individual miRNA is conferred by a six-nucleotide extension at the 3¢ end; this extension is a reverse complement of the last six-nucleotides at the 3¢ end of the miRNA. In an miR156 example, the miRNA sequence is as follows (last six nucleotides are underlined):5¢-UGACAGAAGAGAGUGAGCAC-3¢.Thus, the miR156 stem-loop RT primer sequence is as fol-lows (last six nucleotides that provide specificity are underlined):5¢-GTTGGCTCTG GTGCAGGGTCCGAGGT ATTC GCACcagagccaACGTGCTC-3¢.Forward primers are specific to the miRNA sequence but exclude the last six nucleotides at the 3¢ end of the miRNA. A 5¢ extension of 5–7 nucleotides is added to each forward primer to increase the length and the melting temperature; these sequences were chosen randomly and are relatively GC-rich, bringing the GC content of the forward primer to 50–60%. In an miR156 example, the forward primer sequence is as follows (the GC-rich 5¢ extension is underlined):5¢-GCGGCGGTGACAGAAGAGAGT-3¢.3. M ethods3.1. Primer Design114Varkonyi-Gasic and HellensWe provide an example of a method for isolation, quantification, and evaluation of RNA. Other methods may be used (see Notes 1–3). 1. Isolate RNA from the plant tissue snap-frozen in liquid nitrogen using the TRIzol reagent, according to manufacturer’s instructions. 2. Determine concentration by spectrophotometric analysis. Use an aliquot (200 ng–1 m g) to assess quality by gel electro-phoresis. Store the remaining RNA on ice or at −20°C. 3. Determine RNA quality by gel-electrophoresis. Prepare the gel by heating 1 g agarose in 72 ml water until dissolved, and then cool slightly. Add 10 ml 10× MOPS running buffer and mix. Add 18 ml 37% formaldehyde (12.3 M). If required, top up with water to 100 ml. Pour the gel and wait until set. 4. Assemble the gel in the tank. Add 1× MOPS running buffer to cover the gel by a few millimetres. 5. Prepare the RNA sample by adding 3× volumes Formaldehyde Load Dye to 200 ng–1 m g RNA. Add ethidium bromide to the Formaldehyde Load Dye at a final concentration of 10 µg/ml. 6. Prepare the molecular weight marker in the same manner. 7. Heat denature samples at 65°C for 5–15 min. Load the gel and electrophorese at 5–6 V/cm. 8. Stop the run when the bromophenol blue dye has migrated as far as 70% of the length of the gel. 9. Visualize the RNA on a UV transilluminator. High quality RNA will have clearly visible rRNA bands. 10. Adjust RNA concentration with nuclease free water to 20 ng/m l.The most reproducible results are obtained with 2–20 ng of total RNA per reaction, but abundant miRNAs can be detected from as little as 20 pg of total RNA. The protocol is designed to evalu-ate expression of a specific miRNA in a large number of samples or expression of a large number of miRNAs in one sample. If test-ing many RNA samples for one miRNA, prepare a “no RNA” master mix; if testing for many different miRNAs in one sample, prepare a “no RT primer” master mix. Include 10% excess to cover pipetting errors. At least three replicates per RT reaction are recommended. Also prepare “minus RT” controls by omit-ting reverse transcriptase from the reactions and “no template” controls by adding nuclease-free water in place of RNA. It is important to keep the reactions on ice and work in the cold room if handling large number of samples. 1. Prepare the “no RNA” master mix by scaling the volumes for an individual RT reaction to the desired number of RT reactions. Prepare an individual reaction by adding the following compo-nents to a nuclease-free microcentrifuge tube:3.2. Isolation andGel-Electrophoresisof RNA3.3. Stem-Loop PulsedReverse TranscriptionProtocol3.3.1. RT Reaction WhenTesting Many RNASamples for One miRNA115qRT -PCR of Small RNAs 0.5 m l 10 mM dNTP mix,11.15 m l nuclease-free water and1 m l of appropriate stem-loop RT primer (1 m M). 2. Heat mixture to 65°C for 5 min and incubate on ice for2 min. 3. Centrifuge briefly to bring solution to the bottom of the tube. 4. Add the following:4 m l 5× First-Strand buffer,2 m l 0.1 M DTT,0.1 m l RNaseOUT (40 units/m l) and 0.25 m l SuperScript III RT (200 units/m l). 5. Mix gently and centrifuge to bring solution to the bottom of the tube. 6. Assemble the RT reaction by aliquoting 19 m l of the “no RNA” master mix and adding 1 m l RNA template (see Note 4). 7. Mix gently and centrifuge to bring solution to the bottom of the tube. 1. Prepare the “no RT primer” master mix by scaling the volumes for an individual RT reaction to the desired number of RT reactions. Prepare an individual reaction by adding the follow-ing components to a nuclease-free microcentrifuge tube:0.5 m l 10 mM dNTP mix,11.15 m l nuclease-free water and 1 m l of appropriate RNA template (see Note 4). 2. Add the following:4 ml 5× First-Strand buffer,2 ml 0.1 M DTT,0.1 ml RNaseOUT (40 units/ml) and 0.25 ml SuperScript III RT (200 units/m l). 3. Mix gently and centrifuge to bring solution to the bottom of the tube. 4. Assemble the RT reaction by aliquoting 19 m l of the “no RT primer” master mix and adding 1 m l of appropriate stem-loop RT primer (1 m M) previously denatured by heating to 65°C for 5 min. 5. Mix gently and centrifuge to bring solution to the bottom of the tube. 1. Load thermal cycler and incubate for 30 min at 16°C, followed by pulsed RT of 60 cycles at 30°C for 30 s, 42°C for 30 s and 50°C for 1 s.2. Incubate at 85°C for 5 min to inactivate the reverse transcriptase.3.3.2. RT Reaction WhenTesting One RNA Samplefor Many miRNAs3.3.3. Pulsed RT Reaction116Varkonyi-Gasic and HellensProtocols are provided for the SYBR Green I Assay and the UPL probe assay. SYBR Green I assay provides good specificity, if the number of PCR cycles is limited to the maximum of 35 to mini-mize nonspecific amplification. At this number of cycles, highly and moderately abundant miRNAs can be easily quantified (Fig. 2). For miRNA sequences that are expressed at low levels or when a particular set of primers produces background amplification, the UPL probe assay provides higher specificity (Fig. 3).3.4. qPCR Fig. 2. The sensitivity of the stem-loop RT-PCR assay. (a ) RT-PCR analysis of miR159 expression visualized on agarose gel stained with ethidium bromide. Very little non-specific amplification was detected with negative control reactions (−RT, minus RT, and NTC, “no template” control) at 35 cycles. The amount of RNA used for reverse transcrip-tion reactions are indicated on the top. PCR cycle numbers are indicated on the left. Size markers are indicated on the right. (b ) qPCR analysis of the same sample using the SYBR Green I assay at 35 cycles117qRT -PCR of Small RNAs 1. Prepare 5× LightCycler FastStart SYBR Green I master mix(Roche Diagnostics) according to manufacturer’s instructions.2. Prepare a PCR master mix by scaling the volumes listed below to the desired number of amplification reactions. Include 10% excess to cover pipetting errors. For a single reaction, add the following components to a nuclease-free microcentrifuge tube:12 m l nuclease-free water4 m l SYBR Green I master mix 3.4.1. miRNA SYBR Green IAssay Fig. 3. Improved specificity of the miRNA UPL probe assay. (a ) SYBR Green I assay PCR for miR166. Negative control reactions (−RT, minus RT, and NTC, “no template” control) produced detectable amplicons after 40 cycles. (b ) UPL probe assay PCR for miR166. No fluorescence was detected in the negative control reactions after 45 cycles. (c ) UPL probe assay amplification products for miR166 separated by gel electrophoresis on 4% agarose, showing specific and nonspecific amplification products above, below and in the size-range of specific products, obtained after 45 cycles of PCR. Arrowhead indi-cates the expected size of specific amplicons118Varkonyi-Gasic and Hellens1 m l forward (miRNA specific) primer (10 m M) and 1 m l reverse (universal) primer (10 m M) 3. Mix gently and centrifuge to bring solution to the bottom of the tube. 4. Store in cooling block or on ice. 5. Place required number of LightCycler capillaries in precooled centrifuge adapters. 6. Pipette 18 m l master mix into each LightCycler capillary. 7. Add2 m l RT product. 8. Seal each capillary with a stopper. 9. Place capillaries into the LightCycler carousel and spin in the carousel centrifuge. 10. Incubate the samples at 95°C for 5 min, followed by 35–40 cycles of 95°C for 5 s and 60°C for 10 s. 11. For melting curve analysis, denature samples at 95°C, then cool to 65°C at 20°C per second. Collect fluorescence signals at 530 nm wavelength continuously from 65°C to 95°C at 0.2°C per second. 1. Prepare 5× LightCycler TaqMan master mix (Roche Diagnostics)according to manufacturer’s instructions. 2. Prepare a PCR master mix by scaling the volumes listed below to the desired number of amplification reactions. Include 10% excess to cover pipetting errors. For a single reaction, add the following components to a nuclease-free microcentrifuge tube:11.8 m l nuclease-free water,4 m l TaqMan master mix,1 m l forward (miRNA specific) primer (10 m M) and1 m l reverse (universal) primer (10 m M) and0.2 m l UPL probe #21 (10 m M).3. Mix gently and centrifuge to bring solution to the bottom of the tube.4. Store in cooling block or on ice.5. Place required number of LightCycler capillaries in precooled centrifuge adapters.6. Pipette 18 m l master mix into each LightCycler capillary.7. Add 2 m l RT product.8. Seal each capillary with a stopper.9. Place capillaries into the LightCycler carousel and spin in the carousel centrifuge.10. Incubate samples at 95°C for 5 min, followed by 35–45 cycles of 95°C for 5 s and 60°C for 10 s.3.4.2. miRNA UPL ProbeAssay119qRT -PCR of Small RNAs The qPCR data can be analysed and presented as absolute or relative values. Relative quantification is the preferred method because it takes into account the potential errors due to variation in RNA input and RT efficiency. The most accurate method to correct these potential errors is normalization to endogenous control genes. An ideal endogenous control generally demonstrates gene expression that is relatively constant and highly abundant across tissues and cell-types. In addition, a suitable control for normalization of miRNA expression would have similar properties to miRNAs in terms of size and stability and would be amenable to the miRNA assay design. Some classes of small noncoding RNAs (ncRNAs) other than miRNAs are often expressed in an abundant and stable manner. Several human and mouse snRNAs and snoRNAs were tested across the range of tissues and experimental conditions and confirmed as suitable endogenous controls for quantification of miRNA expression levels (Applied Biosystems). No such analysis was performed with plant tissues yet, and a large-scale study is required to evaluate suitability of different plant ncRNAs for miRNA quantification. Therefore, plant researchers have to select a set of controls individually and screen under appropriate conditions or select a specific miRNA that demonstrates the least variability across tissues or experimental conditions under consideration. Either way, the consistency of expression should be confirmed under the specific conditions of the experiment (see Note 5).Here, we provide general instructions for data analysis using the LightCycler Software 4.05. If using a different instrument or software, refer to the appropriate instrument user manual for instructions on how to analyze data.1. This analysis is done after the SYBR Green I Assay to deter-mine that each of the primer pairs amplified a single predomi-nant product with a distinct melting temperature (Tm).2. Follow the instrument user manual for instructions forMelting Curve Analysis and Tm calling. 3. If a single melting peak is observed for a particular primer pair, itis likely that a single product with a distinct Tm was amplified. 4. Evaluate by gel-electrophoresis (see Note 6).1. Relative Quantification analysis compares two ratios: the ratioof the target gene to a reference gene sequence in an unknown sample is compared with the ratio of the same two sequences in a standard sample called a Calibrator. 2. To perform relative quantification with an external standard,prepare standard curves for the target and reference genes by serial dilutions of external standards with a known copy num-ber (see Note 7). Use at least three points or one point per log of concentration, whichever is greater. Always use a “no template” control.3.5. Data Analysis3.5.1. Melting Curve Analysis3.5.2. Relative Quantification120Varkonyi-Gasic and Hellens3. Prepare master mix and perform qPCR as described above.Use at least three replicates per standard dilution and “notemplate” control.4. Follow the instrument user manual for instructions for theStandard Method that will automatically calculate and displaythe amplification curves and the standard curve, crossingpoints, calculated concentrations, and statistics for replicates.5. Save as an external standard curve object.6. Perform Relative quantification, Calibrator normalized, with-out efficiency correction: select Relative Quantification –Monocolor Analysis, assign a “Target Calibrator” and a“Reference Calibrator” sample, assign appropriate pairs oftarget and reference samples and perform analysis followingthe instrument user manual (see Note 8).7. Perform efficiency correction by applying an external stan-dard curve.8. Download data and present as graphs or tables.4. N otes1. Whenever possible, we used the TRIzol Reagent for isolationof RNA because of its convenience, good RNA quality andspeed. Some plant tissues may not be amenable to isolation ofRNA by this method. Other methods for isolation of RNAmay be used; however, avoid RNA purification methods thatuse RNA-binding glass-fibre filters that do not recover smallRNA species quantitatively (e.g. Qiagen RNeasy mini andmidi kits). If unfamiliar with the method for isolation of RNA,subsequent isolation, quantification, and polyacrylamide gelelectrophoresis of the low molecular weight RNA fractioncan be used to evaluate its quantity and quality.2. RNA should be handled according to standard laboratorypractices to avoid RNase contamination. All buffers and solu-tions should be nuclease-free.3. Spectrophotometry followed by gel electrophoresis is still themost widely used method for assessing the RNA yield, purity,and quality. Fluorometry (e.g. RiboGreen, Molecular Probes)can also be used to determine yield, and microfluidic systems(such as Agilent’s bioanalyzer chips) can be used to deter-mine yield and quality.4. In our hands, both nondenatured RNA and RNA denaturedby incubation at 65°C for 5 min produced similar results.However, it has been suggested that denaturation of RNAmay reduce the yield of cDNA for some miRNAs.121qRT-PCR of Small RNAs5. In general, evaluation of endogenous controls involvesdemonstration of relatively abundant and relatively constantexpression levels across the tissues and environmental condi-tions, compared with the RNA input and expression of otherhousekeeping genes.6. Melting curve analysis needs to be combined with gel electro-phoresis. Due to the small size of the fragment, a primer-dimer product generated form the “minus RT” and “notemplate” controls often has a very similar Tm to that of theappropriate miRNA amplification fragment. This becomes anissue with lowly abundant miRNAs that require a large num-ber of PCR amplification cycles. In that case, the UPL assay isrecommended.7. Alternatively, use a cDNA sample with the highest level oftarget expression and prepare serial dilutions.8. This method assumes that the efficiency of target and refer-ence gene amplification is identical and equal to 2 (the amountof PCR product doubles during each cycle). In reality, theefficiency is often lower because of a number of different fac-tors. Efficiency correction is required for more reliable data.The software calculates the efficiency from the slope of thestandard curve.References1. Hannon GJ (2002) RNA interference. Nature418:244–2512. Bartel DP (2004) MicroRNAs: genomics,biogenesis, mechanism, and function. Cell 116:281–2973. Bartel B, Bartel DP (2003) MicroRNAs: atthe root of plant development? Plant Physiol 132:709–7174. Mallory AC, Vaucheret H (2006) Functionsof microRNAs and related small RNAs in plants. Nat Genet 38(Suppl):S31–S365. Zhang B, Wang Q, Pan X (2007) MicroRNAsand their regulatory roles in animals and plants. J Cell Physiol 210:279–2896. Aukerman MJ, Sakai H (2003) Regulation offlowering time and floral organ identity by a MicroRNA and its APETALA2-like target genes. Plant Cell 15:2730–27417. Chen X (2004) A microRNA as a translationalrepressor of APETALA2 in Arabidopsis flower development. Science 303:2022–20258. Llave C, Xie Z, Kasschau KD, Carrington JC(2002) Cleavage of Scarecrow-like mRNA targets directed by a class of Arabidopsis miRNA. Science 297:2053–20569. Palatnik JF, Allen E, Wu X, Schommer C,Schwab R, Carrington JC et al (2003) Controlof leaf morphogenesis by microRNAs. Nature 425:257–26310. Bao N, Lye KW, Barton MK (2004)MicroRNA binding sites in Arabidopsis class III HD-ZIP mRNAs are required for methy-lation of the template chromosome. Dev Cell 7:653–66211. Llave C, Kasschau KD, Rector MA, CarringtonJC (2002) Endogenous and silencing-associ-ated small RNAs in plants. Plant Cell 14:1605–161912. Rhoades MW, Reinhart BJ, Lim LP, BurgeCB, Bartel B, Bartel DP (2002) Prediction of plant microRNA targets. Cell 110:513–520 13. Sunkar R, Zhu JK (2004) Novel and stress-regulated microRNAs and other small RNAs from Arabidopsis. Plant Cell 16:2001–2019 14. Sunkar R, Kapoor A, Zhu JK (2006)Posttranscriptional induction of two Cu/Zn superoxide dismutase genes in Arabidopsis is mediated by downregulation of miR398 and important for oxidative stress tolerance. Plant Cell 18:2051–206515. Juarez MT, Kui JS, Thomas J, Heller BA,Timmermans MC (2004) microRNA-medi-ated repression of rolled leaf1 specifies maize leaf polarity. Nature 428:84–88。
RNA抽提

反转录酶的选择
1. Money 鼠白血病病毒(MMLV)反转录酶:有强的聚合
酶活性,RNA酶H活性相对较弱。最适作用温度为37℃。 2. 禽成髓细胞瘤病毒(AMV)反转录酶:有强的聚合酶活 性和RNA酶H活性。最适作用温度为42℃。 3.Thermus thermophilus、Thermus flavus等嗜热微生物 的热稳定性反转录酶:在Mn2+存在下,允许高温反转录 RNA,以消除RNA模板的二级结构。 4.MMLV反转录酶的RNase H-突变体:商品名为 Superscript 和SuperScriptⅡ。此种酶较其它酶能多将更大 部分的RNA转换成cDNA,这一特性允许从含二级结构的、 低温反转录很困难的mRNA模板合成较长cDNA。
拷贝数的对数存在线性关系〔1〕,起始拷贝 数越多,Ct值越小。利用已知起始拷贝数的 标准品可作出标准曲线,其中横坐标代表起 始拷贝数的对数,纵坐标代Ct值。因此,只 要获得未知样品的Ct值,即可从标准曲线上 计算出该样品的起始拷贝数。
内参
是检测低丰度 mRNA 的敏感方法 ,为了去除 不同标本在 RNA的产量、质量以及逆转录效 率上可能存在的差别而获得目标基因特异性 表达的真正差异 ,通常选择一定的内参基因进 行校正和标准化。
逆转录酶(reverse transcriptase)
是依赖RNA的DNA聚合酶,至少具有以下三 种活性: 1、依赖RNA的DNA聚合酶活性:以RNA为 模板合成cDNA第一条链; 2、Rnase水解活性:水解RNA/DNA杂合体 中的RNA; 3、依赖DNA的DNA聚合酶活性:以第一条 DNA链为模板合成互补的双链cDNA.
RNA抽提、逆转录及实时荧光定量PCR
孟祥健
RNA抽提 逆转录
生物分子学英文单词

operon
操纵子
a coordinated unit of gene expression
基因表达的协同单位
cis-acting element
顺式作用元件
trans-acting factor
反式作用因子
sequence specific DNA binding protein
序列特异性DNA结合蛋白
micRNA
mRNA干扰性互补RNA
folding enzymes,foldases
折叠酶
molecular chaperone
分子伴侣
signal peptide
信号肽
plaque signal
信号斑
motif
基序
zinc finger
锌指结构
leucine zipper motif
亮氨酸拉链
domain
诱发突变
mutagen
诱发剂
mutagenesis
突变生成作用
mutant gene
突变基因
mutant
突变体
substitution
碱基置换突变
frame shift mutation
移码突变
transition
转换
transversion
颠换
synonymous mutation
同义突变
missense mutation
插入序列
inverted reprats IR
反向重复序列
IS-like elements
类插入序列
β-lactamase
β-内酰胺
activator/dissociation体系
RNA二级结构及其生物学功能研究

RNA二级结构及其生物学功能研究RNA是生命中重要的分子之一,其在基因表达和蛋白质合成的过程中发挥着重要的作用。
RNA分子的二级结构是其功能的基础,二级结构的不同构型对RNA分子的生物学功能起着决定性的作用。
本文将从RNA二级结构的基本原理和分类入手,探究RNA二级结构对其生物学功能的影响以及有助于此研究的技术手段,希望为RNA生物学界的研究提供参考。
一、RNA二级结构的基本原理RNA分子中,每个核苷酸单元均含一分子磷酸、五碳糖和一个核碱基,其结构与DNA相似。
RNA具有二级结构,即单链RNA分子在空间上折叠所形成的三维空间结构,通常表现为双链型或伸长的环型。
RNA二级结构的形成与以下两个方面密切相关:1. RNA分子内部高级结构的折叠RNA分子内部高级结构的折叠是其二级结构形成的关键。
RNA分子中的很多核苷酸是能够之间相互配对的,一般配对的方式有Watson-Crick配对、Wobble配对和GU配对等。
Watson-Crick配对是RNA中分子间较为普遍的配对方式,该配对方式基于A-U和G-C的氢键结构。
根据这种方式,A与U及C与G通过氢键作用配对。
Wobble配对是RNA分子中得以容忍的一种配对方式。
Wobble配对是指在RNA折叠时,尽管某些位置上核酸配对并不严格符合Watson-Crick配对的定义,但它们能够被RNA高级结构所容忍和稳定。
除了不符合Watson-Crick配对的基对的形成,那些不构成氢键的碱基的根部也可以产生重要的空间力位。
GU配对是RNA分子中的另一种常见的配对方式。
GU配对相比于A-U和G-C之间的配对,其氢键数目较少,引起了GU配对所形成RNA分子的稳定性较差。
因此,在RNA分子中GU配对只出现在那些需要在适当的位置处调控RNA的折叠的情形下。
2. 非配对碱基带的折叠除了配对碱基之间可以形成氢键外,非配对碱基之间也可以形成一些力位。
在RNA高级结构内的非配对残基遵循最近接原则,在RNA分子折叠以形成二级结构时,非配对碱基通过磷酸二酯桥连接在一起以形成各种具有特定三维结构的RNA结构。
RNA提取相关试剂——DEPC和TRIS
DEPC焦碳酸二乙酯(DEPC):DEPC即diethypyrocarbonate,DEPC结构式中文名为。
分子式为C6H10O5,分子量为162.14。
是一种强烈但不彻底的RNA酶抑制剂。
它通过和RNA酶的活性基团组氨酸的咪唑环结合使蛋白质变性,从而抑制酶的活性。
DEPC 可以抑制植物细胞上的NSCC,即nonselective cation channel (非选择性阳离子通道)。
是常用的NSCC抑制剂.DEPC毒性1.DEPC(diethypyrocarbonate,焦碳酸二乙酯) 是一种高效烷化剂。
配置:加0.1% DEPC 到去离子水中,混匀过夜,然后高温高压121℃,20min,DEPC即降解成二氧化碳和水无毒。
2.DEPC有刺激性,对眼睛气道粘膜有强刺激,在操作中应尽量在通风的条件下进行,DEPC毒性并不是很强,但吸入的毒性是最强的,使用时戴口罩,不小心占到手上注意立即冲洗。
3.DEPC是一种潜在的致癌物质,主要是能生成乙酯基衍生物和乙酯类衍生物,其中尿烷是一种已知的致癌物质。
DEPC水泡过一次枪头后还能再用吗?是否每次都要重配?答:不能再用。
每次处理耗材时都要用新配的。
DEPC水用于配制电泳缓冲液和溶解RNA.DEPC在水中的半衰期25℃、磷酸缓冲液中其半衰期为4 min(pH 6)、9 min(pH 7)。
Tris缓冲液中DEPC的降解会加快,25℃时,半衰期为1.25 min(pH 7.5)、0.37 min(pH 8.2)。
DEPC加入到水中之后并不会立即溶解,而是形成小的球状液滴(类似于油滴),需要彻底搅拌直至液滴消失才算混合均匀。
此时的溶液才可以拿去高温除菌除DEPC。
一般灭菌15min即可将DEPC彻底除去。
(试验所用试剂也可用DEPC处理,加入DEPC至0.1%浓度,然后剧烈振荡10分钟,再煮沸15分钟或高压灭菌以消除残存的DEPC,否则DEPC也能和腺嘌呤作用而破坏mRNA活性)配制泡实验器具的DEPC水的配制:1000ml双蒸水中加1mlDEPC,放在1000ml容量瓶中静置4小时后备用。
RNA的提取及基础知识
DEPC水DEPC是一种强烈但不彻底的RNA酶抑制剂。
它通过和RNA酶的活性基团组氨酸的咪唑环结合使蛋白质变性,从而抑制酶的活性。
DEPC是一种有效的核酸酶抑制剂,它能够与很多酶的-NH,-SH或-OH等基团发生反应,从而破坏酶的活性位点。
常用浓度为0.1%(1 L水中加入1 mL DEPC)的DEPC来作为RNA 酶的抑制剂。
DEPC气味芳香浓烈,强挥发性,有毒,需在通风橱中操作。
DEPC水:是指终浓度含0.1%DEPC的水,在1000ml双蒸水中加入DEPC原液1ml,然后摇匀(DEPC是油状的,很难和水混溶,要加转子搅两三个小时),过夜。
DEPC水可以用于RNA沉淀的溶解,含有RNA的各种反应体系如反转录、siRNA 的退火等,以及其它各种要求无RNase、DNase和proteinase的反应体系。
DEPC水一般是指千分之一浓度的DEPC,在搅拌器上搅拌至完全溶解,即看不到“油珠”为止,用来处理枪头、EP管的DEPC水不需高压灭活,而用于配制DEPC 酒精等试剂和用来这种RNA相关试验的DEPC水需灭活后使用。
经检测不含RNase、DNase和proteinase。
DEPC处理水:是指用终浓度为0.1%DEPC处理过的的水,然后高压蒸汽灭菌 121℃,灭活有毒性的DEPC(DEPC分解成二氧化碳和酒精)封闭冷藏备用。
最好分装小瓶来用,尽量避免污染。
总RNA提取[实验目的]掌握组织或细胞中RNA的提取方法及RT-PCR实验方法[实验原理]Trizol试剂是直接从细胞或组织中提取总RNA的试剂。
它在破碎和溶解细胞时能保持RNA的完整性,裂解细胞并释放出RNA,酸性条件使RNA与DNA 分离,加入氯仿后离心,样品分成水样层和有机层。
RNA存在于水样层中。
收集上面的的水样层后,RNA可以通过异丙醇沉淀来还原。
在除去水样层后,样品中的DNA和蛋白也能相继以沉淀的方式还原。
乙醇沉淀能析出中间层的DNA,在有机层中加入异丙醇能沉淀出蛋白。
高纯总 RNA 快速提取试剂盒(RLT-离心柱型) 说明书
高纯总RNA快速提取试剂盒(RLT-离心柱型)GK3091 20次GK3092 50次一.试剂盒组成Components GK3091 GK3092GenClean Column 2.0-ml Collection TubeRLT Solution aRW SolutionRPE Solution bDEPC-WaterProtocol202014ml15ml5ml2ml1copy505035ml30ml12ml4ml1copya. 在收到试剂盒后,应将RLT Solution取出存放于4ºC。
b. RPE Solution在首次使用前,必须加入4倍体积的无水乙醇。
无水乙醇必须是新开封的,保证无RNase污染。
用户自备试剂、材料:无水乙醇、70%乙醇(DEPC-H2O配制,植物和丝状真菌用)、PBS(动物细胞用)、液氮(植物和丝状真菌用)、RNase-free的Eppendorf管和Tips。
二.基本原理幼嫩组织和对数生长期的细胞生长旺盛,含有大量的RNA。
RLT Solution能使细胞裂解,释放出RNA的同时灭活RNase。
GenClean柱中的膜能选择性的与RNA结合,而蛋白等杂质不能结合,经RW Solution和RPE Solution的几步洗涤后结合在膜上的RNA用DEPC-H2O洗脱,可用于各种分子生物学实验。
三. 主要特点1. 安全,整个过程没有用酚和氯仿抽提,无须担心酚和氯仿对皮肤和呼吸道的腐蚀。
2. 纯度高,本试剂盒抽提得到的RNA样品可用于任何分子生物学操作。
3. 快速,整个抽提过程只需要20分钟。
四. 操作步骤表1 不同组织和细胞最大使用量样品最大使用量动物细胞 1x10⁷动物组织 50mg细菌 1x10⁹酵母 1x10⁷植物组织 100mg丝状真菌 100mg为获得最佳的结果,采用的样品数量一定要合适。
可以参考表1。
细胞培养物、细菌菌体、酵母以及真菌菌丝应该在对数生长期收集,动物和植物样品应该取生长旺盛的幼嫩部位。
RNA抽提详细步骤
RNA抽提指南(TRIZOL法)RNA抽提指南(TRIZOL法)注意事项:* 全程佩戴一次性手套。
皮肤经常带有细菌和霉菌,可能污染RNA的抽提并成为RNA酶的来源。
培养良好的微生物实验操作习惯预防微生物污染。
* 使用灭菌的,一次性的塑料器皿和自动吸管抽提RNA,避免使用公共仪器所导致的RNA酶交叉污染。
例如,使用RNA探针的实验室可能用RNA酶A 或T1来降低滤纸上的背景,因而某些非一次性的物品(如自动吸管)可能富含RNA酶。
* 在TRIZOL 中,RNA 是隔离在RNA 酶污染之外的。
而对样品的后续操作会要求用无RNA 酶的非一次性的玻璃器皿或塑料器皿。
玻璃器皿可以在150°C 的烘箱中烘烤4 小时。
塑料器皿可以在0.5 M NaOH 中浸泡10 分钟,用水彻底漂洗干净后高压灭菌备用。
抽提步骤:1.匀浆化作用通过离心来沉淀细胞后,弃上清,用移液管加TRIZOL试剂反复吹打来裂解细胞至均一通亮的液态后,将匀浆样品在15—30°C 条件下孵育5 分钟以使核蛋白体完全分解。
(每5—10×106的动物细胞,植物或酵母菌细胞或每1×10⁷ 细菌加1ml的TRIZOL。
在加入TRIZOL前应避免洗涤细胞因为那样会增加mRNA降解的可能性。
)2.分离阶段每1 mlTRIZOL 加0.2 ml 氯仿。
盖紧样品管盖,用手用力摇晃试管15 秒并将其在30°C 下孵育2—3 分钟。
在2—8°C 下以不超过12,000×g 的离心力高速冷冻离心15 分钟。
离心后混合物分成三层:下层红色的苯酚-氯仿层,中间层,上层无色的水样层。
RNA 无一例外地存在于水样层当中。
水样层的容量大约为所加TRIZOL 容量的60%3.RNA的沉淀将水样层转移到一干净的试管中,通过将水样层和异丙醇混合来沉淀RNA。
最初均化时的每1 m lTRIZOL 对应0.5 ml 异丙醇。
RNA提取策略以及RT-PCR
第一部分RNA 提取策略1、RNA降解的原因内源性RNAase是造成RNA降解的最重要原因,因为人体细胞自身就是几十分钟(20min?)mRNA被降解一轮,所以不管是组织还是细胞还是液体状样本在离开其中细胞的最佳生活状态后都应该尽快的被妥善的方法保存起来。
外源性RNA酶也是一个需要注意的因素,最常见的就是毛发尤其头发,灰尘,唾液,塑料手套这四个兄弟。
针对它们我们应该戴帽子,口罩,橡胶无菌手套,在清洁灰尘少的地方提取RNA。
我上面说了内源性RNAase污染才是关键,所以有些同志没有注意这些对外源性RNAase的防护RNA也提取的很出色。
但是如果你运气不太好的话外源性RNAase污染影响很大的。
2、样品的取材我们抽提RNA往往都是需要其mRNA,而mRNA的表达量和细胞或者组织的生长状态息息相关,我们取组织块应该避免取到坏死组织,而细胞我们应该在其处于生长旺盛的时期收集(贴壁细胞消化要迅速,离心要稍为快些,甚至可以不消化下来直接进入裂解步骤;此外还可以采取先震荡敲击培养瓶的方法使细胞和培养瓶的结合下降,然后用吸管吹打培养基地方法把细胞吹打下来,这样细胞的代谢不会明显的受到抑制。
注意在平时传代的时候就要注意观察细胞除了用胰酶消化下来以外是否还有其他比较简单的方法)(此外还可以把培养液倒掉后迅速的加入裂解试剂开始抽提RNA)。
3、待提取样品保存方法这些保存方法温度从4度到零下196度不等,选择哪一种保存方法关键是要对这些保存方法的优缺点有清醒的认识。
根据你需要的RNA种类可以做简单的分类。
包括RNA病毒RNA ,mRNA(各种),rRNA等其中最容易降解或者破坏的就是mRNA,最不容易损失的就是RNA病毒RNA(因为有蛋白壳保护)。
超低温保存:特指液氮保存不管组织还是细胞如果需要其中的mRNA必须在液氮中保存,-70度等方法都是错误的方法,在很短的时间内或许可以,但是长期是不可能的。
-20~~~-70摄氏度保存:RNA病毒的RNA可以在这个温度段安全的保存。
- 1、下载文档前请自行甄别文档内容的完整性,平台不提供额外的编辑、内容补充、找答案等附加服务。
- 2、"仅部分预览"的文档,不可在线预览部分如存在完整性等问题,可反馈申请退款(可完整预览的文档不适用该条件!)。
- 3、如文档侵犯您的权益,请联系客服反馈,我们会尽快为您处理(人工客服工作时间:9:00-18:30)。
RNAsoft:a suite of RNA secondary structure prediction and design software toolsMirela Andronescu,Rosalı´a Aguirre-Herna ´ndez,Anne Condon *and Holger H.Hoos Department of Computer Science,University of British Columbia,Vancouver,BC V6T 1Z4,CanadaReceived February 15,2003;Revised and Accepted April 7,2003ABSTRACTDNA and RNA strands are employed in novel ways inthe construction of nanostructures,as molecular tags in libraries of polymers and in therapeutics.New software tools for prediction and design of molecular structure will be needed in these applications.The RNAsoft suite of programs provides tools for pre-dicting the secondary structure of a pair of DNA or RNA molecules,testing that combinatorial tag sets of DNA and RNA molecules have no unwanted second-ary structure and designing RNA strands that fold to a given input secondary structure.The tools are based on standard thermodynamic models of RNA secondary structure formation.RNAsoft can be found online at http://www.RNAsoft.ca.INTRODUCTIONSoftware tools that predict the secondary structure of a DNA or RNA strand from the base sequence,such as mfold (1)and RNAfold from the Vienna RNA Package (2),are widely used to shed insight on nucleic acid structure and function.The secondary structure is the set of base pairs formed when the (single)strand folds on itself,with each base occurring in,at most,one pair.Increasingly,RNA molecules are designed for new purposes,as catalysts,probes on arrays,molecular bar codes or information storage media in biomolecular computa-tions (3–5).Accordingly,new variants of the secondary structure prediction and design tasks for nucleic acids arise.RNAsoft provides new tools for three such tasks:PairFold predicts the minimum free energy secondary structure formed by two input DNA or RNA molecules.PairFold can be used,for example,to predict interactions between a probe and target RNA molecule or between pairs of strands in biomolecular nanostructures.CombFold predicts which strand,out of a combinatorial set formed from DNA or RNA input strands,folds to a secondary structure with the lowest minimum free bFold can,for example,efficiently test that no strand in a large tag library [such as the Brenner’s library of size 88(3)]forms unwanted secondary structure.RNA Designer designs an RNA sequence that folds to a given input secondary structure.The tool is intended for designers of RNA molecules with particular structural or functional properties.The RNAsoft web site,at http://www.RNAsoft.ca,provides online access to all three tools.Following a brief overview of RNA secondary structure modeling and representation,we describe the function and output of each of the online services.All tools are based on a standard free energy model (1),which provides a measure of thermodynamic stability for possible secondary structures that a molecule or molecules could form,as a function of the base sequence and temperature,in a 1M NaCl solution.Here,we provide a brief overview of the model.If the bases of a strand R are indexed consecutively starting from the 50end,then the secondary structure can be represented as a set of base pair indexes (Fig.1A).If there are no base pairs (i ,j )and (i 0,j 0)with i <i 0<j <j 0,then the structure is pseudoknot free .The standard free energy model pertains only to pseudoknot free structures,in which the base pairs define component loops and stacked pairs of the structure (Fig.1A).The free energy of a structure is calculated as the sum of the energies of its component loops and stacked pairs,which in turn are calculated using experimentally obtained thermodynamic data (6,7)(Fig.1B).The free energy model predicts that,under fixed conditions such as temperature,a DNA or RNA molecule will fold to the structure that minimizes the free energy.Throughout,when we refer to the minimum free energy structure for a molecule,we mean the minimum free energy pseudoknot free structure for the molecule.[Methods for prediction of pseudoknotted structures can be found in the work of Rivas and Eddy (8)and Gultyaev et al.(9).]A pseudoknot free secondary structure for a molecule with n bases can be uniquely represented as a sequence of length n whose i th symbol is either ‘.’if the i th base is unpaired,‘(’if the i th base is paired with a base of higher index and ‘)’if the i th base is paired with a base of lower index (Fig.1C).We refer to this as dot-parenthesis notation.All three RNAsoft tools use this notation to represent DNA or RNA secondary structures in their input and output.Where possible,output structures are also provided in Connectivity Table (CT)and RNAML formats.An RNA sequence is represented as a string over the alphabet {A,C,G,U},representing the adenine,cytosine,guanine and uracil bases,with the 50end corresponding to the*To whom correspondence should be addressed:Tel:þ16048228175;Fax:þ16048225485;Email:condon@cs.ubc.ca3416–3422Nucleic Acids Research,2003,V ol.31,No.13DOI:10.1093/nar/gkg612Nucleic Acids Research,V ol.31,No.13#Oxford University Press 2003;all rights reservedleft end of the sequence.A DNA sequence is represented in the same way,except that T,for thymine,replaces U.PAIRFOLDThe PairFold program predicts the secondary structure of a pair of RNA or a pair of DNA molecules.Extending the notion of secondary structure for a single molecule,a secondary structure for a pair of molecules (R 1,R 2)is a set of base pairs,with each base of R 1and R 2occurring in,at most,one pair.The model for measuring the minimum free energy of a secondary structure for two RNA molecules at a given temperature is very similar to that for a single molecule,except that an intermolecular initiation penalty is added (Fig.1D).The secondary structure can be represented as a pair of sequences (S 1,S 2)in dot-parenthesis notation.We de fine the structure (S 1,S 2)for the pair of molecules (R 1,R 2)to be pseudoknot free if,and only if,the structure S 1S 2for the single molecule R 1R 2(the concatenation of the sequences R 1and R 2)is pseudoknot free.PairFold takes two RNA or two DNA sequences,R 1and R 2,plus a temperature value in the range 0–100 C.It calculates and outputs the minimum free energy (pseudoknot free)secondary structure of the pairs (R 1,R 2),(R 1,R 1)and (R 2,R 2)at the input temperature,along with their minimum free energy values.Predictions of the enthalpy,entropy and melting temperature of minimum free energy structure are also provided.Figure 2shows the user interface for PairFold,illustrating its use in predicting the secondary structure of a hairpin ribozyme(10).As with all three online services,the user can choose whether to view the output on a dynamically generated web page or to receive the output via email or both.If a computation takes more than 1min,the web interface noti fies the user that the result will be sent out via email.PairFold differs from mfold and RNAfold in that it takes as input two sequences,rather than one sequence.The HYTHER TM software tool (available at /Hyther/hytherm1main.html)does take two sequences as input,but is more limited than PairFold because it calculates the free energy of the single secondary structure obtained by pairing those thermodynamically favorable base pairs at the corresponding positions in the two input sequences,as in the first secondary structure of Figure 1D,rather than finding the minimum over the class of all pseudoknot free structures.Moreover,PairFold can accept sequences of different lengths,whereas the sequences input to HYTHER TM must have the same length.Other related programs include OligoWalk of Mathews et al.(11)and ProbeSelect of Li and Stormo (12),which design probe oligos for RNA targets or genes,respectively.An algorithm that is essentially the same as PairFold is incorporated into OligoWalk,but is not available on the web.PairFold uses a dynamic programming algorithm that is a straightforward variant of the Zuker –Stiegler algorithm for single molecules (13).If the lengths of the sequences R 1and R 2are n 1and n 2,respectively,then the running time of PairFold is O((n 1þn 2)3),meaning that the number of computer operations needed on input R 1,R 2is bounded by a constant time (n 1þn 2)3.In practice,the computation for sequences of <500bases each takes less than 500CPU seconds onourFigure 1.RNA Secondary structure.(A )Graphical depiction of the predicted minimum free energy secondary structure S for sequence R ¼GCCGCACGCG-AGACCGCGCACUCCGCGGGAUG CCCAUAGGAGAAGCGGCAUUACCUGUAGCCAAGCCAGUA,plus the list of associated base pairs.S is pseudoknot free.(B )Free energy calculation for structure S .Contributions of the labeled stems and loops (hairpins,bulges,internal loops,external loop and multiloops)to the free energy are summed to obtain the total free energy,which for this strand is the minimum free energy.(C )Dot-parenthesis representation of secondary struc-ture S .(D )Graphical depiction of two possible secondary structures for the pair of sequences (R 1,R 2)¼(GCCGCACGCGAGACCGCGCA,CGCGGUCUC-GCGUGCUUGGC).The structure on the left is obtained by pairing bases in matching positions of the two strands and has free energy À19.14kcal/mol,as predicted by HYTHER TM ,but this is not the minimum free energy structure.The structure on the right is predicted by PairFold to be the minimum free energy structure,having free energy À36.70kcal/mol.Nucleic Acids Research,2003,V ol.31,No.133417current server (for information on our server see section on Implementation).When allowing a maximum of 1CPU hour,PairFold can handle sequences of length up to 1000.To keep the load on our server manageable and response times of the online services reasonably low,we limit the length of the input sequences for the online version of PairFold to 500bases and the maximal processing time to 1h of wall-clock time (using wall-clock time in this context means that the maximal CPU time available for processing the given input may be reduced when the server load is high).Applications of PairFold include predicting the stability of a duplex formed by a probe oligo and target molecule,predicting how a ribozyme binds with its RNA target (10)or verifying that no unwanted secondary structure forms between two words (short single strands)in an RNA computation (5)or between two molecular tags in a polymer library (3).In the future,PairFold will be incorporated into a tool for the design of short DNA or RNA strands for use in biomolecular computations or DNA nanotechnology and will also be extended to take more than two sequences as input.COMBFOLDCombFold predicts which strand from a combinatorial set of strands has the lowest minimum free energy secondary binatorial sets of DNA strands are used as molecular bar codes in applications such as massively parallel signature sequencing (3),as well as for information storage in DNA computations (5).For example,Brenner et al.(3)use 88DNA tags,each of length 32(Fig.3).In these applications,it is important that none of the tags or strands fold on themselves in the temperature range at which they are bFold provides an ef ficient way to test whether this is indeed the case,avoiding the need to run a program like mfold on each tag individually.CombFold takes as input a description of a combinatorial set of DNA or RNA strands.We de fine a combinatorial set of strands as follows.Let S 1,S 2,...,S k be sets of strands for some k (see Fig.3for examples).Within each S i ,all strands should have the same length.We denote the length of the strands in set S i by n i and the number of strands in S i by N i .Then thecombinatorialFigure 2.PairFold user interface.(A )The sequences R 1¼GGCCACCUGACAGUCCUCUCC and R 2¼GGAGAGAGAAGUCAACCAGAGAAACACACCAACCC-AUUGCACUCCGGGUUGGUGGUAUAUUACCUGGUACGGGGGAAACUUCGUGGUGGCCG are entered in simple text boxes.In this example,the sequences form a hairpin ribozyme (8).(B )The dot-parenthesis representation of the minimum free energy secondary structure as predicted by PairFold.(C )The dot-parenthesis representation of the secondary structure found in the crystallization construct,as reported by Rupert and Ferre ´-D ’Amare ´(10).The structure reported by PairFold for the pair (R 1,R 2)contains the four stems found in the crystallization construct.The difference in the secondary structure for (R 1,R 2)of (B)and the secondary structure of (C)(highlighted in orange in B)can be attributed to the fact that the non-standard base pairings A-A,G-A and C-A found in the true structure are not accounted for in the Turner thermodynamic parameters and thus cannot be predicted by software based on these parameters.3418Nucleic Acids Research,2003,V ol.31,No.13set formed from S 1,S 2,...,S k is the set of all strands of the form S 1S 2...S k where S i is a strand in S i ,for each i between 1and k .Note that the length of a strand in the combinatorial set is n ¼n 1þn 2þÁÁÁn k and the number of strands in the combinatorial set is N 1ÂN 2ÂÁÁÁÂN k .A combinatorial set may be speci fied in one of two ways in the CombFold user interface.The first way is to use IUPAC code.For example,50-ARNG-30represents the combinatorial set of 4mers in which the first and last bases are A and G,respectively,the second is a purine (A or G)and the third may be any one of A,C,G,U or T.In the second way to specify a combinatorial set (Fig.4)the strands in set S 1are entered,one per line,in a simple text area,followed by a line containing a *,then the strands in S 2are entered,one per line,followed by a line containing a *,and so on until the strands in S k are entered.The set of strands can easily be pasted into the box from a file on the user ’s computer.The folding temperature may be speci fied by the user.In addition,the user may specify the desired number,N ,of output bFold will return the N strands with the lowest minimum free energy secondary structures at the given temperature,along with the correspond-ing structures and free energy values.CombFold uses a dynamic programming algorithm to identify its output,thereby avoiding the need to calculate the free energy of each individual strand in the combinatorial set (14,15).The running time of CombFold is O(N 2Ân 3),where N is the maximum of the N i and n is the length of the strands in the combinatorial set.In contrast,an algorithm that folds each possible strand in the combinatorial set requires time proportional to N 1ÂN 2ÂÁÁÁÂN k Ân 3.In applications of CombFold,N is often small compared to k —for example,in the combinatorial set of Braich et al.(5)all of the N i ¼2(and thus N ¼2)and k ¼20—in which case CombFold is signi ficantly faster than the naive approach.Still,in practice the running time of CombFold increases quickly with N ,k and n .On an input with 10sets,two strands per set and all strands having length 16,the computation time is <400CPU seconds.On an input with eight sets,eight strands in each set and all strands having length 4[as in Brenner ’s combinatorial set (3)],the computation time is <700CPU seconds.To keep the load on our server manageable and response times reasonably low,we limit the size of CombFold ’s inputs to 10sets,four strands per set and strand length 20.CombFold can be used to test whether all strands in a combinatorial set for use in a DNA or RNA computation (5,16)or as molecular tags (3)have no unwanted secondary bFold can also be useful to gain insight on the range ofsecondary structures that can be formed from a consensus RNA sequence or in identi fication of good starting points for mutagenesis or SELEX experiments.Another application is to determine which of the many RNA strands that code for a particular protein has the most stable secondary structure (14).In the future,CombFold and an extended version of PairFold will be combined to determine the minimum free energy structure that can be formed from multiple strands taken over all of the possible orderings of the individual strands.RNA DESIGNERRNA Designer takes as input a secondary structure description and outputs an RNA strand that is predicted to fold to that secondary structure.RNA Designer can be used to design RNA molecules with certain structural properties,as part of the development of molecules with novel functional properties,or more fundamentally in order to understand which secondary structure elements are critical to speci fic functions of cellular RNAs.RNA Designer uses a stochastic local search algorithm,which decomposes the input structure in a hierarchical fashion,finds strands that fold to the resulting substructures and then attempts to combine the strands for substructures into a strand for the overall structure.A pseudo-random number generator is used to implement the stochastic steps of the algorithm and by fixing the seed for this generator,the behavior of RNA Designer becomes completely deterministic.If desired,any run of the algorithm may be reproduced by running the algorithm again with the respective seed value.RNA Designer uses the fold routine from the Vienna RNA Package as part of its implementation (2).Due to the stochastic nature of the algorithm,RNA Designer can be used to probabilistically sample the solution space by performing multiple runs of the algorithm (with different seed values).This allows the user to easily obtain sets of sequences that all fold to the desired structure,from which further selections according to speci fic criteria can be made manually.As shown in Figure 5,the input secondary structure is speci fied using dot-parenthesis representation and is entered in a simple text box.The temperature,number of output strands and optionally a seed for the pseudo-random number generator may all be speci fied.Furthermore,the user may additionally impose primary sequence constraints by providing a sequence speci fication using a subset of IUPAC code.Two additional parameters can be used to control the target GC contentofFigure binatorial sets of strands.(A )The DNA tag set of Brenner et al.(3)Each tag is obtained by concatenating eight 4mers,one chosen from each of the eight columns.Thus,each tag has length 32and there are 88¼16777216tags in total.One such tag is AATCTTACCAAAACATACATTCTACTTTAATC.Column i lists the strands in the set S i ,for i between 1and 8.Also in this example,n i ¼4and N i ¼8for each i .(B )A simple combinatorial set used in the screen shots of Figure 4.This set can also be represented using IUPAC code,as 50-AURCAAUGCSNAUGCAC-30.Nucleic Acids Research,2003,V ol.31,No.133419paired and unpaired bases in the given structure.In our current implementation,these parameters allow the user to specify a probabilistic bias towards the desired GC content in the search process.In cases where many sequences exist for a given structure (or substructure),RNA Designer can be expected to produce results that closely match the target GC content.However,in cases where finding a correctly folding sequence with the target GC content is hard or impossible,the search is allowed to drift from the GC target.RNA Designer outputs the speci fied number of RNA strands and,for each,the structure to which the strand is predicted to fold at the user speci fied temperature,its free energy and the random seed used to produce the strand.If the user does not provide a random seed,a seed is chosen based on the time at which the program starts to run.In most cases,the output strands fold to the input structure.However,if the program fails to find a strand which folds to the input structure (e.g.because no strand exists that would fold into the given structure),it outputs the strand found whose MFE structure is of minimum distance from the input structure,where the distance is the number of bases in the output strand that are not paired (or unpaired)in the output secondary structure as speci fied in the input secondary structure.The Vienna Package also contains a tool for design of RNA strands that fold to a given input secondary structure.However,RNA Designer is consistently able to solve structures for which the Vienna Package program,RNAinverse,is unable to find solutions and its running time is signi ficantly lower than RNAinverse.Furthermore,RNAinverse does not support primary sequence constraints.We empirically evaluated RNA Designer on 24computationally predicted structures of bio-logical sequences from the Ribosomal Database Project.RNA Designer found solutions to all 24instances (length:260–1475bases),while RNAinverse solved only seven of the instances.Examples of sequences whose predicted structures were not solved by RNAinverse include Bradyrhizobium sp.str.283A,Spirochaeta sp.and Methanocaldococcus fervens str.AG86DSM 4213(T).RNA Designer also performed better than the RNAinverse on 420arti ficially generated structures.Further details can be found in a report that is linked from the RNA Designer website.RNA Designer,when running on our current server,typically finds RNA sequences of length $300bases for biologically plausible secondary structures in <60CPU seconds.When allowing a maximum runtime of 1CPU hour,RNA Designer can handle structures with up to 1500bases.To keep the load on our server manageable and to ensure reasonably low res-ponse times,we limit the length of the input sequences for the online version of RNA Designer to 500and the maximal processing time to 1h of wall-clocktime.Figure bFold user interface.(A )Web interface for CombFold input.The input is the combinatorial set of Figure 3B speci fied using IUPAC code.(B )Partial view of web interface for CombFold output,reporting that for the given input,the sequence AUGCAAUGCGCAUGCAC has the minimum free energy structure,namely ((((....))))....,with free energy À2.70kcal/mol.3420Nucleic Acids Research,2003,V ol.31,No.13Possible applications for RNA Designer include the design of RNAs with speci fic secondary structures which may be used in the study and characterization of biological RNAs and their function as well as in building arti ficial RNA structures that can be used for modulation of cellular RNA functions,nanostructure design or biomolecular computations.Future plans for RNA Designer include:(i)to support better energy models of RNA structure (in particular,models including pseudoknots which provide the basis for the algorithmic design of strands with pseudoknotted secondary structures);(ii)to support the design of RNAs with bi-or multistable secondary structures;and (iii)to support the design of complexes consisting of two or more RNA strands.IMPLEMENTATIONAt the basis of the RNAsoft web services are the three standalone programs PairFold,CombFold and RNA Designer.These have been developed and implemented in C þþunder RedHat Linux,version 2.4.18SMP .RNA Designer uses routines from the Vienna RNA Package (see http://www.tbi.univie.ac.at/~ivo/RNA/RNAlib.html).These programs are accessed from the RNAsoft web site via HTML pages and CGI scripts implemented in Perl.Our current server machine is a PC with two Intel Xeon 2GHz CPUs with 512KB CPU cache each and 4Gb of RAM,running Redhat Linux,version 2.4.18SMP;this machine runs an Apache web server.Thermodynamic parameters for RNA were provided by Doug Turner (6)and Michael Zuker (/,/~zukerm/)and parameters for DNA were provided by John SantaLucia Jr (7)().ACKNOWLEDGEMENTSWe gratefully acknowledge the permission of John SantaLucia Jr,Doug Turner and Michael Zuker for use of their DNA and RNA thermodynamic parameters,and Ivo Hofacker et al.(2)for making the Vienna RNA Package publically available,parts of which are used in RNA Designer.In addition,we thank our colleagues Barry Cohen,Danielle Dees,Anthony Fejes,Firas Hamze,Frank Hutter,Steven Skiena,Laura Slaybaugh and Shelly Zhao,who collaborated with us on development of algorithms and on earlier versions of this software.We thank our collaborators Dan Tulpan,Rob Corn and Lloyd Smith for their support in the development of PairFold,and Dave Brent for his technical assistance.We thank the anonymous reviewers for their valuable suggestions for improving the functionality of the tools and for pointing out additional useful applications.This work was funded by the Natural Sciences and Engineering Research Council (NSERC)of Canada,the US National Science Foundation under grant number 144-KN87,the Defense Advanced Research Projects Agency (DARPA)and Air Force Research Laboratory,Air Force Materiel Command,USAF ,under agreementnumberFigure 5.RNA Designer user interface.(A )Web interface for RNA Designer input,with input structure as in Figure 1C.(B )Partial view of web interface for RNA Designer output.Nucleic Acids Research,2003,V ol.31,No.133421F30602-01-2-0555.The US Government is authorized to reproduce and distribute reprints for Governmental purposes notwithstanding any copyright annotation thereon.The views and conclusions contained herein are those of the authors and should not be interpreted as necessarily representing the official policies or endorsements,either expressed or implied, of the Defense Advanced Research Projects Agency(DARPA), the Air Force Research Laboratory or the US Government. REFERENCES1.Zuker,M.,Mathews,D.H.and Turner,D.H.(1999).Algorithms andthermodynamics for RNA secondary structure prediction:a practical guide.Barciszewski,J.and Clark,B.F.C.(eds),In RNA Biochemistry andBiotechnology,NATO ASI Series,Kluwer Academic Publishers.2.Hofacker,I.L.,Fontana,W.,Stadler,P.F.,Bonhoeffer,S.,Tacker,M.andSchuster,P.(1994)Fast folding and comparison of RNA secondarystructures.Monatshefte f.Chemie,125,167–188.3.Brenner,S.,Williams R.S.,Vermaas,E.H.,Storck,T.,Moon,K.,McCollum,C.,Mao,J-I.,Luo,S.,Kirchner,J.J.,Eletr,S.et al.(2000)In vitro cloning of complex mixtures of DNA on microbeads:physical separation of deferentially expressed cDNAs.Proc.Natl A, 97,1665–1670.4.Shoemaker,D.D.,Lashkari,D.A.,Morris,O.,Mittman,M.and Davis,R.W.(1996)Quantitative phenotypic analysis of yeast deletion mutants using a highly parallel molecular bar-coding strategy.Nature Genet.,16,450–456.5.Braich,R.S.,Chelyapov,N.,Johnson,C.,Rothemund,P.W.K.andAdleman,L.(2002)Solution of a20-variable3-SAT problem on a DNA computer.Science,296,499–502.6.Serra,M.J.,Turner,D.H.and Freier,S.M.(1995)Predictingthermodynamic properties of RNA.Methods Enzymol.,259,243–261. 7.SantaLucia,J.,Jr(1998)A unified view of polymer,dumbbell,andoligonucleotide DNA nearest-neighbor thermodynamics.Proc.Natl Acad.A,95,1460–1465.8.Rivas,E.and Eddy,S.R.(1999)A dynamic programming algorithm forRNA structure prediction including pseudoknots.J.Mol.Biol.,285,2053–2068.9.Gultyaev,A.P.,van Batenburg,F.H.D.and Pleij,C.W.A.(1995)Thecomputer simulation of RNA folding pathways using a genetic algorithm.J.Mol.Biol.,250,37–51.10.Rupert,P.B.and Ferre´-D’Amare´,A.R.(2001)Crystal structure of a hairpinribozyme-inhibitor complex with implications for catalysis.Nature,410, 780–786.11.Mathews,D.H.,Burkard,M.E.,Freier,S.M.,Wyatt,J.R.and Turner,D.H.(1999)Predicting oligonucleotide affinity to nucleic acid targets.RNA,5, 1458–1469.12.Li,F.and Stormo,G.D.(2001)Selection of optimal DNA oligos for geneexpression arrays.Bioinformatics,17,1067–1076.13.Zuker,M.and Stiegler,P.(1981)Optimal computer folding of large RNAsequences using thermodynamics and auxiliary information.Nucleic Acids Res.,9,133–148.14.Cohen,B.and Skiena,S.(2002)Designing RNA structures:natural andartificial selection.Proc.Sixth Annual p.Biol.,ACM Press, New Y ork,pp.109–116.15.Andronescu,M.,Dees,D.,Slaybaugh,L.,Zhao,Y.,Cohen,B.,Condon,A.and Skiena,S.(2003)Algorithms for testing that sets of DNA wordsconcatenate without secondary structure.Proc.Eighth InternationalWorkshop on DNA Based Computers.Lecture Notes in Computer Science, Springer-Verlag,2568,182–195.16.Faulhammer,D.,Cukras,A.R.,Lipton,R.J.and Landweber,L.F.(2000)Molecular computation:RNA solutions to chess problems.Proc.Natl A,97,1385–1389.3422Nucleic Acids Research,2003,V ol.31,No.13。