图表作文写作练习
雅思作文图表题范文(热门3篇)

雅思作文图表题范文第1篇It is said that countries are becoming similar to each other because of the global spread of the same products, which are now available for purchase almost anywhere. I strongly believe that this modern development is largely detrimental to culture and traditions worldwide.A country’s history, language and ethos are all inextricably bound up in its manufactured artefacts. If the relentless advance of international brands into every corner of the world continues, these bland packages might one day completely oust the traditional objects of a nation, which would be a loss of richness and diversity in the world, as well as the sad disappearance of the manifestations of a place’s character. What would a Japanese tea ceremony be without its specially crafted teapot, or a Fijian kava ritual without its bowl made from a certain type of tree bark?Let us not forget either that traditional products, whether these be medicines, cosmetics, toy, clothes, utensils or food, provide employment for local people. The spread of multinational products can often bring in its wake a loss of jobs, as people urn to buying the new brand, perhaps thinking it more glamorous than the one they are used to. This eventually puts old-school craftspeople out of work.Finally, tourism numbers may also be affected, as travelers become disillusioned with finding every place just the same as the one they visited previously. To see the same products in shops the world over is boring, and does not impel visitors to open their wallets in the same way that trinkets or souvenirs unique to the particular area too.Some may argue that all people are entitled to have access to the same products, but I say that local objects suit local conditions best, and that faceless uniformity worldwide is an unwelcome and dreary prospect.Heres my full answer:The line graphs show the average monthly amount that parents in Britain spent on their children’s sporting activities and the number of British children who took part in three different sports from 2008 to is clear that parents spent more money each year on their children’s participation in sports over the six-year period. In terms of the number of children taking part, football was significantly more popular than athletics and 2008, British parents spent an average of around £20 per month on their children’s sporting activities. Parents’ spending on children’s sports increased gradually over the following six years, and by 2014 the average monthly amount had risen to just over £ at participation numbers, in 2008 approximately 8 million British children played football, while only 2 million children were enrolled in swimming clubs and less than 1 million practised athletics. The figures for football participation remained relatively stable over the following 6 years. By contrast, participation in swimming almost doubled, to nearly 4 million children, and there was a near fivefold increase in the number of children doing athletics.剑桥雅思6test1大作文范文,剑桥雅思6test1大作文task2高分范文+真题答案实感。
六级图表类作文范文

六级图表类作文范文
范文:
第一段,图表揭秘。
一看这图表,就知道近几年那城市居民出行方式可变了不少。
私家车越来越多,公共交通和走路的人越来越少。
第二段,私家车火爆。
说起私家车,那可真是火得一塌糊涂。
从2018年到2023年,
私家车的使用率从30%一路飙升到快50%了。
这背后啊,肯定是大家
生活好了,都想开车方便点。
第三段,公共交通遇冷。
可另一边呢,公共交通就没那么受欢迎了。
图表显示,用公共
交通的人越来越少,可能和私家车多了、公交服务没跟上都有关系。
第四段,步行渐少。
再来说说步行。
以前大家都爱走路,现在可不一样了。
城市的节奏越来越快,大家都想快点到达目的地,所以走路的人就少了。
第五段,环境与健康小忧。
这出行方式一变,环境和健康也跟着受影响。
私家车多了,空气和噪音污染都加重了;走路的人少了,大家运动也少了,健康自然就受影响了。
第六段,未来咋办。
那未来怎么办呢?城市管理者可得好好想想了。
高考备考写作专题:图表分析作文

高考备考写作专题:图表分析作文第一篇:全球二氧化碳排放量变化趋势随着工业化和现代化的发展,全球二氧化碳排放量不断增加,给地球的生态环境带来了巨大挑战。
下面是一幅描述全球二氧化碳排放量变化趋势的图表。
从图表中可以看出,自20世纪50年代开始,全球二氧化碳排放量呈现出逐年增加的趋势。
在20世纪70年代到80年代之间,排放量增速开始明显加快,到了90年代更是达到了高峰。
然而,在近几年,尽管二氧化碳排放量仍然在增加,但增速明显放缓。
造成全球二氧化碳排放量增加的原因有很多,但主要是工业生产、能源消耗和交通运输等活动所引起的。
这些活动大量使用化石燃料,例如煤炭、石油和天然气,导致了大量的二氧化碳释放到大气中。
全球二氧化碳排放量的增加给地球的生态环境带来了诸多问题。
首先,大量的二氧化碳排放导致大气中温室气体浓度升高,进而造成气候变化,例如全球气温上升、极端天气事件增多等。
其次,二氧化碳还会导致海洋酸化,对海洋生物造成威胁。
此外,由于空气污染加剧,人们的健康也受到了威胁。
为了应对全球二氧化碳排放量增加的问题,各国政府和国际组织已经采取了一系列的措施,例如限制工业排放、推广清洁能源和绿色交通等。
但要真正解决二氧化碳排放问题,还需要全球各方共同努力,包括改变生活方式、提高环保意识等。
第二篇:中国城市人口增长随着城市化进程的不断推进,中国城市人口呈现出快速增长的趋势。
下面是一幅描述中国城市人口增长的图表。
从图表中可以看出,1990年以前,中国城市人口增长较为缓慢,但之后迅速加快。
尤其是在2000年以后,城市人口增长速度急剧提升。
目前,中国的城市化率已经超过了50%。
城市人口增长的原因有很多,主要是农村人口向城市转移和城市自然增长导致的。
一方面,农村居民为了追求更好的生活条件和就业机会,纷纷涌向城市。
另一方面,由于医疗水平的提高和生活条件的改善,城市人口的自然增长也较快。
城市人口增长给中国带来了很多挑战。
首先,城市人口的快速增加导致了城市基础设施和公共服务压力的加大。
图表作文练习题目
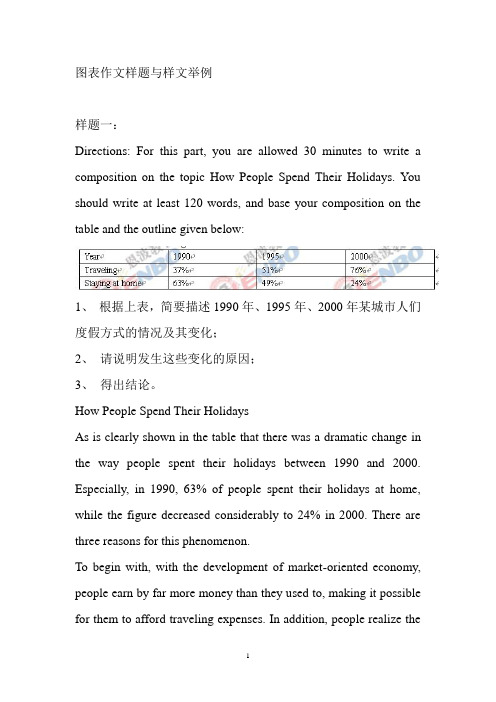
图表作文样题与样文举例样题一:Directions: For this part, you are allowed 30 minutes to write a composition on the topic How People Spend Their Holidays. You should write at least 120 words, and base your composition on the table and the outline given below:1、根据上表,简要描述1990年、1995年、2000年某城市人们度假方式的情况及其变化;2、请说明发生这些变化的原因;3、得出结论。
How People Spend Their HolidaysAs is clearly shown in the table that there was a dramatic change in the way people spent their holidays between 1990 and 2000. Especially, in 1990, 63% of people spent their holidays at home, while the figure decreased considerably to 24% in 2000. There are three reasons for this phenomenon.To begin with, with the development of market-oriented economy, people earn by far more money than they used to, making it possible for them to afford traveling expenses. In addition, people realize theimportance of getting well-informed about the outside world in this modern era to develop their potential. For example, a traveler may encounter or talk with someone of a different cultural background so as to broaden his vision. Last but not least, by traveling outside, people are close to nature, which is not only beneficial to both their health and peace of mind. In short, more and more people take the occasion of holiday to travel outside and relax themselves.As far as I am concerned, I prefer to go traveling instead of staying at home during holidays. On the one hand, I love meeting different people and take in some fresh ideas. On the other hand, it is agreed that the world is becoming a global village. No one could confine himself within his small circle of families or relatives. In brief, I have benefited a lot and will benefit more from traveling during the holidays.点评:该篇作文属图表作文,命题思路与四级真题图表作文一致,仿真度高。
(完整版)图表作文范文汇总.docx
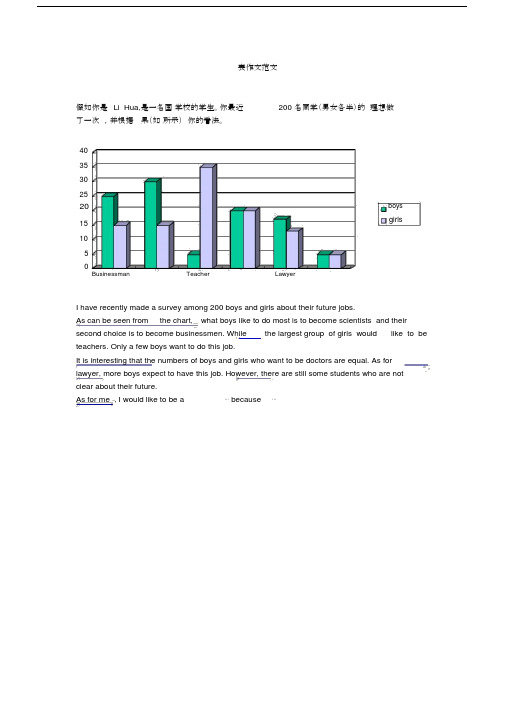
表作文范文假如你是Li Hua,是一名国学校的学生。
你最近200 名同学(男女各半)的理想做了一次,并根据果(如所示)你的看法。
4035302520boysgirls15105Businessman Teacher LawyerI have recently made a survey among 200 boys and girls about their future jobs.As can be seen from the chart, what boys like to do most is to become scientists and their second choice is to become businessmen. While the largest group of girls would like to be teachers. Only a few boys want to do this job.It is interesting that the numbers of boys and girls who want to be doctors are equal. As for lawyer, more boys expect to have this job. However, there are still some students who are notclear about their future.As for me , I would like to be a⋯because⋯7崇文一模某英文报纸正在开展题为“中学生课堂注意力”的专栏讨论,你校准备参加,并请你代表学校写一篇文章给该英文报纸投稿。
下面的图表为你校的调查结果,请你根据所提供的信息做简要说明,并根据提示给出改善的建议。
注意:图中数据为学生人数百分比。
中学生课堂注意力集中的情况中学生课堂注意力不能集中的原因40%30%70%60%能够集中注意力不能集中注意力课堂干扰睡眠不足与疲劳改善注意力的建议:教室课堂课间通风、明亮积极参与课堂活动适量活动或适当休息注意: 1.词数:不少于60。
图表作文训练

1990 1999
根据下面图表以“How People Spent Their Holidays”为题, 写一篇120词左右的短文。
Changes in the Ways People Spent Their Holidays
As the pie chart shows, the majority of the respondents are against the product placement while only 35% are supporters. 15% of the people surveyed think the practice is reasonable because holding such big events costs a lot. CCTV needs to make good use of the opportunity to earn enough money to finance its operation and development. One-fifth of them don’t feel annoyed at the product placement and even regard it as an natural part of the programs. Almost one third of the respondents complain that the irrelevant product placement makes the programs strange and ridiculous. Product placement appears so frequently in the program that a quarter of the people surveyed feel rather disturbed. The rest 10% argues that the practice has greatly damaged CCTV’s image as the most important media in China because it’s the main channel for the general public to get information and entertainment. Personally, product placement in right amounts are acceptable if it doesn’t spoil the fun and art of the programs. Whatever CCTV does, it should take the audience’s feelings into consideration and put their needs in the first place.
高考英语写作专项训练:图表作文
图表作文1.你校英文报上周组织了主题为“Students’ ways to take exercise”的调查活动。
请你结合调查结果写一篇英语短文,内容包括:1. 概述调查结果;2. 你喜欢的锻炼方式;3. 建议合理地锻炼。
注意:1. 词数100左右;2. 题目已为你写好。
_______________________________________________________________________________ _______________________________________________________________________________ _______________________________________________________________________________ _______________________________________________________________________________ _______________________________________________________________________________ _____________________________________________________________2.最近,你们班就“是否应该帮助陌生人”展开了讨论,同学们就这一话题意见不一,你的看法如何?根据所提供的信息,以“Should We Help Strangers?”为题,写一篇短文。
注意:1. 表达清楚,语法正确,上下文连贯;2. 必须包括表格中所有的相关信息,并适当发挥;3. 词数:100左右(正文的开头已给出,不计入总词数);4. 不得使用真实姓名、校名和地名等。
_______________________________________________________________________________ _______________________________________________________________________________ _______________________________________________________________________________ _______________________________________________________________________________ ___________________________________________________________3.假定你是李华,你的美国笔友Tom来信说暑假想来中国旅游,还没决定去成都还是上海,向你咨询这两个城市的信息。
高考英语写作之图表作文(格式与范例)
高考英语书面表达练习——图表作文(格式与范例)作文一假如你是李华,在最近的研究性学习当中,受《21世纪中学生英语报》(The 21st Century)之邀,你对你所在的班60名同学(男女各半)进行了上网目的的调查。
现将调查结果(如下表所示)用英语给报社的编辑写一封信,报道此事,以引起舆论的关注,并提出你的观点和建议。
注意:1、报道应包括图表所示全部内容,可适度发挥。
2、文章的开头与结尾已给出,不计入总词数。
3、词数: 1504、参考词汇:调查: make a surveyDear editor,I have recently made a survey among 30 boys and 30 girls in my CLASs about their purpose of getting on the Internet. ______________________________________________作文二下列表格为某市1996年与2006年人们度假方式的情况比较,请按表格内容写一篇150词左右的短文,并对度假方式变化原因加以简要评析。
年度1996 2006 原因境外旅游11% 22% 收入增加海边度假38% 31% 海水污染爬山野营11% 34% 回归自然The way people spend their holidays changed a lot from 1996 to 2006.[思路点拨]题材:书信;说明+议论时态:一般现在时人称:第三人称要点提示:(1)上网的目的;(2)读新闻;(3)发送邮件;(4)聊天;(5)学习;(6)玩游戏;(7)评语篇章结构:文章可分两段[文采修饰]连接词的选用:but, both…, and, moreover, otherwise高级词汇的选用:keep in touch with, as for…, use… as …, benefit from, pay attention to, altogether, in one’s opinion.复杂句型的选用:what…most 引导的主语从句;as 引导的让步状语从句;倒装语序等。
英语四级图表作文
英语四级图表作文英语四级图表作文模板(精选8篇)图表作文的写作是英语四级里常会遇到的,下面,店铺为大家送上一些英语四级图表作文模板(精选8篇),希望能对大家有所帮助。
英语四级图表作文篇1As can be clearly seen from the graph/table/chart (As is shown in the table/figure), great changed have taken place in_______, The _________ have/has skyrocketed/jumped from _____ to _____.When it comes to the reasons for the changes, different people give different explanations. Here I shall just give a few.To begin with, ______What’s mo re,___________, Last but not least, ________.While it is desirable that ___________, there are still some problems and difficulties for __________ Firstly, __________ ,In addition, __________ ,In a word, __________英语四级图表作文篇2as is shown/indicated/illustrated by the figure/percentage in the table(graph/picture/pie/chart), ___作文题目的`议题_____ has been on rise/ decrease (goesup/increases/drops/decreases),significantly/dramatically/st eadily rising/decreasing from______ in _______ to ______ in _____. From the sharp/marked decline/ rise in the chart, it goes without saying that ________.There are at least two good reasons accounting for ______. On the one hand, ________. On the other hand, _______ is due to the fact that ________. In addition, ________ is responsible for _______. Maybe there are some other reasons to show ________. But it is generally believed that the above mentioned reasonsare commonly convincing.As far as I am concerned, I hold the point of view that _______. I am sure my opinion is both sound and well-grounded. 英语四级图表作文篇3It is obvious in the graph/table that the rate/number/amount of Y has undergone dramatic changes. It has gone up/grown/fallen/dropped considerably in recent years (as X varies). At the point of (接近)X1, Y reaches its peak value of (多少).What is the reason for this change? Mainly there are (多少) reasons behind the situation reflected in the graphic/table. First of all, (第一个原因). More importantly, (第二个原因). Most important of all, (第三个原因).From the above discussions, we have enough reason to predict what will happen in the near future. The trend described in the graph/table will continue for quite a long time (if necessary measures are not taken括号里的使用于那些不太好的变化趋势).英语四级图表作文篇4①As can be clearly seen from the graph/table/chart,great changes have taken place in __________②The __________ have/has skyrocketed/jumped from _____ to _____.③When it comes to the reasons for the changes, different people give different explanations. Here I shall just give a few.④To begin with, . 原因之一⑤Whats more, . 原因之二⑥Last but not least, 原因之三⑦While it is desirable that ___________, there are still some problems and difficulties for __________⑧Firstly, __________ 要点一⑨In addition, __________ 要点二⑩In a word, __________ 总结补充:1.As we can see from the chart/graph/table/diagram2.The chart/graph/table/diagram shows thatAs is shown in According to As can be seen in3. This chart/graph/table/diagram shows a sharp great//sudden/slow/rapid. increase/drop...4. To make a generalization; on the whole; in general/generally speaking英语四级图表作文篇5(1)模版1According to the chart / graph / diagram / table, we clearly learn that _________. As early as _________,___________. Then,_________. Last,__________. In contrast, by _________,__________.There are many reasons accounting for _________. Firstly, _________.Secondly,__________. Finally,_________. As a result,_________.As far as I am concerned,_________. For one thing,__________. For another,________. In brief, I hold that__________.(2)模版2What is shown in the chart / graph / diagram / table above indicates that in recent years, more and more people pay attention to _________. The number of those who _________ has increased ________, and furthermore,____________.There are two factors responsible for the changes. In the first place,_________. Moreover,__________. Yet, it is noticeable that __________.From the analysis, we can safely draw the conclusion that__________. It is possible that in the future, the tendency will__________.(3)模版3As is shown in the chart / graph / diagram / table above, __________ has charged drastically in the past _________. While ___________,now the percentage of__________ is __________. Meanwhile, the number of _________ has soared up to ________.There are mainly two possible reasons contributing to the rapid changes. The first is that _________. Secondly,__________.In my point of view, the changes have a great influence on _________. At the same time,_______. To sum up ,_________.英语四级图表作文篇6Students tend to use computers more and more frequently nowadays. Reading this chart, we can find that the average number of hours a student spends on the computer per week has increased sharply. In 1990, it was less than 2 hours; and in 1995, it increased to almost 4 hours, and in 2000, the number soared to 20 hours.Obviously computers are becoming increasingly popular. There are several reasons for this change. First, computers facilitate us in more aspects of life. Also, the fast development of the Internet enlarges our demands for using computers. We can easily contact with friends in remote places through the Internet. Besides, the prices of computers are getting lower and lower, which enables more students to purchase them.However, there still exist some problems, such as poor quality, out-of-date designs and so on. And how to balance the time between using computers and studying is also a serious problem. Anyhow, we will benefit a lot from computers as long as we use them properly.英语四级图表作文篇7It can be seen from the graph that the rate of car accidents in Walton City experienced rises and falls in 1990. From Januaryto March last year it increased by 45%. From March to June it dropped by about half the previous rate. From June to August there was a steep rise of 50%. After that, however, there was a steady decrease.There are several reasons for this improvement, but the following are the most critical ones. First, new traffic regulations have made drivers more careful. Second, more people are using bicycles for transportation. Finally, in the later part of the year good weather made the roads safer to drive on.I am confident that there will be even fewer car accidents in Walton in the future. First, major roads have been repaired and the number of public buses has been increased in the past few months. Moreover, a traffic safety campaign has made all the local people more aware of the dangers of unsafe driving.英语四级图表作文篇8As can be clearly seen from the graph/table/chart (As is shown in the table/figure), great changed have taken place in_______, The_________ have/has skyrocketed/jumped from _____ to _____. When it comes to the reasons for the changes, different people give different explanations. Here I shall just give a few.To begin with, ______What’s more,___________, Last but not least, ________. While it is desirable that ___________, there are still some problems and difficulties for __________ Firstly, __________ ,In addition, __________ ,In a word, __________ .【英语四级图表作文模板(精选8篇)】。
高考图表作文专项讲解及练习(有答案)
图表作文本节内容一)图表作文写作要求图表作文就是把非文字信息(通常为各种图表表示的数字信息等)转换成文字信息的一种作文。
它要求我们用文字来描述非文字性的图表或对图表显示的关系作解释说明。
图表作文一般在题目中给出作文的标题和一个或几个统计表格、圆图形、曲线图或条形图,有时还用英文或中文提纲的形式给出提示,具体要求:1. 用文字描述图表,客观解释图表中所传递的信息,并找出某种规律或趋势;2. 就图表中所反映的某种趋势或问题分析其原因或后果。
图表作文着重说明事实,常常通过对图表中所反映的具体数据的说明、分析、比较,对某种事物或现象的事实或变化情况等加以说明,并提出结论或看法。
因此,图表作文常常采用议论文的写作方法。
二)写作步骤1.仔细阅读图表,了解图表所达的内容。
首先,用一句话概括图标的内容。
2.描写图表所反映的问题或规律3.结尾部分得出结论,表述自己的观点,结束全文。
(1)如果图表反映的是好的现象,首先要肯定、发表观点最后预测未来;(2)如果图表反映的是不好的现象,首先要否定、提出解决办法或建议三)写作实用表达(一)点明主题引用具体或粗略的数据,然后作出概括性分析,点名主题或引出需要论述的问题。
常用的词有:1.泛指一份数据图表:a data graph/chart/diagram/illustration/table饼图:pie chart 表格图:table 柱形图:bar chart趋势曲线图:line chart / curve diagram2.describe, show, represent, illustrate, reveal等等。
3. figure, statistic, number, percentage, proportion常用的开篇句型(即概述图表内容时常用的表达法)1.The graph/chart/table above shows / describes / illustrates that.....2. From the above graph/chart, it can be seen that…3. As is shown in the graph…4.The chart/table shows the differences between…5. According to the table/pie chart/ graph/bar graph, we can see/conclude that …(二)分析差异描写变化及总趋势特征、分析差异:数据说明常用套语:1.There was a great /slight increase /rise in…2.The number /rate has nearly doubled, compared with that of last year.3.The number is …times as much as that of….原因说明常用套语:1.The reason for…is that…2.The change results from the fact that…3.There are several causes for this significant growth in…. To begin with .... In addition/ Furthermore/ Moreover,...4. There are many factors that may account for...but the following are...(三)得出结论结尾常用套语1. Personally/ as far as I’m concerned/ in short/ in brief/ in conclusion /in summary2. It’s clear/evident from the chart that… / We can draw the conclusion that…3. From what has been discussed above/Taking into account all these factors, we can draw the conclusion that…4. There is no doubt that special attention must be paid to the problem of...5. It is high time that we put an end to the tendency of...图表作文常用单词、词组和句型总结:1)表示数据变化的单词或词组rapid/ rapidly 迅速的,飞快的,dramatic/ dramatically 急剧的sharp /sharply 明显的,急剧的significant/ significantly 重大的sradual/ gradually 渐进的,逐渐的steady / steadily 稳固的stable / stably 稳定的slow /slowly 缓慢的slight / slightly 略微的2)在描述中常用到的词汇significant changes 图中一些较大变化noticeable trend 明显趋势distribute 分配in terms of/ regarding/ with regard to/ as far as sth is concerned 关于,就...而言3) 描述增减变化常用的句型Compared with … is still increased by …The number of … grew/rose from … to …An increase is shown in …; then came a sharp increase of …In … the number remains the same/drops to …There was a very slight (small/slow/gradual) rise/increase in ......There was a very steady (marked/sharp/rapid/sudden/dramatic) drop (decrease/decline/fall/reduction) in ....../ compared with that of last year).4) 图表作文常用句型精选1. The table shows the changes in the number of.....over the period from....to......该表格描述了在...年至...年间...数量的变化。
- 1、下载文档前请自行甄别文档内容的完整性,平台不提供额外的编辑、内容补充、找答案等附加服务。
- 2、"仅部分预览"的文档,不可在线预览部分如存在完整性等问题,可反馈申请退款(可完整预览的文档不适用该条件!)。
- 3、如文档侵犯您的权益,请联系客服反馈,我们会尽快为您处理(人工客服工作时间:9:00-18:30)。
Stepl.示例例 1: Changes in the Ownership of Houses要求:1、根据上图描述该市住房产权的变化;2、 分析产生这些变化的原因;3、 说明这些变化对个人和社会产生的彫响。
Step2.图表作文分析1、 出题形式图表作文一般给出作文的标题和一个表格,要求:1) 用文字描述图表,客观解释图表中所传递的信息,并找出某种规律或趋势;2) 就图表中所反映的某种趋势或问题分析其原因或后果。
写好图表作文,关键在于能否读懂图表中所提供的信息,把握各信息间的联系,用准确流畅的语 言把这一信息表达出来,并就这一信息发表自己的看法。
2、 写作步骤1) 认真分析图表的含义,弄清所含信息及不同信息间的关系;2) 确定主题,构思框架,筛选能说明主题的典型数据;3) 列提纲;4) 扩展成段落,注意段与段Z 间的衔接与过渡;5) 检查与修改。
3、 篇章结构…三段式第一段:分析图表中的数据变化反映什么问题或趋势,概述图表所揭示的信息。
第二段:分析产生的原因第三段:展望未来或提出方法或建议Step3.请你分析上面这篇作文,构思提纲第一段: __________________________________________________________________________第二段: __________________________________________________________________________第三段:图表作文写作练习2015.01■ privet eO s t a. t oiiwae dLChanges in the Ownership of Houses As is shown in the chart, great changes have taken place in the ownership of houses in the city. There has been a steady decline in lhe percentage of slate-owned houses from 75 in 1990 to 20 in 2000. On lhe contrary, the percentage of private houses has been on the rise ・【变化有增有减,注意最大值或最小值】 Sevenil factors may account for the trend. For one thing, owing to the policy of reform and opening to the outside world, the past decade witnessed significant improvement in people's standard of living. In other words, they have had the means to purchase houses of their own. For another, people's ideas about consumption have undergone some radical changes. In the past, they were reluctant to spend, but now they are willing to buy. Anyway, it is much more comfortable to dwell in a house of one^s own.【分析原因: 经 济发展;消费理念变化】 These changes in the ownership have already had a positive effect on both individuals and society. Individuals, young people in particular, will be motivated to work harder to purchase a nest of their own. As a result, the housing industry will be boosted and more revenues will be raised to cover other sectors of our national economy.【对个人影响;对社会影响】Step4.词汇、句型、模板一、运用词汇1. 图表类型:table 表格;chart 图表;diagram 图表或图解,示意图;graph 图表,曲线column/ bar chart 柱状图;pie graph 饼图2・ 描述:show; describe; illustrate; can be seen from; clear; apparent; reveal 显示;represent 表现3•内容:figure 数字;statistics 统计数字;number; percentage; proportion4. 数据变化 上升:increase, rise, go up ,climb, 下降:decrease, fall, drop, decline, reduce平不急:remain steady/stable; /maintain/keep/be the same as/similar to 波动:there are rises andfalls, up and down 占:occupy, take up, account for 而:while, however, whereas , on the otherhand, actually/in fact 相比:by contrast, on the contrary, compared with 平均值,average 趋势:tendency, trend 预见:prediction比例:20 per cent, 20% of the …,one in three, 1/3, one out of every four, 有一个稳定的过程:a stable period can be seen5. 表示变化程度的词: sudden/suddenly 突然的,意外的 dramatic/dramatically戏剧性的,生动的 sharp/shtirply slow/slowly轻微的、6. 表7K 范围:7. 表示程度: almost nearly明显的,急剧的缓慢的,不活跃的略微地 stable/stably steady/steadily 稳固的from …to …between...and... for …to …多长时间直到达到顶峰:mount to the peak 1/4 rapid/rapidly 迅速的, significant/significantly 有意义的,重要的 steep/steeply 急剧升降的 gradual/gradually 渐进的,逐渐的 slight/slightly飞快的,险峻的 儿乎approximately 近似的,大约exactly 准确地 precisely 精确地;清晰地二.必背句型★★★1、概述图表:①According to the table/pie chart/, we can see/conclude that 根据该表/图,我们可知 ....②The table/graph reveals (shows/indicates/illustrates/points out) that...该表/图表明........③As we can see from the table …④As is shown/illustrated in the pie chart...如表/图所示, ........2、描述增减变化:①Compared with ...is still increased by ...②The number of ••• has grew/rose/decreased from ...in 2010 to ..A n 2014.(3) There was a very steady (marked/sharp/rapid/sudden/ dramatic) drop (decrease/decline/fall/reduction) in 1998 compared with that of last year).3、分析原因©There are chiefly two reasons for the changes.②The reasons that caused changes are diverse. On the one hand,…On the other hand,...③The rapid growth of... owes much to…4、总结归纳©Through the analysis, we can draw a con elusion that②Steps should be taken to ・・・③From all the facts given above, we can see …©Taking the advantages and disadvantages together into consideration, I believe...【注】句型1、2为图表类作文所特有,句型3、4则与普通议论文重合。
Step5.分析一篇范文(审题角度、使用句型)(1) From the graph, we can see that the number of car accide nts in Walton city in creased during the year of 2012・(2) The first two months of 2012 showed an increasing trend・(3) The rate rose to 32 in March but fell to 26 in June・(4) From June on, the rate was rising again and reached the peak point 39 in August. (5) After August the rate began to decline remarkably, and eventually dropped to the lowest point 16 at the end of the year.⑹ Therefore, it's obvious that car accident in Walton city declined in 2012.⑴主题句/概述表格反映的内容(2)-(5)反映交通事故的变化情况(6)小结:总结表格数据反映的总趋势(7)There are several reasons for the decline・(8) First, a new traffic law was made and came into force. (9) It provided that in summer every car must be air-conditioned・ (10) As a result, the highest rate in August, when humidity and high temperature make drivers impatient and easily lead to car accidents, dropped steadily. (11) Second, new roads were built and some narrow streets were widened, which quickened the flow of traffic. (12) Finally, the city administration made great efforts to heighten people's awareness of observing traffic rules.⑺主题句⑻原因/措施一(9)解释措施一/次要辅助QO)采取措施一后的结果QI)原因/措施二⑫原因/措施三(13) With all these new measures, Tm sure the rate of car accide nts in Walt on city will go on falling this year (13)总结:展望未来的情况Step6.写作模板模脱一①总的趋势②图表具体描述③分析图表所揭示的含义④理由一⑤理由二⑥理由三⑦理由四⑧总结⑨前景预测As can be seen from the table, the past decade has witnessed dramatic changes in①_________ .While ② _______ . It is obvious from the table that® ___________ .What contributed to these changes? I think the reasons are as follows. To start with,④__________.Sec on dly,⑤_____ . What's more,⑥ _________ . Last but not lease,⑦________ .In conclusion,⑧ __________ . Moreover,⑨ _________ .模板二①描述图表②分三方面解释原因③下结论1)During the period from________ to _______ 、_______ rose from _______ to _______ 、while _______ decreased from _______ to _______ .2)We believe that three reasons can account for this phenomenon. First, _____ ・ Second, ___ ・ Third, ___ .3)___ .We are happy to see that things are becoming better and better nowadays. We can imagine that _____ •模板三①描述图表②解释图表③补充解释1)During the period between _______ and ________ , ________ declined abruptly from ________ to _______ , while _________ i ncreased sharply from _________ to _______ .2)Several reasons can account for this phenomenon. Compared with ___________ is much cheaper and more convenient __________ . Apart from that, _________ ・3)However, there are still a number of people who __________ 、generally for two reasons. On the one hand, ________ • On the other hand,________ ・Step7.请你写作(审题,并套用模板)练习一:20套Z16苏锡常镇高三三模练习二:How People Spend Their Holidays1、根据上表,简要描述1990年、1995年、2000年某城市人们度假方式的情况及其变化;2、请说明发生这些变化的原因;3、得出结论。