计量经济学英文版研究报告
英文版greene 计量经济学Ch7
Ch7 单变量时间序列分析7.1. ARMA 建模 1. AR (1)过程t t t y m y εα++=−1t t t m y L A y L εα+==−)()1( t t Ly εαμ−=−11注: "+++=−=−−22111)1()(L L L L A ααα""+++++++=−−2212)1(t t t t m y εααεεαα)1/()(α−=m y E t2221ασσε−=y。
平稳性条件:1<α。
自协方差: 2y k kσαγ= 自相关系数: (拖尾)kk αρ=2. AR (2)过程t t t y m y εα++=−1 )1/()(21αα−−=m y E t)1)(1)(1()1(21212222ααααασασε−+−−+−=y 平稳性条件:(表述1) 12<α 121<+αα112<−αα Yule -Walker 方程: 自协方差: 12011γαγαγ+= 02112γαγαγ+= 自相关系数: 1211ρααρ+= 2112αραρ+=2111ααρ−=, 222121αααρ+−=22113−−>+=k k k ραραρ (拖尾) 滞后算子多项式的根:t t t m y L A y L L εαα+==−−)()1(221 )1)(1()(21L L L A λλ−−=24,221121αααλλ++=Ld L c L L L A 2121111)]1)(1/[(1)(λλλλ−+−=−−=−t t t t t Ld Lc x x y ελελμ212111−+−=+=−两个具有相同扰动的AR(1)过程的叠加。
特征方程:)(1221z A z z =−−αα 根:i i z λ/1= 平稳性条件:(表述2)11>z ,12>z如果出现复根,其模要小于1.即:特征方程的根位于单位园外。
计量经济学实验报告(范例)

计量经济学实验报告专业:姓名:学号:Monthly (月度) Undated or irreqular (未注明日期或不规则的)在本例中是截面数据,选择“Undated or irreqular ”。
并在“observations ”中输入,样本数量如“31”点击“ok ”出现“Workfile UNTITLED ”工作框。
其中已有变量:“c ”—截距项 “resid ”—剩余项。
在“Objects ”菜单中点击“New Objects”,在“N ew Objects”对话框中选“Group”,并在“Name for Objects”上定义文件名,点击“OK ”出现数据编辑窗口。
若要将工作文件存盘,点击窗口上方“Save ”,在“SaveAs ”对话框中给定路径和文件名,再点击“ok ”,文件即被保存。
2、输入数据在数据编辑窗口中,首先按上行键“↑”,这时对应的“obs”字样的空格会自动上跳,在对应列的第二个“obs”有边框的空格键入变量名,如“Y ”,再按下行键“↓”,对因变量名下的列出现“NA ”字样,即可依顺序输入响应的数据。
其他变量的数据也可用类似方法输入。
也可以在EViews 命令框直接键入“data X Y ”(一元时) 或 “data Y 1X 2X … ”(多元时),回车出现“Group”窗口数据编辑框,在对应的Y 、X 下输入数据。
若要对数据存盘,点击 “fire/Save As”,出现“Save As ”对话框,在“Drives ”点所要存的盘,在“Directories ”点存入的路径(文件名),在“Fire Name ”对所存文件命名,或点已存的文件名,再点“ok ”。
若要读取已存盘数据,点击“fire/Open”,在对话框的“Drives”点所存的磁盘名,在“Directories”点文件路径,在“Fire Name”点文件名,点击“ok”即可。
3、估计参数方法一:在EViews 主页界面点击“Quick ”菜单,点击“Estimate Equation ”,出现“Equation specification ”对话框,选OLS 估计,即选击“Least Squares”,键入“Y C X ”,点“ok ”或按回车,即出现如表2那样的回归结果。
计量经济学论文英文
计量经济学论文英文Econometric Analysis of the Relationship between Education and Income1. IntroductionEconomic literature has long recognized the positive relationship between education and income. It is widely believed that individuals with higher levels of education tend to earn higher incomes compared to those with lower educational attainment. This relationship has important implications for understanding the dynamics of income inequality and social mobility.2. Literature ReviewMany studies have attempted to quantify the relationship between education and income using econometric methods. The results of these studies have varied, with some finding a strong positive relationship between the two variables, while others finding a weaker or even non-existent relationship. The inconsistency in findings has prompted further investigation into the determinants of income and the role of education in shaping individuals' earning potential.3. MethodologyIn this study, we use econometric techniques to analyze the relationship between education and income. We use panel data from a nationally representative survey to estimate the effect of education on individuals' income levels. We control for variousindividual and household characteristics, such as age, gender, race, and family background, to isolate the impact of education on income.4. Empirical ResultsOur findings suggest that education has a significant positive effect on income. Individuals with higher levels of education tend to earn substantially higher incomes compared to those with lower educational attainment, even after controlling for other relevant factors. The magnitude of the effect varies across different levels of education, with higher levels of education associated with larger income gains.5. Policy ImplicationsThe results of our analysis have important policy implications. They suggest that investing in education can have a strong positive impact on individuals' earning potential and can help reduce income inequality. Policymakers should consider implementing measures to improve access to quality education and to support individuals in obtaining higher levels of education.6. ConclusionIn conclusion, our econometric analysis provides robust evidence of the positive relationship between education and income. Our findings underscore the importance of education as a driver of economic opportunity and individual prosperity. Policymakers should prioritize investments in education to promote socialmobility and reduce income inequality.7. Limitations and Future ResearchOur study has several limitations that should be considered. First, our analysis is based on cross-sectional data, which limits our ability to establish causality between education and income. Future research could improve upon our study by using longitudinal data to track individuals' income changes over time in response to changes in their education levels.8. Additionally, our analysis may not capture the full range of factors that influence the relationship between education and income. For example, we did not examine the quality of education or the field of study, which can have a significant impact on individuals' earning potential. Future research could explore these nuanced factors to better understand the mechanisms through which education affects income.9. Another important consideration is that our analysis focuses on the individual-level effects of education on income. It is also crucial to examine how education at the aggregate level influences the overall distribution of income and the broader economic outcomes of a society.10. Furthermore, as the labor market evolves and new technologies emerge, the relationship between education and income may change. Future research could explore how the demand for different types of skills and educational credentials is shaping the income landscape in the context of technological advancements and globalization.11. Practical Implications for IndividualsIndividuals can also benefit from understanding the relationship between education and income. Our findings suggest that investing in higher education can significantly increase earning potential. It is important for individuals to consider the long-term benefits of education when making decisions about their educational and career paths.12. ConclusionIn conclusion, our study contributes to the existing literature by providing empirical evidence of the positive relationship between education and income. However, further research is needed to deepen our understanding of this complex relationship, including its causal mechanisms and its implications for the labor market and income distribution. These insights are crucial for informing policy decisions and individual choices related to education and economic well-being.。
计量经济 实验报告三
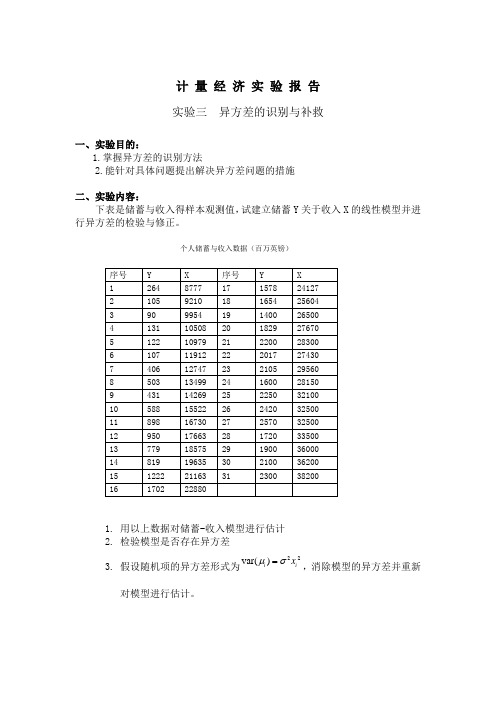
计量经济实验报告实验三异方差的识别与补救一、实验目的:1.掌握异方差的识别方法2.能针对具体问题提出解决异方差问题的措施二、实验内容:下表是储蓄与收入得样本观测值,试建立储蓄Y关于收入X的线性模型并进行异方差的检验与修正。
个人储蓄与收入数据(百万英镑)序号Y X 序号Y X1 264 8777 17 1578 241272 105 9210 18 1654 256043 90 9954 19 1400 265004 131 10508 20 1829 276705 122 10979 21 2200 283006 107 11912 22 2017 274307 406 12747 23 2105 295608 503 13499 24 1600 281509 431 14269 25 2250 3210010 588 15522 26 2420 3250011 898 16730 27 2570 3250012 950 17663 28 1720 3350013 779 18575 29 1900 3600014 819 19635 30 2100 3620015 1222 21163 31 2300 3820016 1702 228801.用以上数据对储蓄-收入模型进行估计2.检验模型是否存在异方差3.假设随机项的异方差形式为22var()i ixμσ=,消除模型的异方差并重新对模型进行估计。
三、实验结果:1、模型估计:Dependent Variable: YMethod: Least SquaresDate: 12/06/13 Time: 16:58Sample: 1 31Included observations: 31Variable Coefficient Std. Error t-Statistic Prob.C -655.9600 124.2692 -5.278540 0.0000X 0.085352 0.005161 16.53779 0.0000R-squared 0.904132 Mean dependent var 1250.323 Adjusted R-squared 0.900826 S.D. dependent var 820.9407 S.E. of regression 258.5299 Akaike info criterion 14.01024 Sum squared resid 1938294. Schwarz criterion 14.10276 Log likelihood -215.1587 F-statistic 273.4984 Durbin-Watson stat 1.039802 Prob(F-statistic) 0.0000002、white检验:White Heteroskedasticity Test:F-statistic 11.18080 Probability 0.000270 Obs*R-squared 13.76465 Probability 0.001026Test Equation:Dependent Variable: RESID^2Method: Least SquaresDate: 12/06/13 Time: 17:00Sample: 1 31Included observations: 31Variable Coefficient Std. Error t-Statistic Prob.C 38802.30 71391.21 0.543516 0.5911X -4.563188 7.025231 -0.649543 0.5213X^2 0.000217 0.000154 1.411320 0.1692R-squared 0.444021 Mean dependent var 62525.62 Adjusted R-squared 0.404308 S.D. dependent var 75015.93S.E. of regression 57898.10 Akaike info criterion 24.86252 Sum squared resid 9.39E+10 Schwarz criterion 25.00130 Log likelihood -382.3691 F-statistic 11.18080 Durbin-Watson stat 1.491234 Prob(F-statistic) 0.0002703、消除模型的异方差并重新对模型进行估计。
计量经济学分析报告

四、提高居民消费水平的对策建议根据以上分析,可以看出提高居民消费水平的根本途径是大力发展生产力。
但在大力发展生产力,1、国内生产总值对居民消费水平的影响为了研究居民消费水平和经济发展水平的关系,我们把国内生产总值作为经济发展水平的代表性指标。
由经济理论分析可知,经济发展水平与居民消费水平有密切关系。
因此,我们设定居民消费水平HCL 与国内生产总值GDP 的关系为: 111μβα++=GDP HCL假定模型中随机误差项1μ满足古典假定,运用OLS 法估计模型参数,结果如下:GDPHCL 0368.02275.93+=(9.2969)(181.1983)其中,可决系数2R =0.9993。
从回归结果可以看出,模型拟合度很好,可决系数很高,这也表明国内生产总值确实对居民消费水平有显著影响。
其中,GDP 每增长1亿元,居民消费水平平均增加0.04元。
案例分析报告一、研究目的陈述所研究的问题内容以及问题的重要性。
随着国民经济的发展,人民收入水平不断提高。
本文运用Eview软件嬉闹模型来研究人均国内生产总值的变化对全国居民消费水平变化的影响。
人均国内生产总值增加,意味着国民经济水平提高,居民收入增加,居民的消费能力提升,消费水平随之提高。
反之,人均国内生产总值减少,居民的收入同步减少,消费水平降低。
当前,大多数国家都致力于提高居民的消费水平,分析研究二者的关系有利于我们更清楚的认识人均国内经济的发展与居民消费水平提高息息相关,从而以提高人均国内经济为出发点,提高居民的消费水平。
促进经济的健康发展。
关键词:人均国内生产总值,居民消费水平,分析通过对我国居民消费水平的历史及现状研究,建立了居民消费水平的经济模型,并研究了模型中主要变量对模型的影响程度,在此基础上提出了提高居民消费水平的对策建议。
二、模型设定提示:给出数据,通过散点图确定适合使用线性模型。
表一:(整理的数据源于中经教育专网)散点图:图一Dependent Variable: YMethod: Least SquaresDate: 04/24/10 Time: 16:29Sample: 1992 2008Included observations: 17Variable Coefficient Std. Error t-Statistic Prob.C 723.2111 102.7522 7.038400 0.0000X 0.336978 0.009308 36.20491 0.0000R-squared 0.988686 Mean dependent var 3930.765 Adjusted R-squared 0.987932 S.D. dependent var 1953.486 S.E. of regression 214.6012 Akaike info criterion 13.68557 Sum squared resid 690804.9 Schwarz criterion 13.78360 Log likelihood -114.3274 F-statistic 1310.795 Durbin-Watson stat 0.181578 Prob(F-statistic) 0.000000用Eviews求出回归模型中的参数三、估计参数图二四、模型检验1、经济意义检验(若建模是依据某个经济理论,检验该参数是否与该经济理论相符,否则解释参数的经济意义)2、拟合优度检验3、参数显著性检验1、经济意义检验由图二可知,全国居民消费水平Y随人均国内生产总值X的一元线性回归方程为Y=723.2111 + 0.336978*X(7.038400) (36.20491)2R=0.988686斜率的经济意义是:在1992——2008年间,中国的人均国内生产总值每增加1元时全国居民消费水平平均增加0.336978元。
eviews计量经济学实验报告
eviews计量经济学实验报告EViews计量经济学实验报告引言计量经济学是经济学领域中的一个重要分支,它运用数学、统计学和计量学的方法来分析经济现象。
EViews是一个常用的计量经济学软件,它提供了丰富的数据分析和模型建立工具,被广泛应用于学术研究和实际经济分析中。
本实验报告将利用EViews软件进行计量经济学实验,以探讨经济现象并得出相关结论。
实验目的本实验旨在利用EViews软件对某一经济现象进行实证分析,通过建立相应的计量经济模型,对经济现象进行量化分析,并得出相关结论。
实验步骤1. 数据收集:首先,我们需要收集与所研究经济现象相关的数据,包括时间序列数据和横截面数据等。
这些数据可以来自于官方统计机构、学术研究机构或者自行收集整理。
2. 数据预处理:接下来,我们需要对收集到的数据进行预处理,包括数据清洗、缺失值处理、异常值处理等,以确保数据的质量和完整性。
3. 模型建立:在数据预处理完成后,我们可以利用EViews软件建立计量经济模型,包括回归分析、时间序列分析、面板数据分析等,以探讨经济现象的内在规律和影响因素。
4. 模型估计:建立模型后,我们需要对模型进行参数估计,得到模型的具体参数估计值,并进行显著性检验和模型拟合度检验,以验证模型的可靠性和有效性。
5. 结果分析:最后,我们将对模型估计结果进行分析,得出与经济现象相关的结论,并对实证分析结果进行解释和讨论。
实验结论通过以上实验步骤,我们得出了关于某一经济现象的实证分析结果,并得出了相关的结论。
这些结论对于理解经济现象的内在规律和制定经济政策具有重要的参考价值。
总结EViews计量经济学实验报告通过利用EViews软件进行实证分析,对经济现象进行了深入探讨,并得出了相关结论。
这些结论对于经济学研究和实际经济分析具有重要的理论和实践意义,为我们深入理解经济现象和推动经济发展提供了重要的参考依据。
EViews软件的应用为我们提供了一个强大的工具,帮助我们更好地理解和分析经济现象,为经济学领域的研究和实践提供了重要的支持和帮助。
计量经济学eviews报告

计量经济学eviews报告在经济学研究中,计量经济学是一个重要的分支领域,它利用数理统计和经济理论方法,对经济现象进行定量分析和预测。
而在进行计量经济学研究时,经济学家们通常会使用eviews软件来进行数据处理和分析。
本报告将对eviews软件在计量经济学研究中的应用进行介绍和分析。
首先,eviews软件作为一款专业的计量经济学软件,具有强大的数据处理和分析功能。
它可以对各种类型的经济数据进行处理,包括时间序列数据、截面数据和面板数据等。
同时,eviews还提供了丰富的统计分析工具,如回归分析、时间序列分析、方差分析等,可以帮助经济学家们快速准确地进行数据分析和模型建立。
其次,eviews软件在计量经济学研究中的应用非常广泛。
在实证研究中,经济学家们通常会使用eviews来进行数据的导入和清洗,然后进行相关的计量分析。
例如,他们可以利用eviews进行回归分析,来探讨不同经济变量之间的关系;也可以利用eviews进行时间序列分析,来预测未来的经济走势。
总之,eviews为经济学家们提供了一个强大的工具,帮助他们更好地进行计量经济学研究。
另外,eviews软件还具有友好的用户界面和丰富的图表展示功能,使得经济学家们可以直观地呈现研究结果。
他们可以通过eviews生成各种统计图表,如散点图、折线图、柱状图等,直观地展示数据之间的关系和变化趋势。
这些图表不仅可以帮助经济学家们更好地理解数据,还可以用于学术论文和研究报告的展示。
总之,eviews软件在计量经济学研究中发挥着重要的作用,它为经济学家们提供了强大的数据处理和分析工具,帮助他们更好地进行实证研究。
未来,随着计量经济学研究的深入发展,相信eviews软件将会继续发挥重要作用,为经济学研究提供更多的便利和支持。
计量经济学eviews实验报告
大连海事大学实验报告Array实验名称:计量经济学软件应用专业班级:财务管理2013-1姓名:安妮指导教师:赵冰茹交通运输管理学院二○一六年十一月一、实验目标学会常用经济计量软件的基本功能,并将其应用在一元线性回归模型的分析中。
具体包括:Eview的安装,样本数据基本统计量计算,一元线性回归模型的建立、检验及结果输出与分析,多元回归模型的建立与分析,异方差、序列相关模型的检验与处理等。
二、实验环境WINDOWSXP或2000操作系统下,基于EVIEWS5.1平台。
三、实验模型建立与分析案例1:我国1995-2014年的人均国民生产总值和居民消费支出的统计资料(此资料来自中华人民共和国统计局网站)如表1所示,做回归分析。
表1我国1995-2014年人均国民生产总值与居民消费水平情况2008年2391287072009年2596395142010年30567109192011年36018131342012年39544146992013年43320161902014年4661217806(1)做出散点图,建立居民消费水平随人均国内生产总值变化的一元线性回归方程,并解释斜率的经济意义;利用eviews软件输出结果报告如下:Dependent Variable: CONSUMPTION Method: Least SquaresDate: 06/11/16 Time: 19:02 Sample: 1995 2014Included observations: 20Variable Coefficient Std. Error t-Statistic Prob.C691.0225113.3920 6.0941040.0000 AVGDP0.3527700.00490871.880540.0000R-squared0.996528Mean dependentvar7351.300Adjusted R-squared0.996335S.D. dependentvar4828.765S.E. of regression292.3118Akaike infocriterion14.28816Sum squared resid1538032.Schwarz criterion14.38773Log likelihood-140.8816Hannan-Quinncriter.14.30760F-statistic5166.811Durbin-Watsonstat0.403709Prob(F-statistic)0.000000由上表可知财政收入随国内生产总值变化的一元线性回归方程为:(令Y=CONSUMPTION,X=AVGDP(此处代表人均GDP))Y = 691.0225+0.352770* X其中斜率0.352770表示国内生产总值每增加一元,人均消费水平增长0.35277元。