高盛估值方法
金融行业中的资产估值技巧

金融行业中的资产估值技巧在金融行业中,资产估值技巧是一项至关重要的任务。
准确的资产估值可以为投资决策提供可靠的依据,帮助投资者更好地认识市场和风险,制定出更为科学合理的策略。
本文将探讨金融行业中的资产估值技巧,并介绍几种常见的估值方法。
一、基本概念资产估值是指根据一定的方法和理论,对金融市场上的各类资产进行估算其价值的过程。
它包括对金融资产和金融负债进行估值,以求得更为真实准确的市场价值。
资产估值对于金融机构、投资者和监管机构来说都具有重要意义,它直接影响到金融市场的稳定运行和投资者的利益保护。
二、常见的资产估值方法1. 市场比较法市场比较法是一种常见的资产估值方法,它通过比较相同或类似特征的资产交易价格,来推断目标资产的市场价值。
这种方法适用于市场上存在相似商品或资产的情况,具有简单、直观的特点。
但是,这种方法对市场交易信息的依赖程度很高,需要有足够的市场数据和交易记录作为依据,在实际应用中也会受到市场不确定性的影响。
2. 收益法收益法是一种基于资产未来现金流量预期的估值方法。
它通过对资产未来现金流量进行估计,并以折现率对这些现金流量进行贴现,从而得出资产的现值。
该方法适用于对未来现金流量预期比较准确的资产,如股票、债券等。
其中,折现率是决定资产价值的重要因素,需要综合考虑市场利率、风险溢价等因素进行确定。
3. 成本法成本法是一种基于资产取得成本的估值方法。
它将资产的价值等同于其取得成本或重新投资成本。
这种方法适用于固定资产等不易参照市场价格的资产,并且不需要对未来现金流进行预测。
然而,成本法并不能反映资产的真实市场价值,因此在实际应用中需要结合其他方法进行综合分析。
三、资产估值技巧1. 数据分析与研究在进行资产估值之前,需要深入了解所涉及资产的相关信息。
这包括对市场、行业和公司的详细调研,并收集、整理、分析相关数据。
通过对数据的深入研究,可以更全面地了解资产的内外部因素,为估值提供可靠的依据。
证券投资的企业估值与财务分析方法

证券投资的企业估值与财务分析方法企业估值是证券投资过程中的核心环节,通过对企业的财务状况和经营能力进行全面评估,确定其价值,为投资者提供决策依据。
本文将介绍证券投资中常用的企业估值方法以及财务分析的重要指标,帮助投资者更好地理解企业价值,做出明智的投资决策。
一、企业估值方法1. 市盈率法市盈率(Price-Earnings Ratio,简称P/E)是指某只股票的市场价格与每股收益之比。
投资者可以通过比较不同企业的市盈率,判断其相对估值。
一般来说,低市盈率意味着股票相对便宜,高市盈率则表示高估。
2. 市净率法市净率(Price-to-Book Ratio,简称P/B)是指某只股票的市场价格与每股净资产之比。
通过比较市净率,投资者可以了解企业的净资产相对于市值的配置情况。
低市净率可能意味着投资价值被低估,而高市净率则表示高估。
3. 贴现现金流法贴现现金流法(Discounted Cash Flow,简称DCF)是一种基于企业未来现金流量来估算其价值的方法。
该方法将企业未来的现金流量贴现回当前价值,考虑了时间价值的因素。
DCF方法需要精确预测企业未来的现金流量,并确定适当的贴现率,是一种相对较为复杂的估值方法。
4. 相对估值法相对估值法是通过将目标企业与同行业其他企业进行比较,评估其相对竞争地位和估值水平。
常用的相对估值指标包括市盈率、市净率、市销率等,将目标企业与同行业的指标进行对比,可以更好地理解其价值。
二、财务分析方法1. 财务比率分析财务比率分析是评估企业财务状况和经营能力的重要工具。
常用的财务比率包括盈利能力比率(如净资产收益率、净利润率)、偿债能力比率(如流动比率、速动比率)、成长能力比率(如营业收入增长率、净利润增长率)等。
通过分析财务比率,可以了解企业的盈利能力、偿债能力以及成长潜力。
2. 现金流量分析现金流量表反映了企业的现金流入和流出情况,是评估企业经营状况和偿债能力的重要依据。
通过分析现金流量表,可以了解企业的经营活动、投资活动和筹资活动情况,判断企业的现金流量稳定性和支付能力。
顶级投行培训资料-高盛估值培训中文版(PPT 74页)

稳态期 ➢增速=行业增速
=GDP增长 ➢投资收益率
=资金成本
模型最重要控制地带
18
1.2.2.3 增长模式的决定要素
现金流增长 模式
盈利能力 公司生命 周期
成长性
投资率
公司竞争 优势
行业生命周期 需求
市场结构
供给
19
1.2.2.4 行业生命周期与公司生命周期
o 决定行业生命周期的关键因 素:需求波动及供给速度
内在价值是资产未来预期产生的现金流的贴现值之和。
1 0.9 0.8 0.7 0.6 0.5 0.4 0.3 0.2 0.1
0 1 2 3 4 5 6 7 8 9 10 11 12 13 14 15 16 17 18 19 20 21 22 23
2
1.1.1 现金流的获得方式与价值的形态
✓ 现金流获得的方式 利润:这是价值实现的最主要方式。企业经营者通过长期的持续经营创造
3 2.5
1 2 3 4 5 6 7 8 9 10 11 12 13 14 15 16
国债到期收益率(%) 24
1.2.3.1 股权风险溢价(ERP)
➢ 决定股票市场风险溢价的基本因素有三个
所在经济体的经济波动。 所在经济体的政治风险。 市场结构。如果在交易所挂牌的公司规模大,行业多样化且较为稳定, 股票风险溢价就会比较低。
27
1.2.3.2 回归方法计算beta
可选项
机构
计算方法 数据频率
回归计算时间段
基准指数
备注
股票所在地的主要股
二元线性回
用户自定义,缺省值为24 指(例如美国为 股票收益率不进行
Bloomberg
归
周收盘数据
高盛esg评价体系
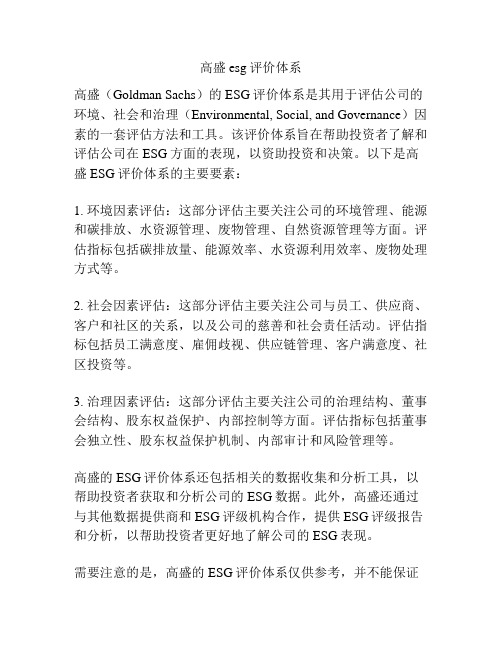
高盛esg评价体系
高盛(Goldman Sachs)的ESG评价体系是其用于评估公司的环境、社会和治理(Environmental, Social, and Governance)因素的一套评估方法和工具。
该评价体系旨在帮助投资者了解和评估公司在ESG方面的表现,以资助投资和决策。
以下是高盛ESG评价体系的主要要素:
1. 环境因素评估:这部分评估主要关注公司的环境管理、能源和碳排放、水资源管理、废物管理、自然资源管理等方面。
评估指标包括碳排放量、能源效率、水资源利用效率、废物处理方式等。
2. 社会因素评估:这部分评估主要关注公司与员工、供应商、客户和社区的关系,以及公司的慈善和社会责任活动。
评估指标包括员工满意度、雇佣歧视、供应链管理、客户满意度、社区投资等。
3. 治理因素评估:这部分评估主要关注公司的治理结构、董事会结构、股东权益保护、内部控制等方面。
评估指标包括董事会独立性、股东权益保护机制、内部审计和风险管理等。
高盛的ESG评价体系还包括相关的数据收集和分析工具,以帮助投资者获取和分析公司的ESG数据。
此外,高盛还通过与其他数据提供商和ESG评级机构合作,提供ESG评级报告和分析,以帮助投资者更好地了解公司的ESG表现。
需要注意的是,高盛的ESG评价体系仅供参考,并不能保证
公司的ESG表现和可持续发展的长期业绩。
投资者应该综合考虑多方面的因素,并进行适当的尽职调查,以做出明智的投资决策。
高盛银行估值报告内容

高盛银行估值报告内容
高盛银行的估值报告通常包含以下内容:
1. 历史财务数据分析:包括高盛银行过去几年的收入、利润、资产负债表和现金流量等财务指标的分析。
这有助于评估高盛银行的财务表现和趋势。
2. 产业和市场分析:对全球银行业和金融市场的概览和分析,了解高盛银行所处的竞争环境、市场机会和风险。
这包括对行业趋势、监管政策和市场参与者的研究。
3. 估值模型:使用不同的估值模型(如股票市盈率、市净率、现金流折现等)对高盛银行进行估值。
这些模型将考虑公司的未来收益和现金流量预测以及相关的风险因素。
4. 盈利预测和展望:根据分析师的预测和产业趋势,对高盛银行未来几年的盈利情况进行预测,包括收入增长、利润率、市场份额等。
5. 风险评估:对高盛银行面临的各种风险进行评估,包括市场风险、信用风险、操作风险等。
这有助于投资者了解高盛银行可能面临的潜在问题和挑战。
6. 潜在投资机会:根据估值和风险评估,报告可能提供一些投资建议和观点,如是否应该购买、持有或卖出高盛银行的股票。
请注意,估值报告的具体内容可能会因为不同的编制机构、分
析师和市场条件而有所不同。
每个估值报告都应根据特定的投资目标和背景进行研究和评估。
高盛-经典估值模型

2007E 39.50% 72.20%
0.05% 7.49% 4.39% 32.73% 18.95%
2007E 22.26%
33.36
3.54 165.61
82.27
37.36 2.65% 0.00% 3.65% -0.09%
0.00%
0.00%
0.00%
0.00%
0.00% 0.00% 0.00% 0.00% 1.29% 0.00%
a、假定固定资产采用直线法折旧 b、现有固定资产和新建固定资产的折旧年限平均为
残值率为 5.00%
年折旧率=
12
年
7.92%
2006E 22.26%
33.36
3.54 165.61
82.27
37.36 2.65% 0.00% 3.65% -0.09%
0.00%
0.00%
0.00%
0.00%
0.00% 0.00% 0.00% 0.00% 1.29% 0.00%
一般情 景预测 1、经 营活动
主营业务收入同比增长率
主营业务成本 /主营业务收入
主营业务税金及附加 /主营业务收入 (营业税率)
营业费用 /主营业务收入
管理费用 /主营业务收入
实际税率
股利分配比例
2004 24.39% 74.20%
0.04% 7.68% 4.56% 33.84% 10.48%
2005 41.47% 77.78%
预计银行长期贷款增加额(万元)
22.26% 6.00% 5.50% 1.35%
2004 420.00
2005 1,830.00
2006E 1,500.00
2007E 0.00
投资机构对企业的五种估值方法

投资机构对企业的五种估值方法我们将该系列文章分享给大家,用案例现身说法,为大家介绍在私募股权投资中使用的以下五种估值方法:风险收益法,比较法,净现值法,调整后现值法和期权估值法。
该系列文章主要供高成长企业参考,我们先来看这类企业在进行融资时通常会暴露出的一些问题:比较长的一段时期负向现金流,业务情况具有高度不确定性,但预期未来回报十分诱人。
抛开纷繁芜杂的各种表象不谈,不论是何种项目,它未来回报的正向现金流是所有估值假定的基础。
一、风险收益法:A同学是秀红资本的合伙人,他在2013年发现并跟进了“二百六”科技有限公司。
该公司自称是由多名拥有海外留学背景的高学历人才创立的一家致力于X产业的高科技企业。
经过一段时间实际考察,A同学和“二百六”科技的管理层达成投资意向,代表秀红资本期望获得20-30%左右的股权(关于普通股和优先股的问题,结合投票权又涉及比较复杂的投资模型和不同国家地区的法律和监管适配,本文一律以普通股作为投资标的),根据投资额的不同,可以浮动。
而“二百六”科技需要的资本额大致在2000万到4000万之间,而经过秀红资本的内部讨论,其认可的现金出资额度大致在3000万元,然后A同学负责实施,计划在2014年投资3000万元人民币至“二百六”科技。
他正在考虑应该要求一个多大的股权份额并进行谈判。
双方大致认可如下事实:公司可以长期正常运营,虽然几年内亏损但是业务能够持续增长,不过即使公司未来可以赚无数的钱,双方讨论决定以第5年的预测数据亿元人民币利润做为评估基础。
而目前市场上为数不多,但一直盈利的该行业同等规模类似的非上市企业平均市盈率为15倍. 现在“二百六”科技有2千万股由多名管理层和原始投资人持有,以此标的进行增资扩股进行投前估值和投后估值的计算。
出于对3000万元投资所面对的风险,A同学坚持要求至少50%的目标回报率。
随后做出以下计算:结论:投入3000万现金,持有投后公司25%的普通股。
投资企业的14种估值方法与10种常用方法
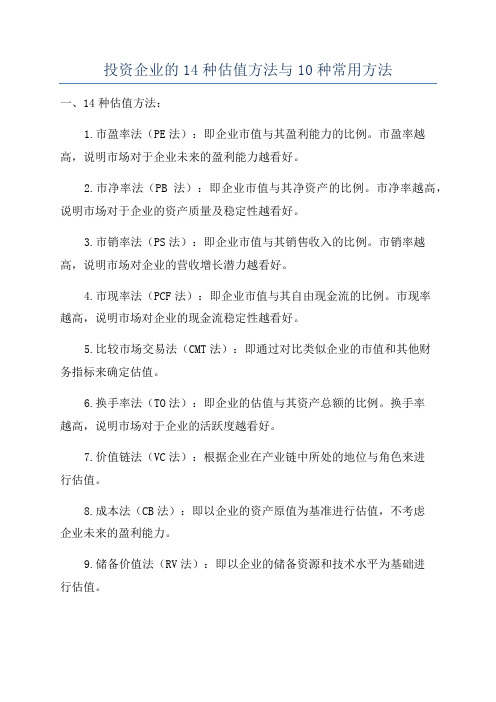
投资企业的14种估值方法与10种常用方法一、14种估值方法:1.市盈率法(PE法):即企业市值与其盈利能力的比例。
市盈率越高,说明市场对于企业未来的盈利能力越看好。
2.市净率法(PB法):即企业市值与其净资产的比例。
市净率越高,说明市场对于企业的资产质量及稳定性越看好。
3.市销率法(PS法):即企业市值与其销售收入的比例。
市销率越高,说明市场对企业的营收增长潜力越看好。
4.市现率法(PCF法):即企业市值与其自由现金流的比例。
市现率越高,说明市场对企业的现金流稳定性越看好。
5.比较市场交易法(CMT法):即通过对比类似企业的市值和其他财务指标来确定估值。
6.换手率法(TO法):即企业的估值与其资产总额的比例。
换手率越高,说明市场对于企业的活跃度越看好。
7.价值链法(VC法):根据企业在产业链中所处的地位与角色来进行估值。
8.成本法(CB法):即以企业的资产原值为基准进行估值,不考虑企业未来的盈利能力。
9.储备价值法(RV法):即以企业的储备资源和技术水平为基础进行估值。
10.税后净现值法(NPV法):以企业的未来现金流入流出作为基础,考虑税后净现金流的折现率,计算出企业的净现值。
11.收益法(IRR法):以企业投资回报率为基础,计算出项目的内部收益率。
12.资本资产定价模型(CAPM法):考虑了企业的风险,通过计算企业所需的资本成本来确定估值。
13.EVA法:以经济附加值为基础,计算企业的价值增值能力。
14.DCF法:以企业的未来现金流为基础,考虑折现率计算企业的价值。
二、10种常用方法:1.盈利能力分析:分析企业的营业收入和净利润的增长情况。
2.资产质量分析:分析企业的资产负债状况和资产结构。
3.相对估值法:通过对比企业与同行业的其他企业的估值指标来确定估值。
4.直接估值法:通过企业自身的财务数据来确定估值。
5.未来现金流预测法:根据企业未来几年的现金流预测来确定估值。
6.企业成长性分析:分析企业的市场、产品和技术等成长性因素。
- 1、下载文档前请自行甄别文档内容的完整性,平台不提供额外的编辑、内容补充、找答案等附加服务。
- 2、"仅部分预览"的文档,不可在线预览部分如存在完整性等问题,可反馈申请退款(可完整预览的文档不适用该条件!)。
- 3、如文档侵犯您的权益,请联系客服反馈,我们会尽快为您处理(人工客服工作时间:9:00-18:30)。
PortfolioStrategyA valuation anchor for EquitiesWe introduce GS DDM, a new approach to valuing equity marketsglobally, to sit alongside our other regional valuation models. We takethree approaches to fair value: 1) Fair Value under our current centralassumptions, applying current bond yields and estimated ERP. 2) FairValue adjusted for current ‘fair value’ bond yields using our Sudokubond model. 3) Equilibrium Value, assuming the ERP and bond yieldsrevert to long run averages.Estimating 'fair value' using a DDMIn Part I we develop a model that: 1) is estimated in the same way ineach major region to establish a benchmark for ‘fair value’; 2) lendsitself to reverse engineering – assessing what assumptions the marketis ‘implying’. We look at the sensitivity of fair values to changes in theunderlying assumptions. In our forthcoming Part II, we will extend thisanalysis to forecast the ERP and market levels.Substantial undervaluation from 'equilibrium'Our analysis shows that, using current central assumptions, mostmarkets are undervalued by between 3% and 15% with Europe themost undervalued. Using our ‘fair value’ Sudoku bond yieldassumptions instead of current yields increases the undervaluation inall regions. In all cases, an assessment of ‘equilibrium’ valuation, basedon assuming the ERP reverts to a long run average and using a longrun ‘trend’ real yield of 2% shows substantial undervaluation of 71% forEurope, 36% in the US, 31% in Asia ex Japan and 13% in Japan.Fair value and upside/(downside)Ce n tra l S ce n a rio Usin g S u do ku Fa irV a lu e Bo nd m od e lUsin g e qu ilib riu m ERP* a n d2% re a l in te re st ra teCu rre n t Le ve lFa irV a lu eL e ve lF a ir V a lu eUpsid e /(Do w nsid e)F a irV a lueL e ve lFa ir V a lu eUp sid e /(Dow n sid e)F a ir V a lueLe ve lF a ir V a lu eUpsid e /(Do w nsid e)US (S&P 500)84694111%94312%115236% Eu ro p e (S to x x 600)19522415%27441%33371% Ja pa n (T O P IX)7868093%91616%88613% Asia (M S CI AP x J)2662774%NA NA34931%* We estimate equilibrium ERP at 3% for all regions (4% for Asia).Source: Goldman Sachs Global ECS Research. Peter Oppenheimer+44(20)7552-5782 | peter.oppenheimer@ Goldman Sachs InternationalJessica Binder, CFA+44(20)7051-0460 | jessica.binder@ Goldman Sachs InternationalAnders Nielsen+44(20)7552-3000 | anders.e.nielsen@ Goldman Sachs InternationalGerald Moser+44(20)7774-5725 | gerald.moser@ Goldman Sachs InternationalSharon Bell, CFA+44(20)7552-1341 | sharon.bell@ Goldman Sachs InternationalThe Goldman Sachs Group, Inc. does and seeks to do business with companies covered in its research reports. As a result, investors should be aware that the firm may have a conflict of interest that could affect the objectivity of this report. Investors should consider this report as only a single factor in making their investment decision. For Reg AC certification, see the end of the text. Other important disclosures follow the Reg AC certification, or go to /research/hedge.html. Analysts employed by non-US affiliates are not registered/qualified as research analysts with FINRA in the U.S.Executive summary• We introduce a 4-stage dividend discount model that is estimated in the same way ineach major region. This is used as a valuation anchor for international comparison. •In generating results from GS DDM, we have taken three approaches. 1) ‘Fair value’ today using our central scenario (how should we think of equities relative to current bond yields?). 2) ‘Fair value’ today using ‘fair value’ bond yields, based on our Sudoku model (how should we think of equities assuming bonds were fairly valued in the current environment?). 3) ‘Equilibrium value’ using long run average real bond yields and ERP (how much of the current valuation gap is due to the fact that the discount rate is higher/lower than normal?).•We estimate that the upside to ‘fair value’ given the current economicenvironment and bond yields is, 15% in Europe, 11% in the US, 4% in Asia ex Japan and 3% in Japan .• Adjusting the ‘fair value’ for current ‘fair value’ bond yields increases the undervaluation in all equity markets.•On a long run ‘Equilibrium Value’ basis we find an upside to fair value of 71% in Europe, 36% in the US, 31% in Asia ex Japan and 13% in Japan. We estimate the upside to long run equilibrium fair value by using a real interest rate of 2% and an equity risk premium of 3% (except in Asia ex Japan where we use 4%) in our dividend discount model.•Exhibit 2 shows that the deviation of market values from long runequilibrium levels tend to close over time. One percentage point of additional upside to fair value at the beginning of the year on average increases the total return during the year by 0.3 percentage points (Exhibit 3). Exhibit 3 also shows that the upside to fair value explains 15% of the variation in yearly returns.Exhibit 1: GS DDM “fair-value” and “equilibrium” levelsCe ntra l S ce na rioUsing S udoku Fa ir V a lue Bond m ode l Using e quilibrium ERP * a nd2% re a l inte re st ra te Curre nt Le ve l Fa ir V a lue Le ve l Fa ir V a lue Upside / (Dow nside )Fa ir V a lue Le ve l Fa ir V a lue Upside / (Dow nside )Fa ir V a lue Le ve lFa ir V a lue Upside / (Dow nside )US (S &P 500)84694111%94312%115236%Europe (S tox x 600)19522415%27441%33371%Ja pa n (TO P IX )7868093%91616%88613%Asia (M S CI AP x J)2662774%NANA34931%Source: Goldman Sachs Global ECS Research.Exhibit 2: S&P 500 reverts to fair value over timeExhibit 3: Deviations from fair value predicts returns-60%-40%-20%0%20%40%60%Jan-89Jan-92Jan-95Jan-98Jan-01Jan-04Jan-07UndervaluedOvervalued-50-40-30-20-1001020304050-60-40-202040Upside to lo ng run fair value (%)R e t u r n o v e r t h e n e x t y e a r (%)Source: Datastream, Haver analytics, Goldman Sachs Global ECS ResearchSource: Factset, Haver analytics, Goldman Sachs Global ECS ResearchFinding a ‘fair value’ anchor for equities; Introducing GS DDMValuing equity markets is always controversial because any chosen approach relies onassumptions. Equally, valuation is not the only driver of markets. Markets can stay aboveor below theoretical ‘fair’ value for long periods of time. Nevertheless, using a standard,easily comparable, valuation model that provides an ‘anchor’ to fair value and can be usedto compare across markets can help to identify opportunities and risks; it can also be usedas a forecasting tool. At the very least, it might also shed some light on the kinds ofassumptions that implicitly need to be made in order to justify deviations from equilibriumvaluation over time.Across the regions, GS Strategists use a variety of different tools and measures to assessvalue. The importance given to any particular approach varies by region and over time,according to the structure of the market and the stage of the cycle. Our interest here wasnot to replace these models but to supplement them with a single approach that can beapplied globally, providing a guide to ‘fair value’ using an assessment of current driversand also as a guide to ‘equilibrium’ – the fair value level of the market assuming that theEquity Risk Premium converges to the long run average and real bond yields are at theirlong run trend.Two approaches to valuationWe introduce a common basis for the global valuation of equities with GS DDM (dividenddiscount model). In each region, we monitor and forecast with several different types ofvaluation tools. These include earnings based multiples (cyclically adjusted), dividend andfree cash flow yields, book valuations, relative valuations against competing assets and anumber of other approaches. For each market we also have a dividend or earningsdiscount model.However, many of these models are used as a guide to valuing the market in isolation atany time, rather than to compare across markets or focus on an intrinsic ‘fair value’.Across the Global Economics, Strategy and Commodities Research Group (ECS) we have,over time, developed a number of valuation tools intended to generate a measure of‘equilibrium’ value for each asset class. These can be thought of not so much as a specificforecast for a market but more as a valuation ‘anchor’. The advantage of these is that theycan provide useful warning signals when markets become very stretched relative to theunderlying fundamentals. Furthermore, they provide a framework for understanding whatkinds of assumptions investors would need to make at any time to justify current marketlevels if they are significantly away from fair value.These models include our Sudoku model for the bond markets and GSDEER for foreignexchange markets. In this paper we highlight a new dividend discount model approachthat we have developed with the aim of providing an internationally comparable valuationanchor for equities.In effect there are two ‘approaches’ to equity valuation models, both of which we introducein a new approach to valuing equity markets globally.• A ‘fair value’ approach: by fixing specific inputs, such as the equity risk premia, onecan back out a ‘fair value’; this approach is helpful in providing a valuation anchor.• A ‘forecast’ approach: using a fair value to generate an expected future price level.Valuation as a ‘fair value’ guideOur intention in this paper, Part I of a two part series, is the following.•To have a model that is estimated in the same way in each major region so that aconsistent benchmark for ‘fair value’ can be established. In this way we can comparevaluations across regions and also relative to history.•Develop an approach that lends itself to reverse engineering – assessing whatassumptions the market is ‘implying’. This can be particularly useful at turning pointsor periods when the market appears to have deviated materially from ‘fair value’. If amarket appears expensive, then what kinds of assumptions would be required in orderto justify such valuations?•To generate an assessment of ‘Fair Value’ for the market by applying assumptionsabout it (bond yields, ERP, earnings etc).•To establish an ‘Equilibrium Level’ level for the markets by assessing the ‘fair value’assuming that the ERP converges to a long run average level and real bond yields areat their long term trend.Valuation as a forecast toolThe forecast returns approach attempts to assess how quickly the convergence of prices tofair value is likely to happen. In a separate report, Part II of our Valuation series, we intendto invert the fair value model presented in this paper to back out the ERP required toequate market levels to the theoretical fair value. By doing this at different points in timewe generate a time series of the implied equity risk premium. We then analyze therelationship of the premium with macroeconomic variables, allowing us to forecast theERP and, therefore, market levels.Setting out the frameworkWe considered several valuation approaches to find the one that might be useful for thisexercise. One distinction when comparing valuation tools is whether to value the equity orthe enterprise value, another is to consider models based on cash flows, returns ormultiples.Cash flow models focus on cash flow to equity holders – dividends or flows to equity anddebt holders – free cash flow. Returns models focus on the capital stock and the spreadbetween the return and the cost of capital.For the purposes of this exercise we focus on equity holders and are interested in adiscount model rather than a multiple model so that we can more easily test assumptionsand scenarios when markets deviate from ‘equilibrium’. It is for this reason that we settledon a DDM approach. The model that we have chosen covers the US (S&P 500), Europe (DJStoxx 600), Japan (TOPIX) and Asia (MSCI Asia-Pacific ex Japan).The model is based on four ‘phases’ and assumes that a proportion of earnings are paidout each year as dividends. The length of the phases and the proportion of value for theS&P 500 index that falls in each phase are given in Exhibit 4.Exhibit 4:Model time linePhase I Phase II Phase III Phase IVFinancial years% of total value5%5%23%67%Source: Goldman Sachs Global ECS Research.Phase I: Forecast growth – years 1 and 2We use our top-down estimates for operating earnings growth for year 1 and year 2. For each year, we adjust the previous year’s payout ratio by a factor that relates to the forecast growth rate (for example if earnings are expected to rise rapidly, we assume that last year’s payout ratio falls moderately as dividends are more stable than earnings).Phase II: Fade to trend ROE – years 3 and 4We assume that the market gets back to trend ROE by the end of year 4 and that the earnings change to achieve this occurs equally over the two years. In a normal part of the cycle this may not result in very different growth in earnings from an average year but at major turning points it could result in quite a large jump in growth in either direction. Having an assumption that gets back to a long-term trend is important. Without it, for example, a model could imply ongoing growth from an unsustainably high (or low) level following a boom (or collapse) in profits. Growing from an unsustainable high or low level of profits would alter the implied fair value materially.Phase III: Long-term growth rate – years 5-20We assume that profits grow at their trend rate of growth (equal to the long-term real economic growth rate plus inflation) but assume that the proportion paid out by companies over this period equals the average of the past 5 years.Phase IV: The terminal valueWe assume that any profits growth in perpetuity is offset by a commensurate change in the payout ratio; this way we ensure that the return on equity is equal to the cost of equity and profits grow in line with trend real GDP.Other key assumptions for current ‘fair value’In order to calculate a fair value, we also need estimates for the following.•Risk-free rate: We use the current 10-year bond yield for each of the regions (for Asia we use a cap-weighted average).•Inflation: We have settled on a 5-year moving average of core inflation as the most stable and consistent measure of “expected future” inflation that is easily measurable in each region.•ERP: While we intend to model the ERP separately in our valuation ‘forecast’ paper, we cannot use the results of that model as an input into the DDM because it becomes circular (the DDM ‘fair values’ are used to extract the historical series of ERP).Consequently, we are constrained to making an assumption for the ERP in this model.This is an important limitation since we cannot observe the required ERP directly at any time. For the purposes of our central assumptions used in our assessment ofcurrent ‘fair value’, we make an assessment about the current appetite for risk, and chose an ERP by reference to the long run ERP series from our ERP model (to bediscussed in detail in a follow up report). Currently, for example, we use an ERP of 5%for the developed markets and 6% for Asia, which is in the top quartile of the historical distribution. While changing the assumption for the ERP can make big differences to the output of the model, we examine the sensitivities to these assumptions later in this report. While we do make an assumption about the ERP for our central caseassessment of fair value, we also assess the ‘equilibrium’ level of the market byassuming the ERP and real bond yields are at their long run average.All the assumptions are summarized in Exhibit 5:Exhibit 5:Summary of assumptions for our central scenarioEarningsFY1-5%-16%-37%-15%FY231%8%-3%17%FY33%3%9%5%FY43%3%8%5%Payout RatioFY141%54%67%40%FY238%54%48%38%FY339%56%43%38%FY440%58%39%38%Year 5-2032%41%34%35%ROE14%13%6%15%Long termInflation2%2%1%4%Real Growth3%3%2%4%10 year bond3%3%1%5%ERP5%5%5%6%Source: Goldman Sachs Global ECS Research.What the model says nowIn generating results from GS DDM, we have taken three approaches.1. ‘Fair Value’ today using our central scenarioSuppose the bond markets are right and the ERP is where we think it belongs in this kindof environment, where would you expect fair value for stocks to be? (How should we thinkof equities relative to current bond yields)2. ‘Fair Value’ today using ‘fair value’ bond yields (based on our Sudoku model)Suppose the bond markets are themselves at fair value and the ERP is where we think itshould be, where would you expect fair value for stocks to be? (How should we think ofequities assuming bonds were fairly valued in the current environment)3. ‘Equilibrium Value’Suppose the discount rate (both the real bond yield and ERP) was at its average historicallevel, where would you expect fair value for stocks to be? (How much of the currentvaluation gap is due to the fact that the discount rate is higher than or lower than normal).Fair Value under central scenarioTaking the final results form our model, explained in more detail below, the ‘fair value’central scenario levels and percentage upside currently are shown in Exhibit 6.Exhibit 6:DDM equity ‘fair value’ based on central scenarioCurre nt Le ve lFa irV a lueLe ve lFa ir V a lueUpside /(Dow nside)US (S&P 500)84694111%E urope (S tox x 600)19522415%Japan (TO P IX)7868093%A s ia (M S CI A P x J)2662774%Source: Goldman Sachs Global ECS Research.All four markets are trading below fair value but the upside is limited. This is because the valuation is taking into account the current weak economic environment by using an equity risk premium of 5% for all markets except Asia ex Japan, where we use 6%. The upside to fair value is substantially higher if economic assumptions consistent with long run equilibrium are used. Under such assumptions the upside to the European market is 71% for example (see further discussion of this below).This analysis is in line with other work from Goldman Sachs strategists, where we have argued that markets are currently attractively valued but that other criteria are needed to be satisfied in order for that value to be unlocked. Specifically, risk premia need to be reduced.In recent work, many of our strategists have written about conditions that may need to change in order for the long term fair value to be unlocked in a sustained recovery. We believe three key criteria are the following.•Evidence that economic activity is stabilizing. In this regard we focus on our proprietary indicators such as the GLI and the Financial Conditions Index (as ameasure of policy efficacy) as a guide to a shift in the first and second derivative of growth.•We also expect to see evidence of the market absorbing disappointing data, both macro economic and company specific, without a negative price reaction.•We have argued that an improvement in the credit markets is also required as a prerequisite for a sustained recovery in equities since, on a risk adjusted basis, parts of the credit market have overshot fair value even more than equities (see for example our report of November 14, 2008, Strategy Matters: Credit versus equity: Credit offers better value). Again, in this regard, recent improvements in our Financial DistressIndex are also encouraging.Fair Value, adjusting for Sudoku ‘fair value’ bond yieldsOne of the issues that may affect the current fair value of equities is the bond yield. In the central case assumptions that we have used in the fair value levels shown in Exhibit 6, we applied the current 10-year bond yields as our risk free rate. In practice this gives some advantage to the US where real rates are much lower. Some investors argue that it is the bond market that is ‘mis-priced’ (particularly given growing supply risk) and that this distorts equity valuation measures that use the bond yield as an input. Our bond strategists do not believe this to be the case (see Bond Snapshot January 26, 2009) but as a cross check, we also show the current equity ‘fair values’, based on our fundamental assessment of ‘fair value’ in the bond market using the results of our Sudoku bond fair value model. While we do not have estimates for Asia, the conclusions are broadly the same for equities in general: equity markets are currently attractively valued. Europe’s fair value upside, in particular, rises sharply to 30% when we apply our fair value bond estimates.Exhibit 7:DDM equity ‘fair value’ based on Sudoku bond modelCurre nt Bond Yie ld Fa ir V a lueUpside /(Dow nside)S udokuBondYie ldFa ir V a lueUpside /(Dow nside)US(S&P500) 2.9%11% 2.9%13% E urope (S tox x 600) 3.5%15% 2.6%30% Japan (TOP IX) 1.3%3%0.9%16% A s ia (M S CI A P x J) 4.9%4%NA NA Source: Goldman Sachs Global ECS Research.Establishing a long run ‘Equilibrium Value’In the above ‘fair value’ calculations, we use current bond yields (or those adjusted by our ‘fair value model) and an assessment about current risk appetite. As discussed above, probably the most controversial input into this model is the ERP. In the central assumptions we plug in an ERP that relates to a band in relation to long run averages. If we think that uncertainty is high (as we do currently) we input an ERP in the highest quartile of historical patterns and vice versa when the market is trending and growth is robust. The advantage of this approach is that it gives an idea about what fair value is at the moment by using an ERP that is reasonable given the current economic environment.Arguably, however, this adds a further layer of subjectivity. We can think of two sensible alternatives that help pin down this issue, which each illuminate different issues. The first is to try to model more formally what an appropriate ERP "should" be given a particular economic environment. This is one of the things our follow up report: Part II will address. The second is to think about what the fair value of the market would be if economic conditions were to reach long run equilibrium. We consider an ERP of 3% and a real bond yield of 2% as reasonable benchmark case. Using those assumptions, Exhibit 8 shows how fair value has fluctuated over time.Exhibit 8: GS DDM, US equilibrium value% deviation form ‘fair value’ assuming fixed ERP at 3% and real bond yield of 2%-60%-40%-20%0%20%40%60%Jan-89Jan-92Jan-95Jan-98Jan-01Jan-04Jan-07Undervalued OvervaluedSource: Datastream, Haver analytics, Goldman Sachs Global ECS Research.While we do not explicitly use the deviation from equilibrium fair value as a forecasting tool, a good measure of equilibrium fair value should have the property that market values tend to move towards the equilibrium value over time. Exhibit 9 shows the yearly return of the S&P 500 index plotted against the deviation from long run fair value at the beginning of the year. The R 2 shows that 15% of the variation in yearly returns over time can beexplained by the market’s deviation from fair value at the beginning of the year. The slope coefficients shows that for each 1 percentage point increase in upside to equilibrium fair value at the beginning of the year, returns during the year increase by 0.3 percentage points.Exhibit 9:Returns are higher when the upside to fair value is large at the start of the year-50-40-30-20-1001020304050-50-40-30-20-1010203040Upside to long run fair value (%)R e t u r n o v e r t h e n e x t y e a r (%)Source: Factset, Haver analytics, Goldman Sachs Global ECS ResearchComparison of approachesThe three approaches are compared in Exhibit 10.•On current assumptions, all markets are undervalued, with the Europe being the most attractive and Japan and Asia the closest to fair value.•By applying an assessment of current ‘fair value’ bond yields as defined by our Sudoku model, the broad conclusions remain the same though the undervaluation of European equities becomes significantly larger.•Assuming the ERP (which we believe is currently unusually high) reverts to a long run average of 3% in the developed markets and 4% in Asia and using a trend average real bond yield, all markets are substantially undervalued. The range of undervaluation is from 13% in Japan to 71% in Europe.Exhibit 10:Fair value and upside/(downside)Ce ntra l S ce na rio Using S udoku Fa irV a lue Bond m ode lUsing e quilibrium ERP* a nd2% re a l inte re st ra teCurre nt Le ve lFa irV a lueLe ve lFa ir V a lueUpside /(Dow nside)Fa irV a lueLe ve lFa ir V a lueUpside /(Dow nside)Fa ir V a lueLe ve lFa ir V a lueUpside /(Dow nside)US (S&P 500)84694111%94312%115236%Europe (S tox x 600)19522415%27441%33371%Ja pa n (TO P IX)7868093%91616%88613%Asia (M S CI AP x J)2662774%NA NA34931%* We estimate equilibrium ERP at 3% for all regions (4% for Asia)Source: Goldman Sachs Global ECS Research.Sensitivities to assumptionsWhile the model helps to identify the potential upside or downside to ‘fair value’, it is verysensitive to changes in inputs and structure. But how much do changing assumptionsmatter and which variables are the most sensitive? In the section we examine theseassumptions and sensitivities in more detail.Near-term earnings expectations Phase IHow do you measure earnings?The first phase of the model is an explicit forecast period based on our own top downoperating profit assumptions generated from our regional profit models (details can beobtained on request). We assume that earnings revert to the historical trend rate of growthby the end of 2012 (Phase II).Exhibit 11: Short-term earnings growth expectationsFY indicates fiscal year. For Europe, US and Asia, fiscal years end December 31. For Japan,fiscal years end March 31.Earnings growth assumptionsFY1FY2FY3 and FY4CAGR Trend ROE US-5%31%3%14%Europe -16%8%3%13%Japan -37%-3%8%6%Asia-15%17%5%15%Source: Goldman Sachs Global ECS Research.Given how the model is set up, changes in near-term earnings expectations do not affectfair value to a very large extent, since we assume that earnings recover to trend by the end of the fourth year in the model. Exhibit 12 shows the impact on fair value in Europe, as an example, of changes in the assumptions for earnings growth in fiscal years 1 and 2 (out to 2010).Our current assumptions for the DJ STOXX 600 are for operating profits to fall 16% this year and to rise by 8% in 2010. As with many other markets, these numbers may be heavily distorted by financials for this year. For example, our top down model assumes that financial earnings rise by 29% this year after a fall of 47% in 2008 (mainly as a result of lower writedowns). However, we do not have much confidence in these numbers given the uncertainty over banks writedowns currently. Excluding financials, we assume earnings fall 30% this year. If we assume that this is true for the market as a whole, and the recovery in 2009 is still 8% from that lower level, it implies that the market is close to fair value (10% upside).Exhibit 12: Sensitivity of fair value for European market to short-term earnings forecasts shading represents current estimatesN o m i n a l F Y 1 e a r n i n g s g r o w t hSource: Goldman Sachs Global ECS Research。