(复杂系统的性能评价与优化课件资料)OverviewOfOrdinalOptimization
(复杂系统的性能评价与优化课件资料)overview_lecture
e2 e3 e4
e5
e6
time
17
Comparison with a CVDS Trajectory
Discrete state
dx/dt = f(x,u,t)
time Hybrid System: each state can hide CVDS behavior 18
Modeling Ingredients
• Discrete States: combinatorial explosion • Stochastic Effects: unavoidable uncertainty • Continuous time and performance measure • Dynamical: • Hierarchical: • Computational vs conceptual
Untimed Timed
Finite State
Machines & Petri Nets
Finitely Recursive Processes
Min-Max Algebra
Generalized Semi-Markov
Processes
GOAL: Finite representation. Qualitative properties, Quantitative Performance
New
Generate
state
lifetime of
new event
Place the event in the future event list
Search for next event to occur
Transition to next state
系统调优与性能评估设计分析

Introduction系统调优与性能评估设计分析是计算机领域中非常重要的概念和技术,它们可以帮助我们优化系统的性能,提高计算机的运行效率和响应速度。
在当今数据爆炸的时代,我们处理的数据越来越庞大和复杂,因此系统调优和性能评估设计分析变得越来越重要。
本文将介绍系统调优和性能评估设计分析的概念、方法和实践,以及其在计算机领域中的应用。
什么是系统调优?系统调优是指通过在系统的各个层面和组件上进行优化,以提高系统的性能和效率。
系统调优可以包括对操作系统、硬件、软件和网络进行优化。
通过系统调优,我们可以减少系统的延迟、提高处理和响应速度,从而提高计算机系统的整体性能。
什么是性能评估设计分析?性能评估设计分析是一种通过对系统进行测量、测试和分析,评估系统的性能和效率的方法。
性能评估的目的是发现系统在容量、吞吐量、延迟等方面的限制和瓶颈,并提出改进和优化的方案。
性能评估设计分析可以帮助我们了解系统的工作原理和性能,从而为系统调优提供指导和依据。
系统调优的方法系统调优是一种复杂而技术性强的任务,需要综合应用各种方法和技术。
下面将介绍几种常见的系统调优方法。
测量和监测测量和监测是系统调优的关键步骤之一,它可以帮助我们了解系统的当前状态和性能瓶颈。
通过测量和监测,我们可以获取系统的各种指标和度量,如延迟、吞吐量、资源利用率等。
这些数据可以用于分析系统的性能问题和优化需求。
性能剖析性能剖析是一种通过对系统的运行进行分析和调查,识别性能瓶颈和瓶颈的部分进行系统调优的方法。
通过性能剖析,我们可以找到系统中的瓶颈和效率低下的部分,并提出相应的优化方案。
性能剖析可以帮助我们深入了解系统的工作原理和性能瓶颈,从而提高系统的性能。
优化算法和数据结构优化算法和数据结构是系统调优中一个非常重要的方面。
通过优化算法和数据结构,我们可以改进系统的算法和数据结构,以提高系统的性能和效率。
例如,通过使用更高效的排序算法或数据结构,我们可以减少系统的延迟和提高处理速度。
系统工程导论 第七章 系统的评价与决策 第一节系统评价——评价的复杂性

5.资源性指标。包括人、财、物等资源的保证程度。如工程项目中 的物质、人力、能源、水源、土地条件等。
6.时间性指标。如工程进度、时间节约、试制周期等。
以上6个方面是一般所要考虑的大类指标,每一个指标又可包含许 多小类指标,在具体条件下,可以有所选择和增减甚至不予考虑。至 于大类下的单项指标,则要根据系统性质、目标要求、有关系统的特 殊问题等全面予以考虑。
3.评价指标要成体系。评价指标应能全面反映被评价问题的主要
方面,在基本能满足评价要求和给出决策所需信息的前提下,应尽量
减少指标个数,在可能的情况下,尽量定量化,以减少评价过程中的
主观性和片面性。
2023/3/14
9
5.1 系统评价——系统评价原则
4.评价方法和手段的综合性。系统评价要对系统的各个侧面,运用 多种方法和工具进行全面综合评价,充分发挥各种方法和手段的综合 优势,为系统的综合评价提供全面分析的手段。
2023/3/14
4
5.1 系统评价——评价的复杂性
解决方案——系统的评价需要紧紧抓住以下两个方面
1)正确、合理地选择评价因素
衡量一个系统或者一个可行方案的优劣要有一组评价标准,而评 价标准要以评价指标作为基准。常用的指标有:投资费用、效益成本、 投资收益率、返本期、劳动生产率、时间、质量和品种的改善、技术 的先进性、可靠性、劳动强度的改善、公害等等。系统的评价指标虽 然很多,但基本上是按照性能(performance)、费用(cost)、时间 (schedule)三大类来考虑的。
❖ 不但要考虑交通工具的动力、推进等技术方面的问题 ❖ 还要考虑交通线路的建设费用和日常经营费用等经济方面的问题 ❖ 还要有交通工具的方便性、舒适性、安全性、美观性 ❖ 环境保护、地方团体的利益、有关节能、能源政策等方面的考虑 一般情况下,指标和方案越多,评价问题就越复杂。
3复杂系统与创造性思维PPT课件

输出y
正反馈
x
负反馈
反馈环
f
f
输入x △x
x
x
远离平衡态下的涨落造就有序结构
例子: 亨利八世离婚案与英国 宗教改革
2020年9月28日
17
“被冻结了的随机性”/路径依赖
例子:QWERT键盘:一个充满杯具的设计: 开始为了减慢速度,减少卡壳;
结果:使用频率高的字母放在上下行;手指每天 移动27.5公里;左手重体力劳动,右手偷懒
Scientific research: Reductionism Mathematical analysis
2
复杂系统:
Reenchantement of nature
简单系统: 微积分、牛顿力学、 热力学的研究对象; 机械结构、理想气体
复杂系统: 细胞;生物体; 大脑;社会组织; 生态系统
死的,不演化的 组分少 线性的 可还原的
2020年9月28日
活的,演化的 3个以上组分(三生万物,三国) 形成非线性的耗散结构 层级性、涌现性、不可还原性 随机性造就复杂性/涨落造就有序 冻结了的随机性/ 路径依赖 幂律分布
3
现代自然观的四种世界图景(哈佛大学天体 物理学家雷泽尔)
无时间性,可逆的图景 牛顿力学
量子物理学
熵增,序减
热力学第二定律所表示
SkloW g
玻尔兹曼墓碑 上的公式
热力学第二定律:封闭系统中的任何不可逆 过程都导致了系统熵的增加(图景2)
宇宙热寂说: 将热力学第二定律推到整个宇宙: 1)物质转化为电磁辐射 2)机械能转化为热能 3)热平衡
三、有时间性,熵减序增且可预测,图 景3
1)爱因斯坦引力方程所推出的宇宙膨胀观点: 每一瞬时可能达到的熵最大值Sm在增大,使
最新复杂性系统与自组织临界现象ppt课件

最简单的一维元胞自动机的演化终态
在所有的一维元胞自动机中,最简单的是 k = 2,r = 1 的情况,这时共有 256 种元胞自动 机。 S. Wolfram(1986)对这 256 种最简单的 情况进行了全面的研究,发现它们可以归纳为四 类,对应于四类吸引子:
● 演化到全部是 0 或全部是 1 的均匀状态 ● 演化到不随时间变化的定态(不动点),
● 空间离散;
● 时间离散;
● 状态的取值离散;
● 同质性 —— 所有元胞的变化都服从相同的规律;
● 高维 —— 元胞空间的维数虽然很低,但其状态变 量的个数为无穷,因此它是一个无穷维的动力系统;
● 时空演化规则的局域性 ——每一个元胞下一时刻的 状态,只取决于其周围邻域中的元胞的当前时刻的状态, 以及该元胞本身当前时刻的状态,亦即时间和空间演化的 运算规则是局域的。
● 混沌控制(chaos control)(E. Ott et al.,1990 ) 与 混沌同步(chaos synchronization )(T. L. Carroll & L. M. Pecora,1990)
● 符号动力学(Symbolic Dynamics )(N. Metropolis et al.,1973;J. Milnor & E. Thurston,1977)
● 非线性(混沌)时间序列分析(nonlinear time series analysis)(N. H. Packard et al.,1980;F. Takens, 1981)
● 自组织临界(self-organized criticality)理论(Bak et al. ,1986)
第三阶段:二十世纪七十年代至今(续)
第一阶段:二次大战至战后
开放复杂巨系统理论PPT课件

➢简单环境中的 ➢复杂环境中的 ➢简单环境中的 ➢复杂环境中的
简单巨系统
简单巨系统 复杂巨系统
复杂巨系统
开放复杂巨系统
-
18
2.3开放复杂巨系统
❖ 所谓开放复杂巨系统,根据多年来钱学森在不同场合下的 论述,指的是具有下列特征的一大类系统:
(1)系统规模巨大,即巨型性;
▪
(2)系统组分彼此差异显著,花色品种多,即异质性;
-
23
4.1建立系统学新思路
信息学
运筹学
耗散结构 论
超循环论
混沌学
控制学
系统工程 与一般系
统论
协同学
微分动力 系统
形成一门关于一般系统的基础学科,即系统学
-
24
4.1建立系统学新思路
▪ 得到系统分类后,钱学森意识到系统学的对 象是巨系统,也有分支学科,原来设想的只是 简单巨系统学,还应有复杂巨系统学,他不可 能在现有系统理论的基础上经过综合建立起来, 由此而引出关于复杂巨系统学的研究。
▪ 圣塔菲的主要人物都是在基础科学层次卓有成 就的学者,注重对复杂系统运行演化机制和基 本规律的研究,不大关心复杂性研究的当前应 用问题。他们的长处正是中国从事系统学研究 的主力短缺之处,所以,建立开放复杂巨系统 学应当
▪ “偏师借重圣塔菲”。
-
26
4.2建立开放复杂巨系统的唯象理论
唯象论:就是从现象出发,光描述现象,把各种复杂现象的数据用数学的关系表达出来。
-
17
2.3开放复杂巨系统
对开放性的深入研究,导致钱学森按照系统与环境关系对巨系统
作出如下完备分类:
如人体系统,
如贝纳德流, 激光器
如智能机器 人,环境复 杂多变,系 统却是简单 的
(复杂系统的性能评价与优化课件资料)overview_lecture

e2 e3 e4
e5
e6
time
17
Comparison with a CVDS Trajectory
Discrete state
dx/dt = f(x,u,t)
time Hybrid System: each state can hide CVDS behavior 18
Modeling Ingredients
Untimed Timed
Finite State
Machines & Petri Nets
Finitely Recursive Processes
• Discrete States: combinatorial explosion • Stochastic Effects: unavoidable uncertainty • Continuous time and performance measure • Dynamical: • Hierarchical: • Computational vs conceptual
• A set of resources: machines, AGVs, nodal CPUs,
communication links and subnetworks, etc
• Routing of job among resources: production
plans, virtual circuits, etc
(CVDS)?
11
12
What are Discrete Event Dynamic Systems (DEDS)?
13
An Airport
14
More Examples of DEDS
系统性能评估报告范本
系统性能评估报告范本Title: Sample System Performance Evaluation ReportExecutive SummaryThe purpose of this report is to present a sample structure for a system performance evaluation report. The report aims to provide a comprehensive analysis of the system's performance based on defined parameters and benchmarks. The report consists of sections covering the introduction, methodology, findings, and recommendations.Introduction1. BackgroundThis section provides an overview of the system being evaluated, including its purpose, functionality, and significance. It also outlines the objectives of the evaluation to establish a context for the subsequent analysis.2. Scope of EvaluationIn this section, the scope of the evaluation is defined, including the specific modules, features, or components of the system under review. The limitations, assumptions, and dependencies associated with the evaluation process are also highlighted.Methodology1. Evaluation Criteria and MetricsThis section identifies the criteria and metrics used for assessing the system's performance. The criteria may include response time, throughput,scalability, availability, and resource utilization. Each criterion should be clearly defined, along with the associated metrics and their respective benchmarks.2. Data CollectionThe data collection methods employed during the evaluation are outlined in this section. It includes information on the tools, techniques, or tests used to capture the required performance metrics. Any prerequisites, procedures, or special considerations for data collection should be mentioned.Findings1. Performance AnalysisThis section presents a detailed analysis of the collected performance data. The findings should be arranged based on the evaluation criteria and highlight the system's strengths and weaknesses. Any trends, patterns, or unexpected observations should be addressed. Visual aids such as graphs or charts can be utilized to enhance the presentation of the data.2. Comparison with BenchmarksThe performance metrics obtained during the evaluation are compared against the predefined benchmarks and industry standards. This section outlines the variances between the actual performance and the desired performance levels. Deviations from benchmarks are identified and explained.3. Performance Optimization RecommendationsIn this section, recommendations are provided to address the identified performance issues and optimize the system. Potential solutions and strategies should be presented, including hardware or software enhancements, configuration changes, or process improvements. Each recommendation should be supported by relevant justifications.ConclusionThe conclusion section summarizes the key findings and recommendations from the evaluation. Emphasis should be placed on the significance of the evaluation results and the potential benefits of implementing the recommendations.AppendixThe appendix may include additional supporting materials, such as raw data, test configurations, or any relevant documentation. These materials can provide further insights into the evaluation process and aid in the understanding of the report.Note: This sample report follows a general structure for system performance evaluation reports. The content and format can be modified to suit specific requirements and preferences.。
- 1、下载文档前请自行甄别文档内容的完整性,平台不提供额外的编辑、内容补充、找答案等附加服务。
- 2、"仅部分预览"的文档,不可在线预览部分如存在完整性等问题,可反馈申请退款(可完整预览的文档不适用该条件!)。
- 3、如文档侵犯您的权益,请联系客服反馈,我们会尽快为您处理(人工客服工作时间:9:00-18:30)。
DESIGN
1 2 3 4 5 6 7 8 9 10 11 12 13 14 15 16 17 18 19 20 21 22 23 24 25 26 27 28 29 30 31 32 33 34 35 36 37 38 39 40 41 42 43 44 45 46 47 48 49 50 51 52 53 54 55 56 57 58
Lee, Li et al.
• Selection Rules – Zhao, Jia, Ho. • Optimal Allocation of Computing Budget – Chen, Lee et al • Constraint satisfaction – Song et al • Complete reference and applications list at end.
noise, w
130.741197 186.2304159 90.61091149 257.1674992 246.1330685 239.8111755 189.8911518
241.664179 374.4412696 204.4470437 340.2405253
356.149597 336.7832541 444.4689307 665.5127144 783.5096498 897.8429655 847.9866227 858.0134902 1023.014969 1082.184387 1056.412161 1229.769971 1075.175188 1182.823523 1183.446494 1300.723387 1393.320409 1273.545024 1403.761256 1408.789507 1563.524755 1538.953834
Orde r
39 22 122 6 20 77 168 155 26 198 69 56 115 14 2 112 62 169 173 49 21 102 24 188 178 196 98 59 184 110 187 71 129 37 132 29 140 43 12 96 54 121 124 136 199 164 163 158 73 175 116 50 152 30 9 84 118 52
Overview of Ordinal Optimization (OO)
By Yu-chi Ho
Harvard University & Tsinghua University
Acknowledgments
• Work of many people over a period of 13 years. • Supported by ONR, AFOSR, ARO, NSF, & EPRI. • First paper – 1992 (Ho, Screenivas, Vakili) • Convergence –Dai, Xie, Ho & Lau. • Multi-criteria and Constraints – Ho, Guan, Song, Zhao, Jia,
10/22/2020
Y.C. Ho
14
Selection Rules
• How do you select the estimated good enough set ,
S?
• Simplest rule is Blind Pick – se2020
Y.C. Ho
2
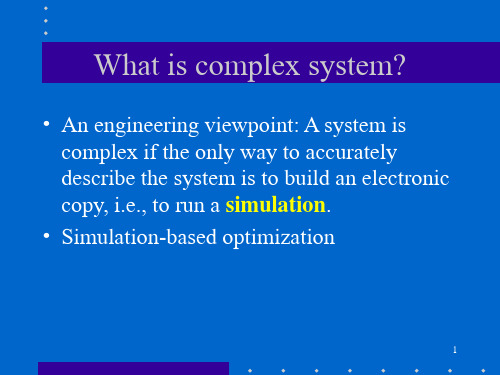
What Is OO?
• PROBLEM: Performance evaluation and
optimization of complex systems via simulation is extremely time consuming and often impossible.
• High cost and profit potential
10/22/2020
Y.C. Ho
6
Principles of OO
• “Order” vs. “Value” - The two box
metaphor
• Asking only for the “good enough” =>
Satisfying possibilities increases combinatorially
• Many decisions over time
• How much to disassemble • Out-source vs. Internal work • Parts inventory level • Repair vs. Replace • Preventive maintenance
Good Enough Threshold
10/22/2020
Y.C. Ho
9
A Live Demonstration
• 200 choices numbered from 1, . . . , 200 • Very large measurement noise U[0,100] or
U[0, 10000] added
10/22/2020
Y.C. Ho
12
In other words
OO theory tell you with high probability how many of the observed “good enough” set obtained using very crude models are indeed truly “good enough” - the Alignment Probability (AP)
Xie)
10/22/2020
A
B
Y.C. Ho
Performance
8
Major OO Result II
• Satisfactory results increases
combinatorially with the size of Good Enough threshold (Ho Lau and Lee 1999)
reset
Expt #1
Expt #2
Expt #3
add noise
order
Alignment
Average G intersect S 0
Infinite noise
Blindpick
10/22/2020
Y.C. Ho
11
OO How-to
• Create a crude model of the performance • Evaluate N samples of the crude model • Define s=|S| members of N as the selected
How many of the top 16 seeds in tennis will reach the quarter final in U.S. Open?
10/22/2020
Y.C. Ho
13
What about the “Ranking &
Selection” Literature?
• R&S problems deals with a few alternatives • OO search space Q are of size in billions
• Select top-12 (top 6%) using noisy
measurements
• Check alignment between S and G, the true
top-12.
• Open OO demo.xls and play!
10/22/2020
Y.C. Ho
10
Illustration of OO demo.xls. Go to EXCEL to open and play
TRUE PERFORMANCE
J 1 2 3 4 5 6 7 8 9 10 11 12 13 14 15 16 17 18 19 20 21 22 23 24 25 26 27 28 29 30 31 32 33 34 35 36 37 38 39 40 41 42 43 44 45 46 47 48 49 50 51 52 53 54 55 56 57 58
1832.44107 1750.669524 1878.818435 1832.400723
2012.25718 2062.64469 2015.538174 2069.805204 2003.031773 2000.904922 2162.323516 2202.229017 2267.614046 2350.820323 2379.884515 2521.66779 2467.525538 2577.967978 2653.386595 2630.714805 2770.569753 2841.383177 2769.988868 2872.570794 2940.177555
• SOLUTION: OO renders the above difficult
problem feasible.
• OO is very general and can be applied
anywhere.
10/22/2020
Y.C. Ho
3
A Typical Real World Problem (contd.)
and billions
• R&S are interested in “distance of best from
the rest” – a cardinal notion
• R&S are interested in the Probability that