概率论与统计学原理chapt1english
概率论与数理统计(chapt1-6 n重贝努利试验)

设A:恰好4次命中,B:至少4次命中,C:至多4次命中
(1) P( A) P5( 4) C54 0.840.2 0.4096
(2) P( B) P5( 4) P5( 5)
C
4 5
0.840.2
C
5 5
0.85
0.7373
(3) P(C ) 1 P(C) 1 P5( 5)
1
C
5 5
n重贝努利(Bernoulli )试验的例子 1.已知在指定时间内某十字路口的事故率为p,现在此 时间段内对经过的n 辆机动车进行观察 每辆车是否经过这个十字路口是相互独立的,而且观
察结果有且只有这是一个贝努利试验
2.某射手每次射击命中目标的概率都是 p,现对同一目 标独立射击 n 次,观察射击结果 此射手独立射击n次,每次射击命中目标的概率都 是p,所以这n次射击构成独立试验序列,每次射击
比如 s 3, a 1, b 1 则再赌3局必分胜负
P{甲赢} P{X 2} P{X 2} P{X 3}
C32
(1)2 2
1 2
C33
( 1 )3 2
1 2
又如 s 3, a 1, b 2
则再赌2局必分胜负
P{甲赢}
P{X
2} C22
( 1 )2 2
1 4
第一章 小 结
设事件A:10件中至少有两件次品,则
10
p( A) p10 (k) 1 p10 (0) p10 (1) k 2 1 0.9610 C110 0.04 0.969 0.0582
(2)设事件B:前 9 次中抽到 8 件正品一件次品; 事件C:第 10 次抽到次品,则所求概率为
P(BC) P(B)P(C)
0.1 0.4 0.7
英文版概率论与数理统计重点单词
概率论与数理统计Probability Theory and Mathematical Statistics第一章概率论的基本概念Chapter 1 Introduction of Probability Theory不确定性indeterminacy必然现象certain phenomenon随机现象random phenomenon试验experiment结果outcome频率数frequency number样本空间sample space出现次数frequency of occurrencen维样本空间n-dimensional sample space样本空间的点point in sample space随机事件random event / random occurrence基本事件elementary event必然事件certain event不可能事件impossible event等可能事件equally likely event事件运算律operational rules of events事件的包含implication of events并事件union events交事件intersection events互不相容事件、互斥事件mutually exclusive exvents / /incompatible events互逆的mutually inverse加法定理addition theorem古典概率classical probability古典概率模型classical probabilistic model 几何概率geometric probability乘法定理product theorem概率乘法multiplication of probabilities条件概率conditional probability全概率公式、全概率定理formula of total probability贝叶斯公式、逆概率公式Bayes formula后验概率posterior probability先验概率prior probability独立事件independent event独立随机事件independent random event独立实验independent experiment两两独立pairwise independent两两独立事件pairwise independent events第二章随机变量及其分布Chapter 2 Random Variables and Distributions随机变量random variables离散随机变量discrete random variables概率分布律law of probability distribution一维概率分布one-dimension probability distribution 概率分布probability distribution两点分布two-point distribution伯努利分布Bernoulli distribution二项分布/伯努利分布Binomial distribution超几何分布hypergeometric distribution三项分布trinomial distribution多项分布polynomial distribution泊松分布Poisson distribution泊松参数Poisson theorem分布函数distribution function概率分布函数probability density function连续随机变量continuous random variable概率论与数理统计中的英文单词和短语概率密度probability density概率密度函数probability density function 概率曲线probability curve均匀分布uniform distribution指数分布exponential distribution指数分布密度函数exponential distribution density function正态分布、高斯分布normal distribution标准正态分布standard normal distribution正态概率密度函数normal probability density function正态概率曲线normal probability curve标准正态曲线standard normal curve柯西分布Cauchy distribution分布密度density of distribution第三章多维随机变量及其分布Chapter 3 Multivariate Random Variables and Distributions二维随机变量two-dimensional random variable联合分布函数joint distribution function二维离散型随机变量two-dimensional discrete random variable二维连续型随机变量two-dimensional continuous random variable联合概率密度joint probability variablen维随机变量n-dimensional random variablen维分布函数n-dimensional distribution functionn维概率分布n-dimensional probability distribution 边缘分布marginal distribution边缘分布函数marginal distribution function边缘分布律law of marginal distribution边缘概率密度marginal probability density二维正态分布two-dimensional normal distribution二维正态概率密two-dimensional normal probability 度density二维正态概率曲线two-dimensional normal probabilitycurve条件分布conditional distribution条件分布律law of conditional distribution条件概率分布conditional probability distribution条件概率密度conditional probability density边缘密度marginal density独立随机变量independent random variables第四章随机变量的数字特征Chapter 4 Numerical Characteristics fo Random Variables数学期望、均值mathematical expectation期望值expectation value方差variance标准差standard deviation随机变量的方差variance of random variables均方差mean square deviation相关关系dependence relation相关系数correlation coefficient协方差covariance协方差矩阵covariance matrix切比雪夫不等式Chebyshev inequality第五章大数定律及中心极限定理Chapter 5 Law of Large Numbers and Central Limit Theorem大数定律law of great numbers切比雪夫定理的special form of Chebyshev theorem特殊形式依概率收敛convergence in probability伯努利大数定律Bernoulli law of large numbers同分布same distribution列维-林德伯格定理、独立同分布中心极限定理independent Levy-Lindberg theorem辛钦大数定律Khinchine law of large numbers利亚普诺夫定理Liapunov theorem棣莫弗-拉普拉斯定理De Moivre-Laplace theorem第六章样本及抽样分布Chapter 6 Samples and Sampling Distributions统计量statistic总体population个体individual样本sample容量capacity统计分析statistical analysis统计分布statistical distribution统计总体statistical ensemble随机抽样stochastic sampling / random sampling 随机样本random sample简单随机抽样simple random sampling简单随机样本simple random sample经验分布函数empirical distribution function样本均值sample average / sample mean样本方差sample variance样本标准差sample standard deviation标准误差standard error样本k阶矩sample moment of order k样本中心矩sample central moment样本值sample value样本大小、样本容量sample size样本统计量sampling statistics随机抽样分布random sampling distribution抽样分布、样本分布sampling distribution自由度degree of freedomZ分布Z-distributionU分布U-distribution第七章参数估计Chapter 7 Parameter Estimations统计推断statistical inference参数估计parameter estimation分布参数parameter of distribution参数统计推断parametric statistical inference点估计point estimate / point estimation总体中心距population central moment总体相关系数population correlation coefficient总体分布population covariance总体协方差population covariance点估计量point estimator估计量estimator无偏估计unbiased estimate / unbiasedestimation估计量的有效性efficiency of estimator矩法估计moment estimation总体均值population mean总体矩population moment总体k阶矩population moment of order k总体参数population parameter极大似然估计maximum likelihood estimation极大似然估计量maximum likelihood estimator极大似然法maximum likelihood method /maximum-likelihood method似然方程likelihood equation似然函数likelihood function区间估计interval estimation置信区间confidence interval置信水平confidence level置信系数confidence coefficient单侧置信区间one-sided confidence interval置信上限confidence upper limit置信下限confidence lower limitU估计U-estimator正态总体normal population总体方差的估计estimation of population variance 置信度degree of confidence方差比variance ratio第八章假设检验Chapter 8 Hypothesis Testings参数假设parametric hypothesis假设检验hypothesis testing两类错误two types of errors统计假设statistical hypothesis统计假设检验statistical hypothesis testing检验统计量test statistics显著性检验test of significance统计显著性statistical significanceone-sided test单边检验、单侧检验one-sided hypothesis单侧假设、单边假设双侧假设two-sided hypothesis双侧检验two-sided testing显著水平significant levelrejection region拒绝域/否定区域接受区域acceptance regionU检验U-testF检验F-test方差齐性的检验homogeneity test for variances 拟合优度检验test of goodness of fit。
概率论与统计学基本知识chapt2english

Dot Plot
30
35
40
45
Stem-and-Leaf Display 茎叶图
Stem-and-leaf display combines graphic technique and sorting technique. It is very popular for summarizing numerical data.
1. Bar graph shows the amount of data that belongs to each class as proportionally sized rectangular areas
2. Pie chart shows the amount of data that belongs to each class as a proportional part of a circle
The researchers want to determine whether one type of aphasia occurs more often than any other, and, if so, how often.
Describing Qualitative data
Qualitative data are nonnumerical in nature, thus the value of a qualitative variable can only be classified into categories called classes. We can summarise such data numerically in two ways: (1) by counting
MPG
Histogram
概率论与数理统计-大学课件-ch1.1

随机试验
研究随机现象,首先要对研究对象进行观察试验. 这里的试验,指的是随机试验:.
如果每次试验的可能结果不止一个,且事先不能肯定 会出现哪一个结果,这样的试验称为随机试验.
例如, 掷寿硬命币试试验验 测命掷试. 一在枚掷同硬一一币颗工,骰艺观子掷条察,骰件出观子下正察试生还出验产是现出反的的.点灯数泡的寿
.
A B
AB
在可列无穷的场合,用 表示事件“A1、A2 、 …诸事件
同时发生。”
事件A发生但事件B不发生, 称为事件A与B的差事件。
A B
A B
显然:
AB
数理学院
SCHOOL OF MATHEMATICS AND PHYSICS
则称A和B是互不相容的或互斥的,
指事件A与B不可能同时发生。 基本事件是两两互不相容的。
H
T
随机试验的特点
数理学院
SCHOOL OF MATHEMATICS AND PHYSICS
试验可以在相同条件重复进行;
试验的可能结果不只有一个, 但试验的全部可能结果,是在试验前就明确的;
每次试验的结果是不可预知的.
数理学院
SCHOOL OF MATHEMATICS AND PHYSICS
样本空间与事件
数理学院
SCHOOL OF MATHEMATICS AND PHYSICS
表示事件A与事件B同时发生, 称为事件A与事件B
的积(交)事件,记为AB。积事件AB是由A与B的公共样本
点所构成的集合。
n个事件A1 , A2 , … , An 的积
记为A1 ∩ A2 ∩ … ∩ An ,
或A1A2 … An ,也可简记为
概率与统计课件第一章

Throwing a die
Chevalier De Mere
Blaise Pascal
Pierre de Fermat
Classical probability古典概率
Suppose a game has n equally likely outcomes, of which m outcomes The correspondence between Pascal and Fermat
changed only when an error has been made; negotiation is not appropriate
• Any questions?
Origins
• Let’s date back to 1650’s in France
• Gambling was fashionable
• Assignments submitted by a studying group(作业)25%
• A study group consists of up to 3 students, and they will receive the same grade on each submission of their homework
tools • To think in a probabilistic and statistical way
Contents to be covered
Probability
Distribution
Joint
分布
Dist.
Discrete random variables
Continuous random variables
• Course project (课程项目)15% (written report + oral presentation)
概率论与数理统计英语

概率论与数理统计英语English: Probability theory and mathematical statistics are two branches of mathematics that deal with the concepts and tools used to understand randomness and uncertainty in various phenomena. Probability theory is concerned with quantifying uncertainty and making predictions about the likelihood of certain events occurring, while mathematical statistics uses probability theory to draw conclusions about populations based on sample data. These two fields are closely related and often used together in applications such as insurance, finance, engineering, and social sciences. Probability theory involves concepts such as random variables, probability distributions, and the laws of large numbers, while mathematical statistics covers topics such as estimation, hypothesis testing, and regression analysis. Together, they provide a framework for understanding uncertainty and making informed decisions in the face of incomplete information.中文翻译: 概率论和数理统计是数学的两个分支,涉及用于理解各种现象中的随机性和不确定性的概念和工具。
(完整word版)概率论与数理统计(英文)
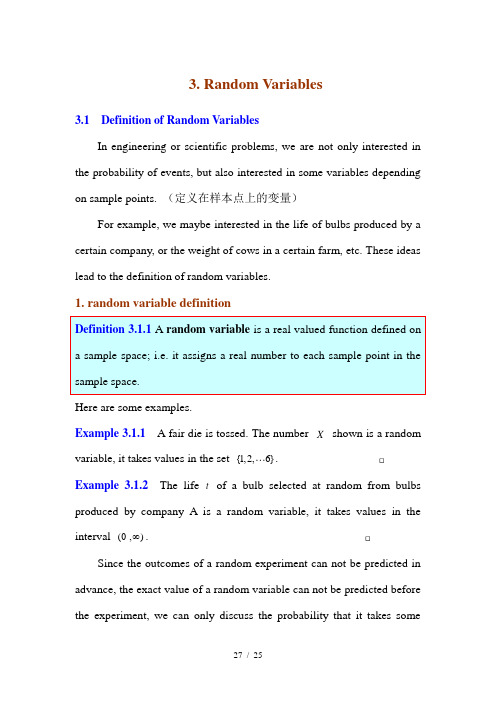
3. Random Variables3.1 Definition of Random VariablesIn engineering or scientific problems, we are not only interested in the probability of events, but also interested in some variables depending on sample points. (定义在样本点上的变量)For example, we maybe interested in the life of bulbs produced by a certain company, or the weight of cows in a certain farm, etc. These ideas lead to the definition of random variables.1. random variable definitionHere are some examples.Example 3.1.1 A fair die is tossed. The number X shown is a random variable, it takes values in the set {1,2,6}.Example 3.1.2The life t of a bulb selected at random from bulbs produced by company A is a random variable, it takes values in the interval (0,) .Since the outcomes of a random experiment can not be predicted in advance, the exact value of a random variable can not be predicted before the experiment, we can only discuss the probability that it takes somevalue or the values in some subset of R.2. Distribution function Definition3.1.2 Let X be a random variable on the sample space S . Then the function()()F X P X x =≤. R x ∈is called the distribution function of XNote The distribution function ()F X is defined on real numbers, not on sample space.Example 3.1.3 Let X be the number we get from tossing a fair die. Then the distribution function of X is (Figure 3.1.1)0,1;(),1,1,2,,5;61, 6.if x n F x if n x n n if x <⎧⎪⎪=≤<+=⎨⎪≥⎪⎩Figure 3.1.1 The distribution function in Example 3.1.3 3. PropertiesThe distribution function ()F x of a random variable X has the following properties :(1) ()F x is non-decreasing.SolutionBy definition,1(2000)(2000)10.6321P X F e -≤==-=.(10003000)(3000)(1000)P X P X P X <≤=≤-≤1.50.5(3000)(1000)(1)(1)0.3834F F e e --=-=---= Question : What are the probabilities (2000)P X < and (2000)P X =? SolutionLet 1X be the total number shown, then the events 1{}X k = contains 1k - sample points, 2,3,4,5k =. Thus11()36k P X k -==, 2,3,4,5k = And512{1}{}k X X k ==-==so 525(1)()18k P X P X k ==-===∑ 13(1)1(1)18P X P X ==-=-=Thus0,1;5()(),11;181, 1.x F x P X x x x <-⎧⎪⎪=≤=-≤<⎨⎪≥⎪⎩Figure 3.1.2 The distribution function in Example 3.1.5The distribution function of random variables is a connection between probability and calculus. By means of distribution function, the main tools in calculus, such as series, integrals are used to solve probability and statistics problems.3.2 Discrete Random Variables 离散型随机变量In this book, we study two kinds of random variables. ,,}n aAssume a discrete random variable X takes values from the set 12{,,,}n X a a a =. Let()n n P X a p ==,1,2,.n = (3.2.1) Then we have 0n p ≥, 1,2,,n = 1n n p=∑.the probability distribution of the discrete random variable X (概率分布)注意随机变量X 的分布所满足的条件(1) P i ≥0(2) P 1+P 2+…+P n =1离散型分布函数And the distribution function of X is given by()()n n a xF x P X x p ≤=≤=∑ (3.2.2)Solutionn=3, p=1/2X p r01/813/823/831/8two-point distribution(两点分布)某学生参加考试得5分的概率是p, X表示他首次得5分的考试次数,求X的分布。
概率论与统计学的基本原理

概率论与统计学的基本原理概率论与统计学是数学中的两个重要分支,它们在各个领域的研究中起到了至关重要的作用。
概率论研究的是随机事件的发生规律,而统计学则通过对数据的分析和推理,从中得出有关总体特征的结论。
本文将介绍概率论与统计学的基本原理,包括概率的定义与性质、统计学的基本概念和方法等。
一、概率论的基本原理1. 概率的定义概率是描述随机事件发生可能性大小的一种数学工具。
在概率论中,将一个随机事件A的概率表示为P(A),其取值范围在0到1之间。
当P(A)等于0时,表示事件A不可能发生;当P(A)等于1时,表示事件A一定会发生;当0<P(A)<1时,表示事件A以一定的概率发生。
2. 概率的性质概率具有以下几个基本性质:加法法则、乘法法则、互斥事件的概率、独立事件的概率等。
加法法则指示了对两个事件进行并运算时的概率计算方法,乘法法则则描述了对两个事件进行交运算时的概率计算方法。
互斥事件是指两个事件不可能同时发生,其概率计算方法为两个事件的概率之和。
独立事件是指两个事件的发生不会相互影响,其概率计算方法为两个事件的概率之积。
二、统计学的基本原理1. 总体与样本在统计学中,研究对象可以分为总体和样本。
总体是指研究者想要了解的整体,样本则是从总体中抽取的一部分个体。
通过对样本的研究和分析,可以得出有关总体的结论,这是统计学的基本思想。
2. 统计量统计量是样本的某个特征的函数,可以通过对样本数据进行计算得到。
常用的统计量有平均数、方差、标准差等。
平均数是样本的所有观测值之和除以观测值的总数,用于表示样本的集中趋势。
方差则用于表示样本的离散程度,标准差是方差的平方根。
3. 抽样分布抽样分布是指当样本容量趋近于无穷大时,样本统计量的分布情况。
常见的抽样分布有正态分布、t分布、F分布等。
这些分布是统计学中常用的工具,可以用来进行参数估计和假设检验等。
三、概率论与统计学的应用概率论和统计学在各个领域都有广泛的应用。
- 1、下载文档前请自行甄别文档内容的完整性,平台不提供额外的编辑、内容补充、找答案等附加服务。
- 2、"仅部分预览"的文档,不可在线预览部分如存在完整性等问题,可反馈申请退款(可完整预览的文档不适用该条件!)。
- 3、如文档侵犯您的权益,请联系客服反馈,我们会尽快为您处理(人工客服工作时间:9:00-18:30)。
Survey
With a survey, the researchers sample a group of people, ask questions and record the responses. They collect information systematically and directly from respondents Survey methods: telephone surveys, mail surveys, internet survey, computer interviews, door-to-door personal interviews, and mall intercept studies.
Collecting Data
Generally, we can obtain data in four different ways: 1. Data from a published source 2. Data from a designed experiment 3. Data from a survey 4. Data from an observational观察 study.
Fundamental elements of statistics
4. A sample样本 is a subset of the units of a 样本 population. 5. A statistical inference统计推断 is an estimate, 统计推断 testing, prediction, or same other generalization about a population based on information contained in a sample.
Quantitative data
DEF 1.9 Quantitative data are measurements that are recorded on a naturally occurring numerical scale. The responses to questions such as “How old are you?” or "How tall are you?" are clearly numerical.
PROBABILITY & STATISTICS
Lecturer: Yu Yu Office: 8412 Email: yuyu@
Course Outline
1. Descriptive Statistics: [Chapters 1 & 2] 2. Probability: [Chapters 3 – 5] 3. Inferential Statistics I: [Chapters 6 – 7]
Learning Objectives
1. Define Statistics 2. Distinguish Descriptive & Inferential statistics 3. Define Population, Sample, Variable, Parameter, & Statistic 4. Distinguish Quantitative & Qualitative data 5. Four types of collecting data
Fundamental elements of statistics
7. Statistic统计量 is a numerical characteristic 统计量 of a sample. The “average” of 500 MSNBC news viewers. The value of a statistic can be calculated after a sample to be collected.
Qualitative data
DEF 1.10 Qualitative data are measurement that cannot be measured on a natural numerical scale; they can only be classified into one of a group of categories. For example, the response to the question ‘which subject is your first choice?’ is categorical. The choices are clearly ‘International Finance’, ‘Economics’, ‘Marketing’ …, or ‘Statistics’.
A planned activity whose results yield a set of data. In a designed experiment, researchers control strictly over the units (people, objects, or things). This includes both the activities for selecting the units and obtaining the data values. Most of laboratory results are obtained in designed experiment.
1. Involves
Estimation Hypothesis Testing
Population?
2. Purpose
Make Decisions About Population Characteristics
Fundamental elements of statistics
1. Population总体 is a collection or set of units (usually 总体 people, objects, transactions, or events) that we are interested in studying. 2. An experimental unit试验单位 is an object (e.g., 试验单位 person, object, transaction, or event) upon which we collect data. 3. A variable变量 is a characteristic or property of 变量 interest about each individual population or sample unit.
Types of Data
Data is a set of values (numbers, words, or symbols) collected for the variable from each of the units belonging to the sample or population. Two types of data: qualitative data quantitative data.
Example
According to USA Today, (Dec. 19, 1999), the average age of viewers of MSNBC cable television news programming is 50 years. Suppose a rival network executive hypothesizes that the average age of MSNBC viewers is less than 50. To test her hypothesis, she samples 500 MSNBC news viewers and collects the age of each. Describe the population. Describe the variable of interest. Describe the sample. Describe the inference推论.
Types of Statistical Applications
The field of statistics can be roughly subdivided into two areas: 1. descriptive statistics 描述型 2. inferential statistics 推论型
Reliability可靠性
Since we use the information contained in the smaller sample to learn about the larger population and so we can not be certain that an inference about a population is correct. We need to know how good the inference is – its reliability (or risk), i.e. how to measure the uncertainty in inferences. DEF 1.8A measure of reliability is a statement (usually quantified) about the degree of uncertainty associated with a statistical inference. The measure of reliability shows the dialectical thinking. It also separates the science of statistics from the art of fortune-telling.
Course Grading