英文学术报告范例ppt课件
研究报告ppt英语版
研究报告ppt英语版Research Report PresentationGood morning/afternoon, everyone. Today, I am here to present the findings of our research report on [topic]. Our team has been working diligently to collect data, analyze it, and draw meaningful conclusions. Without further ado, let's dive into the main points of our presentation.Slide 1: IntroductionOur research report aims to investigate [briefly explain the topic]. We identified the objectives, conducted a thorough literature review, gathered primary data through surveys, interviews, and observations. The insights gained from this research will provide a better understanding of [topic] and its impact on [relevant factors]. Slide 2: MethodologyTo ensure the validity and reliability of our research, we adopted a mixed-method approach. Firstly, we conducted a comprehensive review of existing literature to gain a theoretical framework. Secondly, we distributed surveys to a diverse sample of [number] respondents to gather quantitative data. Finally, we conducted interviews with [number] experts in the field to obtain qualitative insights.Slide 3: Data AnalysisOur team used advanced statistical tools and techniques to analyze the collected data. We tabulated the survey responses and categorized them into key themes. By using various software, we conducted statistical tests to identify patterns, correlations, andsignificant relationships between variables. The interviews were transcribed and coded to extract key themes and insights.Slide 4: FindingsAfter analyzing the data, we identified several key findings regarding [topic]. These findings include [mention the most significant findings]. For example, we found that [state a key finding and its implications]. Additionally, we discovered that [another key finding and its implications].Slide 5: DiscussionIn this section, we will discuss the implications of our findings. We will analyze the data in the broader context of [topic]. We will explore the possible reasons for certain patterns, discuss the limitations of our research, and suggest areas for future research and improvement.Slide 6: ConclusionTo conclude our research report, we would like to emphasize that our findings provide valuable insights into the field of [topic]. The implications of our research can be applied to [relevant sectors or stakeholders]. We hope that our report serves as a foundation for further research and contributes to the knowledge on [topic]. Slide 7: Q&A SessionNow, I would be happy to answer any questions or address any concerns you may have regarding our research report.Slide 8: Thank YouFinally, I would like to express my gratitude to our team memberswho contributed their time, effort, and expertise to complete this research report. I would also like to thank our sponsors for their support and everyone present here for their attention. Thank you all for being a part of this presentation.In conclusion, our research report provides valuable insights into [topic]. Through our rigorous methodology, data analysis, and discussion, we aim to contribute to the existing knowledge in this field. Thank you once again, and I look forward to any questions or discussions.。
英文学术报告范例ppt课件
Layout
Background Experimental Program Experimental Results
➢ Comparison of compressive strength between UHTCC and matrix
Results
Comparison of strain at peak stress
Fig. 3. Comparison of strain at peak stress between UHTCC and matrix
篮球比赛是根据运动队在规定的比赛 时间里 得分多 少来决 定胜负 的,因 此,篮 球比赛 的计时 计分系 统是一 种得分 类型的 系统
Background
Numbers of studies carried out
➢ permeability and carbonation properties ➢ tensile and bending properties ➢ freeze-thaw properties
no uniform test available for the compressive properties
篮球比赛是根据运动队在规定的比赛 时间里 得分多 少来决 定胜负 的,因 此,篮 球比赛 的计时 计分系 统是一 种得分 类型的 系统
Comparison of stress-strain curves
The chart shows the comparison between the predictions and the test data of UHTCC
英文学术报告范例 PPT
c3cc2(c30.2c20.8)
Strain hardening branch: c1pc2
Horizontal branch: c3pc c3cc2(c30.2c20.8)
Descending branch: c3pc
0.2c
Comparison of stress-strain curves
➢ Comparison of compressive strength between UHTCC and matrix
➢ Comparison of strain at peak stress between UHTCC and matrix
A theoretical stress-strain curve model Conclusions
Results
Comparison of strain at peak stress
Fig. 3. Comparison of strain at peak stress between UHTCC and matrix
大家应该也有点累了,稍作休息
大家有疑问的,可以询问和交流
Theoretical model
Comparison of compressive strength
Conclusions
The prism compressive strength decreases because of the fiber addition.
The strain at peak stress is larger than that of matrix because of the fiber addition
英文学术报告PPT课件

.
8
EVALUATION
A. Prediction Accuracy
The scatter plot in Fig shows the fitted score (as the χ-axis) and the user score (as the Υ-axis) for each rate pair and time interval test set
Accuracy of prediction
.
10
EVALUATION
B. Comparison to PESQ
1) Fixed Rate
Prediction error: SILK versus PESQ for fixed-rate tracks
For the fixed-rate comparison, we included tracks in both
.
5
PROPOSED MODEL
B. Variable-Rate Model
where the effect of change frequency is distributed to the logarithm term, and the effect of hr and lr is distributed to the two subroutines, SCALE() and SHIFT() .
LARGE-SCALE EXPERIMENT
EVALUATION CONCLUSION AND FUTURE WORK
.
2
Background
THE EFFECTIVE end-to-end transport of delay-sensitive voice data has long been a subject of study in multimedia networking.
学术报告ppt 模板 (19)

目录
点击加入你标题
简洁大气|易编辑|任意替换内容
01
TEMPLATE
TEMPLATE
TEMPLATE
TEMPLATE
Click here to add you to the center of the narrative thought Click here toadd you to the center of the narrative thought Click here to add you tothe center of the narrative thoughtClick here to add you to the center of the narrative thought Click here toadd you to the center of the narrative thought Click here to add you tothe center of the narrative thought
英文报告ppt模板

Experimental design
01
Designing experiments to test specific hypotheses and
explore causal relationships
Qualitative research
02
In depth interviews, observations, and case studies to
Main body
This section should include the main content of the report, divided into coronary subsections with clear headings
Use bullet points or numbered lists to present information in a consensus and organized manager
based on the information presentation
Indicate what further steps or actions need to be taken as a
result of the report
Appendix
If there is any supplementary information that is relevant to the report, it should be included in an appendix at the end
CHAPTER
Introduction
Start with a brief overview of the topic covered in the report
英文学术汇报ppt模板

Dolor
1
In reprehenderit in voluptate velit esse cillum dolore eu fugiat nulla pariatur. Excepteur sint occaecat cupidatat non proident, sunt
2
in culpa qui officia deserunt mollit anim id est laborum. dolor in reprehenderit in voluptate velit esse cillum dolore eu fugiat nulla
4
mollit anim id est laborum. dolor in reprehenderit in voluptate velit esse cillum dolore eu fugiat nulla pariatur. Excepteur sint
5
occaecat cupidatat non proident, sunt in culpa qui officia deserunt.
Eiusmod Chart
Lorem ipsum dolor sit amet, consectetur adipisicing elit, sed do eiusmod tempor incididunt ut labore et dolore magnanderit in voluptate velit esse cillum dolore eu fugiat nulla pariatur. Excepteur sint occaecat cupidatat non proident, sunt in culpa qui officia deserunt mollit anim id est laborum.
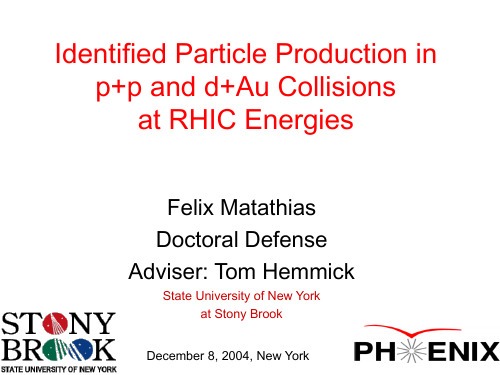
优秀学术报告PPT示例(Identified Particle Production)
Understanding the transition as a change of the number of degrees of freedom: Below Tc : dilute gas of 3 states of pions Above Tc : for 2 flavors we have
2
Comparative Nuclear Physics II
In this work we will be comparing particle production at
Center of Mass Energy: √s=200GeV Different nuclear environments:
The goal of Comparative Literature is:
“…to compare literature in different languages and literature with relation to some other field…” “…compare properties of particle production in different nuclear environments and as a function of particle flavor…”
3
Relativistic Heavy Ion Collider Brookhaven National Lab 2 counter-circulating rings 3.834 km circumference Superconducting magnets(3.5T) 192 dipoles per ring 246 quadrupoles per ring Time between collisions: 0.213 microseconds Crossing angle: 0 Bunch length: 20 cm Bunches per ring: 56 Luminosity lifetime: 3-10 hours Particles per bunch (units 1010):
- 1、下载文档前请自行甄别文档内容的完整性,平台不提供额外的编辑、内容补充、找答案等附加服务。
- 2、"仅部分预览"的文档,不可在线预览部分如存在完整性等问题,可反馈申请退款(可完整预览的文档不适用该条件!)。
- 3、如文档侵犯您的权益,请联系客服反馈,我们会尽快为您处理(人工客服工作时间:9:00-18:30)。
-
Thank You !
The chart shows the comparison between the predictions and the test data of UHTCC
The predicted curves are obtained by using the experimental strain value at peak stress instead of the fixed value of 0.002.
UHTCC
Prism
40×40×160
Matrix
Prism
40×40×160
Specimen
number 9a 9a
Suffix representation
p40u p40m
-
Results
Comparison of compressive strength
Fig. 1. Comparison of prism compressive strength between UHTCC and matrix
-
Results
Comparison of strain at peak stress
Fig. 3. Comparison of strain at peak stress between UHTCC and matrix
-
Theoretical model
Ascending branch:c1c2
-
-
Comparison of compressive strength
-
Conclusions
The prism compressive strength decreases because of the fiber addition.
The strain at peak stress is larger than that of matrix because of the fiber addition
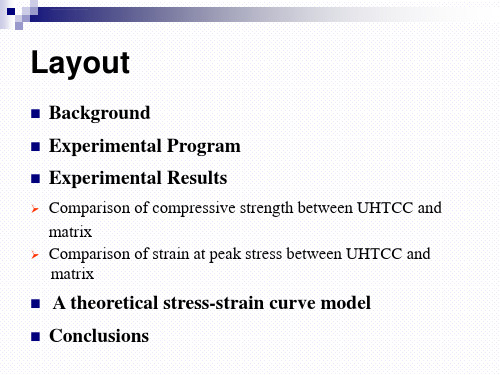
➢ Comparison of compressive strength between UHTCC and matrix
➢ Comparison of strain at peak stress between UHTCC and matrix
A theoretical stress-strain curve model Conclusions
structural applications are limited
-
Experimental Program
Experimental Program
Table 1. Specimen Information of Each Group
Test series Specimen shape
Specimen size/mm
-
Background
Numbers of studies carried out
➢ permeability and carbonation properties ➢ tensile and bending properties ➢ freeze-thaw properties
no uniform test available for the compressive properties
Experimental Study on Compressive Properties of Ultrahigh Toughness Cementitious Composites
-
Layout
Background Experimental Program Experimental Results
c3cc2(c30.2c20.8)
Strain hardening branch: c1 c2 c
Horizontal branch: c3 c c3cc2(c30.2c20.8)
Descending branch: c3 c 0.2c
-
Comparison of stress-strain curves