图表作文的专业包装..
图表式作文指导(胶印)
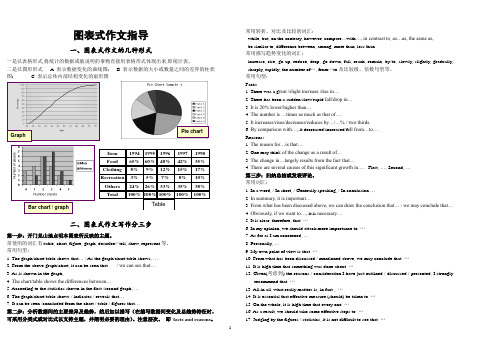
Bar chart / graph图表式作文指导一、图表式作文的几种形式一是以表格形式,将统计的数据或被说明的事物直接用表格形式体现出来,即统计表。
二是以图形形式 A 表示数据变化的曲线图; B 表示数据的大小或数量之间的差异的柱状图; C 表示总体内部结构变化的扇形图二、图表式作文写作分三步第一步:开门见山地点明本图表所反映的主题。
常使用的词汇有:table, chart, figure, graph, describe// tell, show, represent 等。
常用句型:1. The graph/chart/table shows that … / As the graph/chart/table shows , …2. From the above graph/chart, it can be seen that... / we can see that…3. As is shown in the graph, ...4. The chart/table shows the differences between…5. According to the statistics shown in the first /second graph, …6. The graph/chart/table shows / indicates / reveals that …7. It can be seen /concluded from the chart / table / figures that …第二步:分析数据间的主要差异及趋势,然后加以描写(在描写数据间变化及总趋势特征时,可采用分类式或对比式以支持主题,并阐明必要的理由)。
注意层次。
即 facts and reasons 。
常用转折、对比及比较的词汇:while, but, on the contrary , however, compare …with …, in contrast to , as…as, the same as, be similar to, difference between, among, more than, less than 常用描写趋势变化的词汇:increase, rise, go up, reduce, drop, go down, fall, reach, remain, by/to, slowly, slightly, gradually, sharply, rapidly, the number of …, from …to 及比较级,倍数句型等。
作文万能模板--图表作文
高考英语作文高三英语复习时要覆盖各类作文题材,以便在考场上看到任何类型的题目都能轻松搞定。
以下为大家整理了图表分析类作文题目及范文,供同学们参阅。
图表作文是高中英语作文中较常见的类型,要求学生通过图中数据和提示内容写一短文,属于比较、对照类。
也可根据提示写为议论文。
通常我们采取三段式写法:第一段:描述图表,得出结论。
第二段:紧扣主题,根据图表比较分析原因,论证结论。
第三段:发表议论,提出自己的看法。
常用句式:1. As can be seen from the chart,...As is shown in the chart,...2. The chart shows that about 60 percent of students want to go to college...3. From the graph/data/results/information above,it can be seen/concluded/show/estimated...4.The graph shows the changes in the number of...over the period from...to...pared with...,the number of the students of...高中英语作文图表作文万能模板:As is shown by the figure/percentage in the table /picture,____ has been on rise/ decrease,significantly/dramatically rising/decreasing from ____ in _____ to _____ in _____. From the sharp rise/decline in the chart,it goes without saying that _____.There are at least two good reasons accounting for _____. In one hand,____.In the other hand,_____ is due to the fact that ______.In addition,______ is responsible for _____. Maybe there are some other reasons to show ______.But it is generally believed that the above mentioned reasons are commonly convincing.As far as I am concerned,I hold the point of view that _______. I am sure my opinion is both sound and well-grounded.DIY:高考英语图表分析类作文题目1最近,你参加了高三年级组织的“你最重视哪科作业”的调查,结果见下面的饼状图。
英语专业四级写作备考四-图表作文
易犯错误&解决方法
盲目地把图表中所有数据都描写出来,不管是否和主题有 关。
解决方法:可以在描写和引用数字前,先把这些数据要反 映的问题用一句话写出来。这样就把数据看成是一种用来 说明问题的具体数据材料 (statistical evidence) 。选用的数 据必须和论述有关。
例2
Rising Divorce Rates in China
12%
58%
30%
1992
1
2
3
上图1、2 、3分别表示: 1:Graduates who continue to study 2:Graduates who take jobs irrelevant to their majors 3:Graduates who hold jobs in their majors
1. The rapid growth of divorce rates from 1987 to 1992 results from two obvious facts. The new marriage law simplifies the procedures of divorce. Besides, the improvement of women social status makes divorce a common thing.
2023最新整理收集 do something
Writing a Composition According
to Tables and Graphs
By Lara
Table of Contents
图表作文和一般作文的区别 看懂图表要领(1) 看懂图表要领(2) 图一、图二分析
易犯错误&解决方法 常用数字表达法 Basic Writing Structure etc. More Exercises
图画,图表和话题写作万能模板

图画,图表和话题写作万能模板万能模板⼀:图画或图表作⽂模板⼤作⽂From the drawing/chart, we can learn that (描述图表内容). It can easily be seen that (容易的就可以看出)quite a lot of people think it is important for them (做某事很重要,当然这个important还可以换成1:必要的necessary、2:critical关键的、3:meaningful有意义的)to understand this situation. We can deduce that people’s opinions on this issue vary from person to person(我们可以推断出来⼈们对此观点是因⼈⽽异的).Some people take it for granted that (认为…理所当然的)it’s not their duty to show their concern to it and there’s one in million chan ces for them to have such an experience(⼤部分认为⾃⼰亲⾝遇到这个问题的机遇⽐较⼩并且也没必义务去关注此问题). For example, they firmly believe that they should not know how to confront and deal with it. (他们坚定地认为⾃⼰没必要知道该如何⾯对和解决这个问题)But they often neglect that fact that once everyone just has such an attitude towards this, something practical need to be changed will make it progress slowly(但是他们通常忽视这个事实,⼀旦⼤家都采取⽆为态度的话,事情本⾝就会慢慢发展到需要做出相应改变的状态). On the contrary(相反地), there are also another group of people who hold a different point of view. (相反,还有另外⼀群⼈有不同的观点)They think that they should take their shoulder on this matter and tell people what to do and how to do step by step. (他们认为他们应当对这件事情肩负起责任,并且告诉他⼈做什么,⼀步⼀步⼜该怎么做)At the same time, their duty should be strengthened to make it into the unconscious aware. (同时,⼈们应该慢慢培养起对这件事的责任感,并且成为⼀种共识)As far as I am concerned(我认为In my opinion,或改成总之:In a word / to sum up/All in all), my attitude for this matter is positive(根据图表是⽀持还是反对还可以换成消极:negative), with reasons as follows. (我对这件事情持有积极态度)As the problem has a far effect/influence on(造成影响)both society and our life, we should pay more attention to it.学⽣范⽂1:学⽣范⽂学⽣范⽂(图表写作)这篇范⽂中的话题是responsibility,责任感。
大学英语四级作文模板:图表类作文
大学英语四级作文模板:图表类作文大学英语四级作文模板:图表类作文想要写好英语四级作文,背一些作文模板是很重要的,下面店铺为大家带来了图表类作文的四级作文模板,希望能够帮助到大家。
(1)英语四级作文模板According to the chart / graph / diagram / table, we clearly learn that _________. As early as _________,___________. Then,_________. Last,__________. In contrast, by _________,__________.There are many reasons accounting for _________. Firstly, _________.Secondly,__________. Finally,_________. As a result,_________.As far as I am concerned,_________. For one thing,__________. For another,________. In brief, I hold that__________.(2)英语四级作文模板What is shown in the chart / graph / diagram / table above indicates that in recent years, more and more people pay attention to _________. The number of those who _________ has increased ________, and furthermore,____________.There are two factors responsible for the changes. In the first place,_________. Moreover,__________. Yet, it is noticeable that __________.From the analysis, we can safely draw the conclusion that__________. It is possible that in the future, the tendency will__________.(3)英语四级作文模板It is obvious in the graph/table that the rate/number/amount of Y has undergone dramatic changes. It has gone up/grown/fallen/dropped considerably in recent years (as X varies). At the point of (接近)X1, Y reaches its peak value of (多少).What is the reason for this change? Mainly there are (多少)reasons behind the situation reflected in the graphic/table. First of all, (第一个原因). More importantly, (第二个原因). Most important of all, (第三个原因).From the above discussions, we have enough reason to predict what will happen in the near future. The trend described in the graph/table will continue for quite a long time (if necessary measures are not taken括号里的`使用于那些不太好的变化趋势).。
图表类作文写作方法

二是以图形形式 二是以图形形式 图形 A 表示数据变化的曲线图 表示数据变化的曲线图 曲线图; B 表示数据的大小或数量之间的差异 条形图; 的条形图 C 表示总体内部结构变化的扇形图。 表示总体内部结构变化的扇形图 扇形图。
图表类作文的形式及特点: 图表类作文的形式及特点:
是以表格(table)形式 表格(table)形式, 1) 是以表格(table)形式,将统计的数据或被说明 的事物直接用表格形式体现出来. 的事物直接用表格形式体现出来. 侧重于数据的排序。 侧重于数据的排序。
2004 Grain Milk Meat vegetable 49% 10% 17% 24% 2005 47% 12% 21% 22% 2006 45% 18% 28% 20% 2007 40% 30% 34% 20%
2004— 2007年人民饮食习惯变化表 2004 2007年人民饮食习惯变化表
2)表示数据的大小或数量之间的差异的条状图 2)表示数据的大小或数量之间的差异的条状图 表示数据的大小或数量之间的差异的 (bar chart) 侧重于数据的对比. 侧重于数据的对比.
2000与2007年平均家庭开支情况变化表. 2000与2007年平均家庭开支情况变化表. 年平均家庭开支情况变化表
图表作文的一般结构: 图表作文的一般结构:
第一、 第一、 开门见山地点明本图表所反映的主题 第二、 分析描写数据间的主要差异及趋势 第二、 第三、 第三、 归纳总结或发表评论
图表类说明文的写作步骤
分析数据间的主要差异及趋势然后描写在描写数据间变化及总趋势特征时可采用分类式或对比式以支持主题并阐明必要的理由
实战演练
星期一, 星期一, 我们开了个班会讨论 “上大学是高中 生唯一的出路吗? 以下图表是讨论结果. 生唯一的出路吗?” 以下图表是讨论结果
作文训练系列之图表作文(一)
• 参考答案
• Ladies and gentlemቤተ መጻሕፍቲ ባይዱn,
• I'm Li Hua. Today, I'm greatly honored to speak here on behalf of my school. I'm going to talk about the high school education of my city.
• I believe the future of the education in our city is promising!
• That's all. Thank you.
• 实战演练:
• 下面的饼状图(pie chat)显示了你对你校 学生兴趣爱好的调查结果。请你用英语给 English Weekly写一篇短文,报道你的调查 结果,并对此结果发表你的看法或建议。 字数120词左右。首句已给出(不计入词 数)。
• 注意: • 1.开头和结尾已给出。2.词数:100左右,不包括已给出部分。 • 3.参考词汇:non-local workers外来务工人员;vocational
school职业学校
• Ladies and gentlemen,
• I'm Li Hua. Today, I'm greatly honored to speak here on behalf of my school. I'm going to talk about the high school education of my city.
In my point of view, our school should have more sports facilities built to satisfy the need of the students. Guidance should be given to students on surfing the Internet and ways must be found to arouse students’ interests in reading and music.
图表作文
图表作文图表作文即把非文字信息(通常为用各种图表表示的数字信息等)转换成文字信息的一种作文。
它要求用文字来描述非文字性的图表或对图表显示的关系作解释说明。
图表作文可分为两大类:表作文和图作文。
1. 表作文即表格(table)作文(表示多种事物相互间的关系)2. 图作文------饼状图/圆面分割式图(pie chart)(表示各种事物在总数百分之一百中所占的各种比例)------线状图/曲线图、坐标图(line chart)(表示一种事物的上升或下降趋势)------条状图/立柱图、圆柱图(bar chart)(比较几种事物在同一时期上升或下降的情况)写作时常采用三段式的谋篇方式行文。
图表作文的写作要领:1)看懂并认真分析图表的含义,弄清图表中所含的信息及其不同信息间的关系。
2)确定文章的主题,构思出文章的框架,筛选能说明图表主题的典型数据,不用把图表中的数字全描写出来.。
3)写出各段的主题句。
4)将各段主题句扩展成段落,然后缀段成篇。
5)检查与修改。
图表作文的基本框架1)概述图表主题2)分析产生原因3)预测未来/提出解决方法或建议示范1:第一段:In recent years the divorce rate in China has increased drastically. According to a 1992 census Bureau Report on marriage and divorce in some big cities, during the past five years, the divorce rate has increased as much as it had in the entire previous twenty years. In 1967 there were only 0.5 divorced persons for every 1000 married people, and in 1987 the rate was 7 per thousand, but in 1992 the rate jumped to 15 divorced per 1000 married.示范2:Directions:1.描写图表所反映的问题。
20XX年12月四级写作万能格式:图表型精选作文
20XX年12月四级写作万能格式:图表型精选作文图表型作文此类作文要求考生从提示性文字或图表、图画入手,解释提示性文字、图表、图画反映出的问题,提出问题的危害性或解决这一问题的紧迫性;然后对问题展开分析,提出解决问题的方案或应对措施;最后一段要求考生表明自己的态度、做法等。
a.影响分析型关键句式The chart / graph/ table/ picture describes that the figure declines/ falls smoothly/ markedly. It indicates that…图表显示数字下降平缓,这表明….There may be a combination of factors which contribute to / are responsible for …可能是好几个因素造成的结果。
There may be several possible reasons to this phenomenon, which will be demonstrated as follows. 可能有几个原因导致了我们下面所要阐述的现象。
The significant effects of this phenomenon are undeniable, which can be concluded as the following aspects.这一现象的重大影响是不可忽略的,可大致归结为以下几个方面On one hand, …; On the other hand,…一方面,…;另一方面,…现象阐释类作文框架As is shown in the graph above, we can see clearly that greatchanges have taken place in … from…to… The first … years saw… The last … years witnessed …What are the reasons for the? On my standpoint, there are several as follows. First of all, (______). What is more, (______).Last but not the least,(______).The significant effects of this phenomenon are undeniable, which can be concluded as the following aspects. On one hand, …; On the other hand,…76 wordsb.问题解决型关键句式It is important that effective actions should be taken to prevent the situation. 采取有效措施防止这种情况的发生很重要。
专四作文辅导5图表作文讲解
整理ppt
图表作文概况
1. 图表作文要求对图表相关的信息进行归纳,对其重点和主要趋势进行汇报。 2. 图表主要有四种 (图例见P11-12) (1)line graph线型图-描述某事物的发展变化 (2)pie chart饼图-描述一个总体的不同部分的比例 (3)bar chart柱状图-用来比较两个以上数据的值 (4)table表格-用一行/多行单元格中的文本和数字展示数据的方式。 3. 图表作文注意事项: (1)时态一致(根据图表描述的事物的时间确定时态,无特定时间的用一般现在时) (2)采用正式书面文体 (避免Let’s look at…, Let me show you, It shows us之类带有口语性质的 描述 (3)客观描述图表,逻辑条理清晰,不增加个人主观猜想
3. A is ranked/rated first, accounting for 60% of…. It is followed by B at 30% and C at 25%.
A占最高比重,占……的60%。紧随其后的是占30%的B和占25%的C。
7
整理ppt
变化趋势-上升/增长、下降/减少
(2) The first two months of 1990 showed an increasing trend. ⑶ The rate rose to 32 in March but fell to 26 in June. ⑷ From June on, the rate was rising again and reached the peak point 39 in August. ⑸ After August the rate began to decline remarkably, and eventually dropped to the lowest point 16 at the end of the year.
- 1、下载文档前请自行甄别文档内容的完整性,平台不提供额外的编辑、内容补充、找答案等附加服务。
- 2、"仅部分预览"的文档,不可在线预览部分如存在完整性等问题,可反馈申请退款(可完整预览的文档不适用该条件!)。
- 3、如文档侵犯您的权益,请联系客服反馈,我们会尽快为您处理(人工客服工作时间:9:00-18:30)。
图表作文的专业包装手段在从事写作教学的四年多以来,很多学生会问我同样一个问题:“老师,我词汇量不大,语法也不算扎实,怎么才能搞定雅思作文呢?”其实,相比于大作文而言,小作文更容易在短期内提高,因为它语言“板正”并且规矩,所涉及的词汇,句式,包括连接词和代数据的方式都相对来讲比较固定,容易准备。
图表,是专业的调查报告的结果,不需任何“情感”的投入,只需强调客观事实。
为了拿到高分,我们的语言也需要被“武装”到位,往常口语的表达方式将很难满足考官的“胃口”。
从不计其数的学生作文中,我发现大多数中国考生在图表作文中容易出现的语言问题主要有三大类:1.词汇表达重复且不正式。
例如谈到“上升”只会用到“increase”;说到“下降”往往只想到“decrease”。
而这些词将在文章中反复出现,容易给考官乏味一感。
此外,缺少“亮点”词汇的文章也很难引人入胜。
2.句型使用过于单调。
大多考生被图表较为枯燥的数据影响,只顾着平铺直叙的表达,忘记了这是一场写作考试,不仅在乎你的思路,更在乎你的语言。
体现语言变化的最直接的方式就是将文章句型灵活转变,既让考官增加兴趣,又可展现考生的语言能力。
3.缺乏适合图表的书面连接手段。
在短暂的时间内,内容到位已经不容易,词句变化更加困难。
此时考生就更无暇关注细节的连词。
但一篇完整的文章怎么可以忽略了引导考官思路的“指路明灯”?下面我们就从小作文开头段,主体段,和结尾段各自需要的语言表达一一入手。
3.1开头段(Introduction)3.1.1小作文开头段常见词在评分时,考官最不想看到的是怎样的开头段?一是对题目的誊抄,会让考官对考生有懒惰,灵活度差的印象;二是对题目过度夸张的改写,为了寻求变化,而造成语序的“混搭”也是不可取的。
其实,开头段考生在题目改写的过程中,不需追求翻天覆地的改变,毕竟这并不是考官考察的关键,所以只需掌握常见的同义表达便可轻松拿下。
例如各种图形的名称就是其中一个必须要素。
此外,考生在备考时要熟背以下的常见开头段同义词替换表:开头段写作应尽量做到快且高质量,所以最实际的方法是准备一些图表作文的开头句式,以节省时间。
不用担心考官怪你“抄袭”哦,对于刻板的小作文,这些句型正中考官下怀。
相反地,花时间创作的开头并不一定能取悦考官。
3.1.2小作文开头段常见句型:3.2主体段 (Body)正如之前章节所说,小作文主体段描写的内容主要分为两大类,分别是趋势类和多少类。
所以我们需要从两类语言着手分别介绍语言。
在介绍词汇时,每组会有较多选择,考生若要做到语言的多样性,每组须背两到三个。
3.2.1 趋势类图表Number of people who became the UK citizens2040608010012019621972198219922002I n t h o u s a n d你知道考官不喜欢怎样的趋势表达吗?The number of people who became the UK citizens increased rapidly from 1992 to 1996. Then it decreased slowly in the next four years. Since 2001, the number rose dramatically again. Finally, it fell steadily until 2010.仔细分析便不难发现问题。
在趋势讲解清晰的同时,许多学生会忽略了语言的变化,和句型的多样。
若仅有最传统的词汇,和最通俗的句式,往往不能迅速取得考官芳心。
在考官眼中,哪些表达对他口味呢?表示下降的动词相关句型:1.There was a (dramatic/ steady/ slight) increase/ decline in the amount of …over the period from …to…There be句式在大小作文中都可适当穿插。
2.The data of …experienced/ underwent a considerable growth between …and…,rising from 2600 to 6300.“经历”一词可以使单词书面感加强。
分词的使用使得文章复杂感增强。
3.The period from ..to…saw a marginal decrease in the proportion of ….时间做主语,会让句型变化更为强烈。
“saw”在此刻做“见证”理解,充满了拟人的氛围,让语言更赋有吸引力。
4.The growth was suddenly replaced by a sharply downward trend.“被取代”有很强的承上启下之感。
5.a slight decline was actually found in bicycle travel.又是一句被动的成功范例。
6.The general trend of…is downwards/ upwards.表达总趋势时可派上用场。
7.Despite the impressive growth in the total workforce, however, there was a 10% decrease from 180000 to 161200 in the number of employees.“despite”后加名词或名词词组,“although”后则加句子。
8.Only in the 1700s was there an obvious decline.倒装句的点缀令语言锦上添花。
9.The number of …was 5 times more than that in 1900.倍数的表达可以使数据间关系更为清晰。
10.The number of ….was roughly doubled / tripled between 1996 and 2002.两倍,三倍的表达具有专业的动词表达。
表示稳定的修饰词表示到达多少数量的动词或词组相关句型:1.The number of …was enlarged by 9 times,amounting to 3.6 million square kms.表示稳定在某点的词组相关句型:1.In 1950, World oil discovery stood at 20 million barrels a year, which grew dramatically over the next 15 years to reach a peak at approximately 56 million in 1965.相关句型:1.The situation reached the peak / bottom at…in 2000.此句用来引出重点的极值,简单却实用。
表示占据的词组相关句型:1.… represented the largest share, accounting for 40%, compared with 18% in 2003.“占据”可以适用于一些数字为百分比的图表。
表达大约的词组在多少类文章当中,由于出现了更多孤立的数值,最容易出现数据的罗列。
考官在阅卷时,最怕看到的是这样的文章:In Egypt, the percentage of workforce who are women is 47%,while the percentage of managers who are women is 42%. In Australia, the two figures are 33% and 28% respectively. Finally, in America, the former rate is 48%,and the latter one is 36%.以上段落虽然清晰的呈现了各个数值,但极其容易让人审美疲劳,归根结底是因为除了单纯的数据罗列外,该考生并没有对其加以说明,没有告知考官数据间所体现的比较关系。
因此,这种多数人都惯用的语言往往得分相当低。
那么究竟什么样的词句算作适合并且专业呢?考官爱见到哪些高分的亮点呢?需要说明的是,虽然多少类的语言和趋势类有明显差别,但却可以共享许多词汇,例如“占据”,“达到”,“大约”等等。
所以这也是小作文的容易准备之处,看似有区别,但从整体写法上来讲,又似乎不可分割。
对广大考生而言,只要找准方法,效率将被大大提高。
表示超过的词和词组表示幅度大的修饰词1.The percentage of A is more than twice that of B.A 是B的两倍多。
用于两者间对比大小时使用。
2. The percentage of A is slightly larger than that of B.最为传统的表示比较的句式。
3.The chart shows that male players outnumbered their female counterparts(72% and 28% respectively).使用“outnumber”时,主语应是对象本身,而不是比例。
4.The amount of A exceeded that of B ( 15 million and 8 million for each).“exceed”使用时主语是数字或比例。
5.The numbers in other three countries are considerably lower, averaging between 300 and 400.比较高低时实用的手法,并且“平均”的表达使画面感更强,更有概括力。
6.A has approximately/ precisely the same amount/ proportion as B.A和B的比例差不说/正好一样。
1.Japan enjoyed the fastest rate of increase (42.5%), with Australia(21.5%) and USA(13%) ranking the second and third respectively.排列顺序时必要的高分套句,独立主格的语法给文章加分。
2.A ranks first(number), followed by B. Next comes C.D lies last, with…“followed by”是排序时极为精练的高分手段!分词的使用是一大亮点。
3.On top of the list is..., which accounts for 70%.在数据比较时引出最大值。