雅思写作Task1柱状图考官范文(4)
雅思写作Task1柱状图考官范文(4)
本文为大家收集整理了雅思写作Task1柱状图考官范文(4)。认真研读一定的雅思范文及作文模板可以帮助我们检验自己的写作水平,并能很好地吸收和应用优秀范文里的优秀内容。
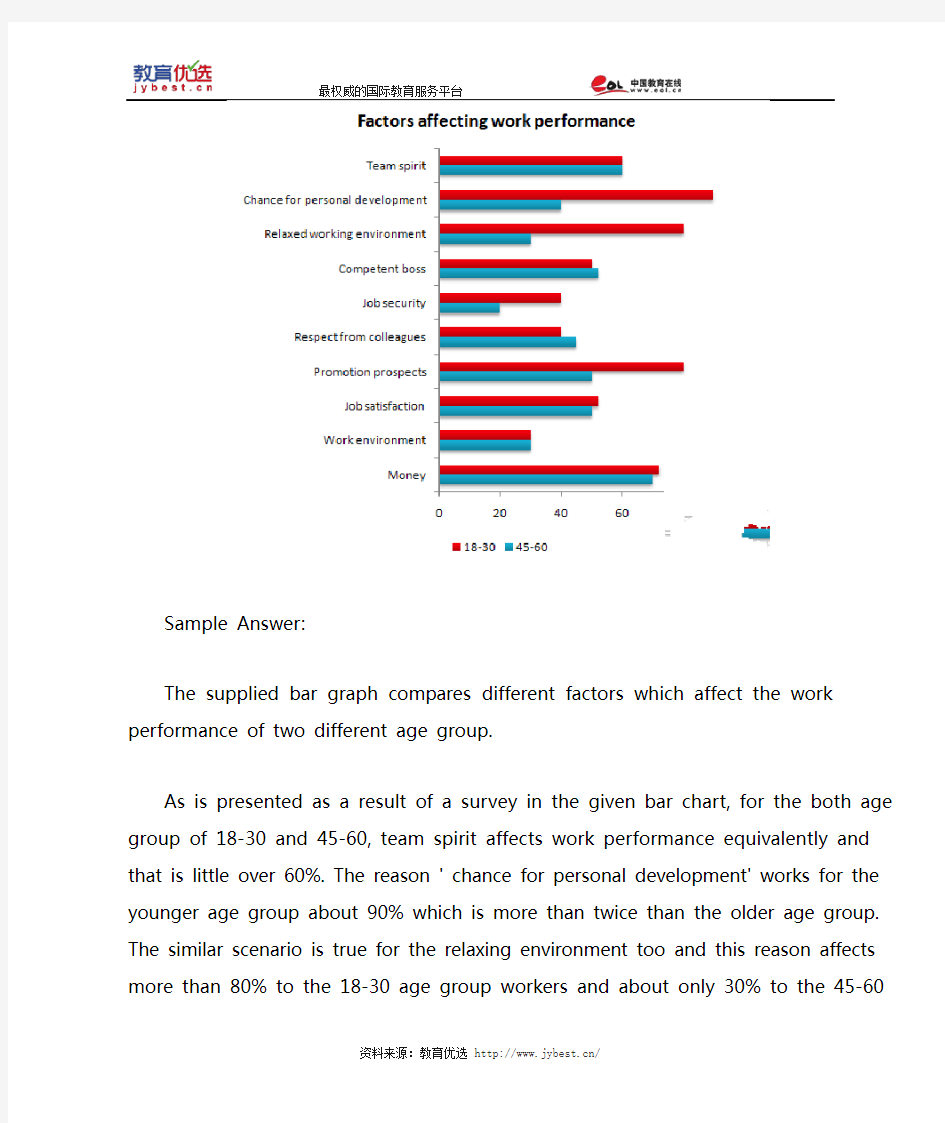
The bar chart below shows the results of a survey conducted by a personnel department at a major company. The survey was carried out on two groups of workers: those aged from 18-30 and those aged 45-60, and shows factors affecting their work performance.
Write a report for a university lecturer describing the information shown below.
Sample Answer:
The supplied bar graph compares different factors which affect the work performance of two different age group.
As is presented as a result of a survey in the given bar chart, for the both age group of 18-30 and 45-60, team spirit affects work performance equivalently and that is little over 60%. The reason ' chance for personal development' works for the younger age group about 90% which is more than twice than the older age group. The similar scenario is true for the relaxing environment too and this reason affects more than 80% to the 18-30 age group workers and about only 30% to the 45-60 years workers. About 45% younger workers' work performance is affected by the job security compared to little over 20% older workers. The only case where 45-60 years workers are influenced more than their younger
counterpart is 'respect from colleagues' which is about 50% for this age group workers in contrast to 40% (approximately ) for the 15-30 years age group. Promotional prospects is a reason that drive younger employees to work better and this reason affects 80% younger workers compared to almost 45% aged job holders. For the lower age group job satisfaction, work environment & money affects their job performance about 50%, 30% & about 75% consecutively compared to about 45%, 30% and 70% of 45-60 years job holders.
In short , workers job performance are highly affected by chance for personal development, team spirit, promotion prospects, job satisfaction and salary.
(Approximately 249 words)
雅思小作文柱状图Bar类解析
雅思小作文柱状图Bar类解析 关于柱状图我们主要分两种写法: 1.如果横轴有明显的时间推移的话,烤鸭们应连接柱子顶点,重在描述柱子的升降起伏,写法类似于线状图。 2.如果无时间推移,则写法和饼状图一样。即按照各比较对象所占比例的高低写,同时要注意各所占比例之间的比较。 可以用到的词汇有: 1.表示“占多少”的动词 Account for Take up Make up Contribute to Have Represent 2.表示“最高级”和“比较级” 第一/最小the largest/biggest proportion of 第二the second/next largest/expensive(+ 形容词的最高级) 第三followed closely by 最低/最小the smallest percent of all 3.表示“相同比例” 即在饼状图中遇到了比例相同或者差不多的饼,如有A B两个比较对象。 A accounts for the same percentage as B . The proportion of A is as high as B A and B contributed equally/evenly to (all ) 在观察柱形图的时候首先要留意横轴的数据,若横轴为时间轴或者是年龄趋势,那么我们在主体段写作时候的基本思路就为从左到右;若横轴数据为具体专有名词诸如地点,交通工具等时,主体段的写作思路就可能是按照柱形的长度排列。本文根据上述的分析做以下的总结: 一、按照横轴从左到右排列数据: 1. 两根柱且趋势截然相反 在这种写法中,我们要注意观察2根柱的上升/下降的幅度。以下我们就来看一个例子:
雅思A类Task1图表作文实例(上)
You should spend about 20 minutes on this task. The graph below compares the number of visits to two new music sites on the web. Write a report for a university lecturer describing the information shown below. You should write at least 150 words. model answer: The graph shows people using new music places on the Internet in fifteen days period of time namely personal choice and trendy pop music. The overall trend shows fluctuation with slight Increased towards the end of the period. Starting with Music Choice websites; 40,000 poeple went on this new site on first-day. Half of them backed out the next day. In Contrast to this Pop Parade net sites were visited by 120,000 music lovers on day one which decreased slightly on the next day thereafter regaining the same fame on 3rd day. After 3rd day the enthusiasm for both music lines on Internet dropped slowly- reaching maximum fall of 40,000 on 7th day. Whereas Music choice gained popularity, slightly Improoving to get the original strength of 30,000 viewers on screen, but was getting still less visiters than their opponent Pop group i.e. 40,000 on day 7. In the biegining of the next week both gained remarkable recovery after a few fluctuations for
雅思大作文广告类句观点总结
雅思大作文广告类句观 点总结 Company number:【WTUT-WT88Y-W8BBGB-BWYTT-19998】
雅思大作文广告类句观点总结 Advertising 广告类 Positives of Advertising 广告的优点 Advertising is a key part of modern need to tell customers about their inform us about the choices we have. 广告是现代商业的重要组成部分。公司需要告诉消费者他们的产品。广告告诉我们有哪些选择。 Advertising is a creative industry that employs many people. 广告是一个创业产业,吸纳了很多就业。 People enjoy advertising we would have less choice. 人们喜欢广告。.没有广告,我们的选择很少。 Without advertising there would be higher unemployment. 没有广告会有更高的失业率。 Advertising is a form of modern art. 广告是现代艺术的一种形式。 Negatives of Advertising 广告的缺点 Advertising manipulates aims to persuade people that buying a product will make them happier.
广告操纵着人们。它的目标是说服人们去购买产品让他们高兴。 Advertisers focus on selling a brand are encouraged to associate certain brands with a higher status. 广告重在售卖一种品牌印象。我们会不自觉的将一些品牌与社会地位关联在一起。 They use glamorous,successful people. 他们使用迷人的,成功的人(作为形象代言)。 We now live in a consumer are persuaded to follow the latest trend. 我们生活在消费文化里。我们被说服去紧跟潮流。 Advertisers often aim their marketing at can easily be influenced by put pressure on parents to buy them things. 广告商经常把营销目标瞄准儿童。儿童很容易被广告影响。而孩子带给家长购买压力。 Opinions about Advertising 关于广告 Advertising should be aimed at children should be controlled or even banned. 广告应该被监管。将广告瞄准儿童应该受到控制甚至禁止。 Unhealthy foods should not be marketed in a way that Products that can be risk to healthy should display warnings. 垃圾食品不应该以一种吸引人的方式推广。危害到健康的儿童产品应该标示警示文字。
Simon考官范文-雅思写作Task 2: problem/solution(问题与解决办法) essay
题目: In the developed world, average life expectancy is increasing. What problems will this cause for individuals and society? Suggest some measures that could be taken to reduce the impact of ageing populations. 范文: It is true that people in industrialised nations can expect to live longer than ever before. Although there will undoubtedly be some negative consequences of this trend, societies can take steps to mitigate these potential problems. As people live longer and the populations of developed countries grow older, several related problems can be anticipated. The main issue is that there will obviously be more people of retirement age who will be eligible to receive a pension. The proportion of younger, working adults will be smaller, and governments will therefore receive less money in taxes in relation to the size of the population. In other words, an ageing population will mean a greater tax burden for working adults. Further pressures will include a rise in the demand for healthcare, and the fact young adults will increasingly have to look after their elderly relatives. There are several actions that governments could take to solve the problems described above. Firstly, a simple solution would be to increase the retirement age for working adults, perhaps from 65 to 70. Nowadays, people of this age tend to be healthy enough to continue a productive working life. A second measure would be for governments to encourage immigration in order to increase the number of working adults who pay taxes. Finally, money from national budgets will need to be taken from other areas and spent on vital healthcare, accommodation and transport facilities for the rising numbers of older citizens. In conclusion, various measures can be taken to tackle the problems that are certain to arise as the populations of countries grow older. (265 words, band 9)
雅思写作Task1曲线图考官范文(5)
雅思写作Task1曲线图考官范文(5) 本文为大家收集整理了雅思写作Task1曲线图考官范文(5)。认真研读一定的雅思范文及作文模板可以帮助我们检验自己的写作水平,并能很好地吸收和应用优秀范文里的优秀内容。 The chart and graph below give information about sales and share prices for Coca-Cola. Write a report for a university lecturer describing the information shown below. Sample Answer: The given pie chart and line graphs show the data on sales volume and share price of Coca-Cola. As is given in the illustration, in the year 2000, Coca-Cola was sold most in America where it had more than 55% sales volume. The share price of Coca-Cola was highest in 1998 and reached to around 55 in 2001 with some fluctuation.
As is presented in the pie chart, in 2000, Coca-Cola had more than 55% sales in Latin and North America. In Europe it had more than 20% sales volume, in Asia 16.45% and in Africa it had 7% sales volume. This indicates that American continent has the largest market for Coca-Cola while this market is least in African Continent. Again, the share price of Coca-Cola was only $ 33 in 1996 and this price increased to $ 68 in 1997. The price reached to the highest in 1998 when it was $ 80 per share. The price then started dropping and with some fluctuations it reached it around $ 60 in 2001. In summary, the American Continent was the largest market for Coca-Cola in 2000 and the average share price of it is $60 though this price varies year to year. (Approximately 202 words)
雅思写作大作文范文 雅思写作报告类 城市成活困难与解决方案.doc
雅思写作大作文范文雅思写作报告类城市成活困难与解决方案 今天我们雅思写作大作文范文的文章来研究下城市生活困难与解决方案。随着城镇化的发展,越来越多曾经居住在郊区或者农村的人移居到城市之中。他们希望找到一份工作,从此过上更好的生活。但是,城市有其自己的问题。物价较高、住房紧张、交通拥堵、空气污染、上学难、看病难等问题一直困扰着市民。那么政府可以做些什么来解决或者减轻这些问题呢?小编搜集了一篇考官范文,以供大家参考。 雅思写作大作文题目 More and more people are migrating to cities in search of a better life, but city life can be extremely difficult. Explain some of the difficulties of living in a city. How can governments make urban life better for everyone? 越来越多的人为了更好的生活移居到城市之中,但是在城市生活下去可能极其困难。说明一些居住在城市中的具体困难。政府应该如何做才能使城市生活变得更好。 雅思写作大作文范文 Cities are often seen as places of opportunity, but there are also some major drawbacks of living in a large metropolis. In my opinion, governments could do much more to improve city life for the average inhabitant. 城市经常被看作是充满机会的地方,但是居住在巨型城市中也有一些明显的缺陷。在我看来,政府在为居民提升生活品质方面还可以做的更多。 The main problem for anyone who hopes to migrate to a large city is that the cost of living is likely to be much higher than it is in a small town or village. Inhabitants of cities have to pay higher prices for housing, transport, and even food. Another issue is that urban areas tend to suffer from social problems such as high crime and poverty rates in comparison with rural areas. Furthermore, the air quality in cities is often poor, due to pollution from traffic, and the streets and public transport systems are usually overcrowded. As a result, city life can be unhealthy and stressful. 希望移居到大型城市中的人的主要问题是生活成本可能要比小的城镇或者村庄高很多。城市居民不得不为住房、交通、甚至是食物支付更高的价格。另一个问题是,与郊区相比,城市区域倾向于遭受各种社会问题的困扰,如高犯罪率和高贫困率。此外,由于来自交通的污染,城市中的空气质量经常很差。街道和公共交通通常都很拥挤。因此,城市生活可能既不健康,又压力巨大。 However, there are various steps that governments could take to tackle these problems. Firstly, they could invest money in the building of affordable or social housing to reduce the cost of living. Secondly, politicians have the power to ban
雅思小作文范文-柱状图
1.四国人口 The chart below shows the percentage of population in India, China, the USA and Japan in 1950 and 2002. 思路: 【首段】转述题目+补充信息【二段】中国的人口规律和未来趋势【三段】印度的【四段】美国和韩国的【尾段】总结,重申全图最主要趋势,印度将取代中国成人口第一大国 答案: The bar chart compares the changes in the proportion of population in India, China, the USA and Japan in 1950 and 2002. And it also indicates the projections for 2050. In 1950. China accounted for one fourth of the world population. Although this figure decreased slightly, it still ranked the first in 2002, compared to other three countries. It is estimated that the population in China will continue to drop to 19 per cent in the middle of this century. India ranked the second in terms of the population in the table, which made up 15 percent in 1950, but since then, there was a dramatic increase, climbing to approximately 19 percent. The percentage is expected to increase slightly to 21 per cent in 2050 and will probably exceed that in China. When it comes to the population in the USA and Japan, both of which witnessed a decrease from 1950 to 2002. It is predicted that in 2050, the percentage will remain the same in the USA, and in Japan, the percentage is likely to keep falling. Overall, it seems that India will become the country with the largest population although there is still a huge number of people in China.
雅思写作Task1饼状图考官范文(4)
雅思写作Task1饼状图考官范文(4) 本文为大家收集整理了雅思写作Task1饼状图考官范文(4)。认真研读一定的雅思范文及作文模板可以帮助我们检验自己的写作水平,并能很好地吸收和应用优秀范文里的优秀内容。 The table below shows CO2 emissions for different forms of transport in the European Union. The Pie Chart shows the percentage of European Union funds being spent on different forms of transport. Write a report for a university lecturer describing the information in the graph below.
Sample Answer: The given graphs provide information on the amount of Carbon dioxide emission per person from different vehicles in the European Union and also show the expenditures on different modes of transportations. As is observed from the given illustration, the highest amount of CO2 per person is emitted by the Air transports and European Union spends highest percentage of funds for the road transportation system. According to the bar graph, a single passenger of a personal cars emit around 130 gm of CO2 per kilometer while a passenger in a bus contribute to 65 gm of emission per kilometer. Coaches, maritime and rail passengers emit the lowest amount of CO2which is about 50 grams per passenger in a kilometer. Finally a single passenger of airplane contributes to 370 km of CO2 per kilo which is the highest amount of CO2 emission among the given transportations. Based on the pie chart, the European Union spent the highest amount (52%) on the road transportation system while spent only 1% or 2% on ports, waterway airport
慎小嶷 《十天突破雅思写作》总结2
General Knowledge 注意: 1. 作文要有实质内容。 2. 6分:260~270个词左右;6.5分:280个词以上。 3. 没有必要一定写长难句,但要提高句子的准确度和多样性。必须在对英语造句知识准确理解和把握的基础上流畅地写出复杂的长句子,而不是刻意、机械地拉长句子。(准确、严密、多样、清晰) 4. 对于零星出现的少量拼写错误,只要不引起歧义,是不会导致严重扣分的,但要努力减少作文里出现拼写错误的可能。 5. 考场里没有时间打草稿,但可以在印考题的试题纸上把看到题目后头脑里闪现出的ideas、考前准备的相关加分词汇和句型大致记录一下。 6. 当考官要求停笔时即使还没有写完也一定要停下来,否则会被判为违纪行为。 7. 考前练习一定要尽可能模拟实战:下载标准格式的答题纸;用铅笔写作,每行10~12个单词;严格控制时间,Task 1不应超过25 min,Task 2不应超过45 min。备考初期,可将Task 1和Task 2分开练习,但在考前一周内,必须演练完整的写作考试全程,严格控制时间,写完后再核对或请有经验的老师批改。 8.
如果Task 2准备得较为充分,有信心在40min写出一篇自己满意的议论文,那么就先完成Task 2。反之,就先写Task 1。 9. 齐头式:每段开头顶格写,每两段之间空一行 缩入式:每段开头后退3~4个字母的距离,每个段落之间不空行 10. 可使用I/we、被动语态,但不宜滥用;可将But/So放在句首 11. 7分或以上的作文对于用词的要求是准确,而不是冗长 ?Topics ?学术类写作的特殊要求 1. 不接受缩写形式 2. 不使用非正式口语表达 3. 英美拼写不能混淆 4. 用词要有特色 5. 句式不能过于短促 6. 句式不能过于干瘪 7. 感情色彩不能过于强烈
雅思写作-小作文范文-柱状图
雅思经典小作文柱状图4篇范文+写作要点分析 C1T3 题目 The chart below shows the amount of money per week spent on fast foods in Britain. The graph shows the trends in consumption of fast foods. Write a report a university lecturer describing the information shown below. The chart shows that high income earners consumed considerably more fast foods than the other income groups, spending more than twice as much on hamburgers (43 pence per person per week) than on fish and chips or pizza (both under 20 pence). Average income earners also favored hamburgers, spending 33 pence per person per week, followed by fish and chips at 24 pence, then pizza at 11 pence. Low income earners appear to spend less than other income groups on fast foods, though fish and chip remains their most popular fast food, followed by
雅思写作Task1饼状图考官范文(4)
雅思写作Task1饼状图考官范文(4) The table below shows CO2 emissions for different forms of transport in the European Union. The Pie Chart shows the percentage of European Union funds being spent on different forms of transport. Write a report for a university lecturer describing the information in the graph below. Sample Answer: The given graphs provide information on the amount of Carbon dioxide emission per person from different vehicles in the European Union and also show the expenditures on different modes of transportations. As is observed from the given illustration, the highest amount of CO2 per person is emitted by the Air transports and European Union spends highest percentage of funds for the road transportation system.
雅思图表作文TASK1精讲精练
雅思图表作文TASK1精讲精练
雅思图表作文TASK1精讲精练 A理论部分: 雅思小作文概论 1、文章结构:主要分三部分:i。introductory sentence;ii。body paragraph;iii。Concluding sentence 具体讲:第一段introductory sentence只要写一句话,交待图形(如the line graph, pie chart等等),描述对象(如图表描述的是the number of tourists visiting England),地点(如the US, the UK等)以及时间(如between 1988 and 1997等等);另外要注意的就是第一段不能和图表上方已给的句子太过相似!否则,会失分的! 第二部分一般写1~3段,这要视情况而定。这部分主要就是对比不同的数据,如相似或相同的数据;某个数据是另一个数据的2倍;某个数据所占比例最大或最小等等。 最后一段concluding sentence也只要写一句话,
主要是总结图表的整个趋势。 2。文章的效果。很多学生会发现小作文的例文特别简单(特别是剑桥书里提供的)。原因很简单,这个report的目的就是要让university lecturer了解某个事物的发展趋势,因此写出来的文章必须结构清晰、易懂,绝对不能太复杂,也不要把每个数据都描写出来,只要描写有代表性的,重要的数据即可。 以下为雅思小作文的四个基本步骤 第一步:改写题目 经过同义词转换在短短的1分钟内就写好作文的第一段。 举例:The graph below shows the percentage of people unable to find work in three major countries from 1983 to 1992. 题目中划线的单词都能够进行同义转换: graph—figure, show—illustrate, percentage—proportion, major—key, from…to…—between…and…, 第二步:分析时态
最新雅思小作文柱状图模板
最新雅思小作文柱状图模板
雅思小作文A类慎浩(words= 163) 第一段:题目改写与仿写 第二段:总体趋势1 发展变化2 比较 第三段:期中一种情况+另一种情况 第四段:结论段 最大值最小值中间值特殊值起点终点 环球雅思慎浩 Through what is provided in the(图形),we can learn the information about major shifts in(标题) during the period of时间respectively bar / column chart / graph
第一段:题目改写仿写 Through what is provided in the six column charts(图形),we can learn the information about major shifts in aids given by six developed countries(标题) during the period of, and respectively. =33 Through prep 经过 be provided in v.t 提供 Major shift n 主要的变化 graph n 图形 During the period of adj. 在。。。。的时期内Respectively adv 分别地 Column chart 柱状图 bar chart 柱状图 Line chart 线形图 pie chart 饼状图 map 地图 Process 流程图 First and foremost Besides, in addition , 第二段句型 In general, it is noticeable that the total 项目in 时间were slightly more than that in时间, being approximately数值and数值respectively. In
雅思写作Task1曲线图考官范文(1)
雅思写作Task1曲线图考官范文(1) 这是一篇雅思写作Task1曲线图考官范文。认真研读一定的雅思范文及作文模板可以帮助我们检验自己的写作水平,并能很好地吸收和应用优秀范文里的优秀内容。 The graphs below show the numbers of male and female workers in 1975 and 1995 in several employment sectors of the republic of Freedonia. Write a report for a university teacher describing the information shown.
Sample Answer: The provided line graphs compare the employment history of men and women in 1975 and 1995 dividing in six major sectors namely: manufacturing, communications, finance/ banking, wholesale & retail trade, non-defence public sectors and defence public sectors. As is observed from the given illustration, significant changes have been made in women's employment and women appear to have made remarkable improvements in almost the entire job sectors in Freedonia and in some sectors women went well ahead of men. Initially in 1975, men were notably ahead of women in every sector of employment. For example, in communication sector about 260 men worked against 220 women in every thousand employees. Twenty years later, though the number of men remained unchanged, the number of women rose to over 550 in one thousand. A similar trend can be seen in the wholesale and retail trade sector, where the number of women rose from about 550 to almost 800 in every 1000 employees of this sector two decades later. The number of men in this sector remained stable over the period, at around 700 / thousand.
雅思写作Task 1数据类图表之六种常见变化趋势分析
雅思写作Task1数据类图表 之六种常见变化趋势分析 雅思写作考试分为Task1和Task2两个部分,其中Task1这个部分主要考察考生对各种图表的主要特征和情况的客观概述能力。这些图表主要分成两种类型:数据类和图画类。其中数据类图表(线形图、饼状图、柱状图、表格)是出现频率相对较高的一种类型,因此也就是Task1的考察重点。这种图表表现形式多样,尤其是数据类型及变化繁杂,常常让考生望图生畏。针对这一难题,本文中,留学无忧的老师将总结数据类图表中常见的六种数据变化的趋势,帮助广大考生拨开迷雾。 一、上升/增长 上图描绘了英国本地固话、国内及国际固话和移动通讯的通话时长从1995年到2002年的变化情况。观察其中“National and International-fixed line”即国内及国际固话通话时长从1995年至2002年的变化,发现其数据整体呈现稳步增长这一趋势,虽然在最后两年其增长幅度明显放缓: National and international fixed line calls grew steadily from1995to2002, though the growth slowed over the last two years.
除了例句中的grew(grow v.)表示增长,还有increase/climb/ascend/rise/mount/ go up等表达。在表达增长幅度放缓时用到了“稳步地”、“缓慢地”这一类副词,除了steadily,还有gradually,slowly,mildly,moderately等。 二、下降/减少 上图描绘了从1979年到2004年鱼肉、羊肉、牛肉和鸡肉的消耗情况。观察其中“Beef”、“Lamb”的销量变化,即从1979年至2004年它们数值的变化,发现其数据整体都呈现急剧下降这一趋势: Between1979and2004,the consumption of beef and lamb fell dramatically. 除了例句中的fell(fall v.)表示下降,还有decrease/go down/drop/fall/descend/ decline等表达。在表达急剧下降时用到了“急剧地”这一类副词,除了dramatically,还有drastically/steeply等。当然这种情况也可以用到“显著地”这类副词,有considerably/ significantly/remarkably/markedly/notably/noticeably等。 三、持平/不变
雅思作文媒体类话题必备词汇
媒体类话题必备词汇与例句 1.客观的objective I believe that a journalist should be completely objective... 我认为新闻记者不应当有丝毫偏见。 The psychiatrist must learn to maintain an unusual degree of objectivity. 精神科医生务必要学会保持超乎寻常的客观态度。 2.有偏见的biased University funding was tremendously biased towards scientists. 大学科研经费向科学家极大地倾斜。 Many parents are biased against popular music. 许多父母对流行音乐有偏见。 The judgement is often biased by interest. 判断往往因利害关系而有偏差。 3.名人celebrity Does he find his new celebrity intruding on his private life? 他是否感觉到他最近的成名侵扰了他的私生活? It seemed difficult for the celebrity couple to get rid of the ubiquitous paparazzi. 这对名人夫妻想要摆脱无所不在的狗仔队似乎很困难。 4.新闻界the press Today the British press is full of articles on India's new prime minister. 今天英国的报纸上登满了关于印度新任总理的文章。 The government has imposed strict censorship on the press.