2012高教社杯全国大学生数学建模竞赛一等奖论文
2012高教社杯全国大学生数学建模竞赛全国一等奖A题
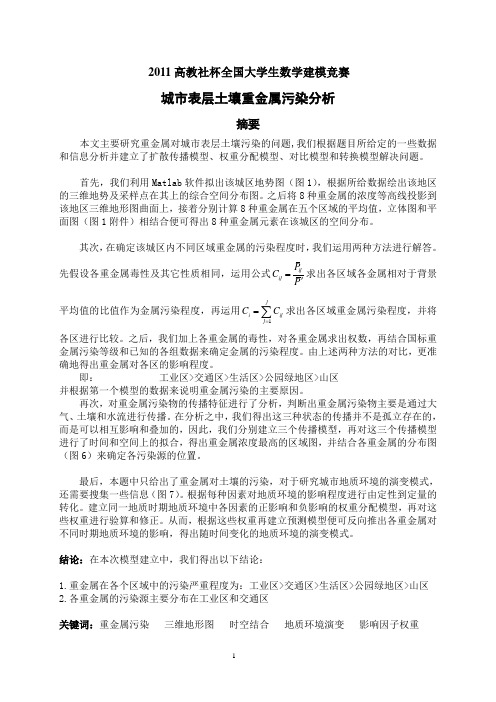
2011高教社杯全国大学生数学建模竞赛城市表层土壤重金属污染分析摘要本文主要研究重金属对城市表层土壤污染的问题,我们根据题目所给定的一些数据和信息分析并建立了扩散传播模型、权重分配模型、对比模型和转换模型解决问题。
首先,我们利用Matlab 软件拟出该城区地势图(图1),根据所给数据绘出该地区的三维地势及采样点在其上的综合空间分布图。
之后将8种重金属的浓度等高线投影到该地区三维地形图曲面上,接着分别计算8种重金属在五个区域的平均值,立体图和平面图(图1附件)相结合便可得出8种重金属元素在该城区的空间分布。
其次,在确定该城区内不同区域重金属的污染程度时,我们运用两种方法进行解答。
先假设各重金属毒性及其它性质相同,运用公式ijij P C P ='求出各区域各金属相对于背景平均值的比值作为金属污染程度,再运用1ji ij j C C ==∑求出各区域重金属污染程度,并将各区进行比较。
之后,我们加上各重金属的毒性,对各重金属求出权数,再结合国标重金属污染等级和已知的各组数据来确定金属的污染程度。
由上述两种方法的对比,更准确地得出重金属对各区的影响程度。
即: 工业区>交通区>生活区>公园绿地区>山区 并根据第一个模型的数据来说明重金属污染的主要原因。
再次,对重金属污染物的传播特征进行了分析,判断出重金属污染物主要是通过大气、土壤和水流进行传播。
在分析之中,我们得出这三种状态的传播并不是孤立存在的,而是可以相互影响和叠加的,因此,我们分别建立三个传播模型,再对这三个传播模型进行了时间和空间上的拟合,得出重金属浓度最高的区域图,并结合各重金属的分布图(图6)来确定各污染源的位置。
最后,本题中只给出了重金属对土壤的污染,对于研究城市地质环境的演变模式,还需要搜集一些信息(图7)。
根据每种因素对地质环境的影响程度进行由定性到定量的转化。
建立同一地质时期地质环境中各因素的正影响和负影响的权重分配模型,再对这些权重进行验算和修正。
优秀数学建模论文(全国一等奖)

承诺书我们仔细阅读了中国大学生数学建模竞赛的竞赛规则.我们完全明白,在竞赛开始后参赛队员不能以任何方式(包括电话、电子邮件、网上咨询等)与队外的任何人(包括指导教师)研究、讨论与赛题有关的问题。
我们知道,抄袭别人的成果是违反竞赛规则的, 如果引用别人的成果或其他公开的资料(包括网上查到的资料),必须按照规定的参考文献的表述方式在正文引用处和参考文献中明确列出。
我们郑重承诺,严格遵守竞赛规则,以保证竞赛的公正、公平性。
如有违反竞赛规则的行为,我们将受到严肃处理。
我们参赛选择的题号是(从A/B/C/D中选择一项填写):我们的参赛报名号为(如果赛区设置报名号的话):所属学校(请填写完整的全名):参赛队员(打印并签名) :1.2.3.指导教师或指导教师组负责人(打印并签名):日期:年月日赛区评阅编号(由赛区组委会评阅前进行编号):编号专用页赛区评阅编号(由赛区组委会评阅前进行编号):全国统一编号(由赛区组委会送交全国前编号):全国评阅编号(由全国组委会评阅前进行编号):A题:出版社的资源配置摘要本文根据题目的要求建立了合理的有限资源分配优化模型,我们借助多种数学软件的优势挖掘出大量数据潜在的信息,并将其合理运用,在此基础上,以利润最大为目标,长远发展为原则,制定出信息不足条件下的量化综合评价体系,并为出版社在2006年如何合理有效地分配有限的书号资源提供了最佳的分配方案。
在本文所建立的模型中,我们采取了层次分析法(AHP)、数据统计拟合以及整数线性规划相结合的手段,这样既借鉴了层次分析法综合评价的优势,又克服了该法中主观因素的不确定性,使模型更具有科学性,作出了出版社2006年的分配方案,如下表经过对模型的检验,单从生产计划准确度一项来看,模型所得出的结果就比以往的高,这样就首先保证了出版社获得年度稳定利润的前提,其他几个评价指标也都可以得出相似的结论。
以2006年与2005年生产计划的准确度为例,作比较:2005年的各分社平均生产计划的准确度为0.702006年的各分社平均生产计划的准确度为0.85平均准确度提高约21%从数据的对比中,我们很容易看出本模型具有较高的有效性和合理性。
2012CUMCM全国大学生数学建模竞赛A题论文

2012CUMCM全国大学生数学建模竞赛A题论文D进行网上公示,在书籍、期刊和其他媒体进行正式或非正式发表等)。
我们参赛选择的题号是(从A/B/C/D中选择一项填写): A我们的参赛报名号为(如果赛区设置报名号的话): 132所属学校(请填写完整的全名)大连海事大学参赛队员(打印并签名) :1.2.3.指导教师或指导教师组负责人(打印并签名):日期:年月日赛区评阅编号(由赛区组委会评阅前进行编号):2012高教社杯全国大学生数学建模竞赛编号专用页赛区评阅编号(由赛区组委会评阅前进行编号)赛区评阅记录(可供赛区评阅时使用):评阅人评分备注全国统一编号(由赛区组委会送交全国前编号):全国评阅编号(由全国组委会评阅前进行编号):葡萄酒的评价摘要:本文主要需要解决的问题是将葡萄酒从评酒师感官方面的定性评价通过一定的数据处理与数学模型的建立转化为由酿酒葡萄和葡萄酒理化指标做基础的定量的葡萄酒评价方法。
考虑到红葡萄酒和白葡萄酒之间的差异性,我们对它们分别进行讨论。
针对题目中的问题,我们通过如下的方法去解决:(1)第一问是对评酒员评分的差异性的分析与可信度的分析。
我们通过传统统计学的平均数与标准差的计算方法,计算各葡萄样品评酒员所打分数的平均值与每组评酒员之间所打分数的标准差,再进行作图比较,得出我们想要的结论。
(2)第二问是根据酿酒葡萄的理化指标对酿酒葡萄进行分级。
我们首先通过计算各理化指标的Pearson相关系数矩阵,分析各指标之间的Pearson相关系数,得到高度相关的理化指标。
再通过聚类的方法,将这些理化指标聚合成一类因子。
最后通过对各因子与葡萄酒质量的数据拟合,得出一定的函数关系式,结合前苏联对葡萄酒的评价模型与张大鹏检验模型对关系式进行检验。
(3)第三问是分析酿酒葡萄和葡萄酒理化指标之间的联系。
我们首先选取一些含量大且对葡萄酒质量有较大影响的理化指标。
对这些指标进行数据拟合与修正,得出我们想要的函数关系式。
优秀数学建模论文(全国一等奖)

承诺书我们仔细阅读了中国大学生数学建模竞赛的竞赛规则.我们完全明白,在竞赛开始后参赛队员不能以任何方式(包括电话、电子邮件、网上咨询等)与队外的任何人(包括指导教师)研究、讨论与赛题有关的问题。
我们知道,抄袭别人的成果是违反竞赛规则的, 如果引用别人的成果或其他公开的资料(包括网上查到的资料),必须按照规定的参考文献的表述方式在正文引用处和参考文献中明确列出。
我们郑重承诺,严格遵守竞赛规则,以保证竞赛的公正、公平性。
如有违反竞赛规则的行为,我们将受到严肃处理。
我们参赛选择的题号是(从A/B/C/D中选择一项填写):我们的参赛报名号为(如果赛区设置报名号的话):所属学校(请填写完整的全名):参赛队员(打印并签名) :1.2.3.指导教师或指导教师组负责人(打印并签名):日期:年月日赛区评阅编号(由赛区组委会评阅前进行编号):编号专用页赛区评阅编号(由赛区组委会评阅前进行编号):全国统一编号(由赛区组委会送交全国前编号):全国评阅编号(由全国组委会评阅前进行编号):A题:出版社的资源配置摘要本文根据题目的要求建立了合理的有限资源分配优化模型,我们借助多种数学软件的优势挖掘出大量数据潜在的信息,并将其合理运用,在此基础上,以利润最大为目标,长远发展为原则,制定出信息不足条件下的量化综合评价体系,并为出版社在2006年如何合理有效地分配有限的书号资源提供了最佳的分配方案。
在本文所建立的模型中,我们采取了层次分析法(AHP)、数据统计拟合以及整数线性规划相结合的手段,这样既借鉴了层次分析法综合评价的优势,又克服了该法中主观因素的不确定性,使模型更具有科学性,作出了出版社2006年的分配方案,如下表经过对模型的检验,单从生产计划准确度一项来看,模型所得出的结果就比以往的高,这样就首先保证了出版社获得年度稳定利润的前提,其他几个评价指标也都可以得出相似的结论。
以2006年与2005年生产计划的准确度为例,作比较:2005年的各分社平均生产计划的准确度为0.702006年的各分社平均生产计划的准确度为0.85平均准确度提高约21%从数据的对比中,我们很容易看出本模型具有较高的有效性和合理性。
2012年数学建模C题论文
承诺书我们仔细阅读了中国大学生数学建模竞赛的竞赛规则.我们完全明白,在竞赛开始后参赛队员不能以任何方式(包括电话、电子邮件、网上咨询等)与队外的任何人(包括指导教师)研究、讨论与赛题有关的问题。
我们知道,抄袭别人的成果是违反竞赛规则的, 如果引用别人的成果或其他公开的资料(包括网上查到的资料),必须按照规定的参考文献的表述方式在正文引用处和参考文献中明确列出。
我们郑重承诺,严格遵守竞赛规则,以保证竞赛的公正、公平性。
如有违反竞赛规则的行为,我们将受到严肃处理。
我们参赛选择的题号是(从A/B/C/D中选择一项填写): C我们的参赛报名号为(如果赛区设置报名号的话):所属学校(请填写完整的全名):贵州电力职业技术学院参赛队员(打印并签名) :1. 樊清松2. 温淑敏3. 陈慧婷指导教师或指导教师组负责人(打印并签名):朱卫红日期: 2012 年 09 月 09日赛区评阅编号(由赛区组委会评阅前进行编号):编号专用页赛区评阅编号(由赛区组委会评阅前进行编号):全国统一编号(由赛区组委会送交全国前编号):全国评阅编号(由全国组委会评阅前进行编号):脑卒中发病环境因素分析及干预摘要为了探索脑卒中(俗称脑中风)的发病情况、分布规律以及对高危人群提出预警和干预的建议方案,分析脑卒中高危人群发病的环境因素,通过建立数学模型,进而研究脑卒中与气温、气压、相对湿度之间的关系,降低脑卒中高危人群的发病率,并帮助健康人了解自己得脑卒中的风险程度。
通过应用回归分析法、图表分析法和统计方法把发病人群职业类型人数、各年龄段人数、2007年月份发病人数、发病性别比例人数排列在工作表的列或行中,其数据可以绘制到柱形图中。
柱形图用于显示一段时间内的数据变化或显示各项数据之间的比较情况,可以直观地看出发病人群的发病情况以及分布规律。
综上所述,男性的老年人发病率较高,是潜在的脑卒中高危人群。
从职业上来看,脑卒中高危人群为60岁以上的农民和退休人员,且发病率随年龄的增大而上升。
数学建模论文(最新9篇)
数学建模论文(最新9篇)大学数学具有高度抽象性和概括性等特点,知识本身难度大再加上学时少、内容多等教学现状常常造成学生的学习积极性不高、知识掌握不够透彻、遇到实际问题时束手无策,而数学建模思想能激发学生的学习兴趣,培养学生应用数学的意识,提高其解决实际问题的能力。
数学建模活动为学生构建了一个由数学知识通向实际问题的桥梁,是学生的数学知识和应用能力共同提高的最佳结合方式。
因此在大学数学教育中应加强数学建模教育和活动,让学生积极主动学习建模思想,认真体验和感知建模过程,以此启迪创新意识和创新思维,提高其素质和创新能力,实现向素质教育的转化和深入。
一、数学建模的含义及特点数学建模即抓住问题的本质,抽取影响研究对象的主因素,将其转化为数学问题,利用数学思维、数学逻辑进行分析,借助于数学方法及相关工具进行计算,最后将所得的答案回归实际问题,即模型的检验,这就是数学建模的全过程。
一般来说",数学建模"包含五个阶段。
1、准备阶段主要分析问题背景,已知条件,建模目的等问题。
2、假设阶段做出科学合理的假设,既能简化问题,又能抓住问题的本质。
3、建立阶段从众多影响研究对象的因素中适当地取舍,抽取主因素予以考虑,建立能刻画实际问题本质的数学模型。
4、求解阶段对已建立的数学模型,运用数学方法、数学软件及相关的工具进行求解。
5、验证阶段用实际数据检验模型,如果偏差较大,就要分析假设中一些因素的合理性,修改模型,直至吻合或接近现实。
如果建立的模型经得起实践的检验,那么此模型就是符合实际规律的,能解决实际问题或有效预测未来的,这样的建模就是成功的,得到的模型必被推广应用。
二、加强数学建模教育的作用和意义(一)加强数学建模教育有助于激发学生学习数学的兴趣,提高数学修养和素质数学修养和素质自然而然得以培养并提高。
(二)加强数学建模教育有助于提高学生的分析解决问题能力、综合应用能力因此通过数学建模活动学生的视野将会得以拓宽,应用意识、解决复杂问题的能力也会得到增强和提高。
2012年 全国数学建模大赛A题获奖论文英文版English
The Evaluation of WinesSummaryThe general way is to employ a number of qualified wine critics to taste the wi nes when needing to determine the quality of the wines. But the grapes of making wines are able to influence the quality of the wines in acertain extent.In Task 1, we firstly solve the arithmetic mean to the two groups of the same s ample wine ratings of Appendix I of the wine critic Members , then prove and verif y two groups Tasting ratings results have the existence of significant differences using SPSS software by paired T test ,finally solve the second assessment wine grou p more reliable by analysis of variance method.In Task 2, by an accurate analysis of the impact of the physical and•chemic al indicators of wine grape and the quality of wine to wine grapes ,we extract the pri ncipal component that embodies the basic characteristics of the object of study, so w e can reduce redundancy, and reduce the dimension of the physical and chemical in dicators of wine grapes, which of the various samples conduct a comprehensive e valuation and ranking grapes .Red grapes into four categories on this basis, the thr ee levels of white grape.In Task 3, we analyze the correlation degree of both using the typical correlation, it is concluded that both has the very high correlation, that is, the better the quality of wine grape, the higher the quality of the wine.In Task 4,we again use SPSS software to visually show the correlation coefficient between the three study and concluded that the impact on wine quality is more than two, there are other factors not taken into account.Through the Third Schedule aromatic substances added argumentation analysis, we have confirmed the larger factors exist .Physical and chemical indicators of wine grapes and wine can not be very accurate assessment of the quality of the wine, you can consider the introduction of a sensory analysis of taste and smell. Keywords:Paired samples T-test Principal Component Analysis Canonical- correlation analysis Path AnalysisIntroductionThe general way is to employ a number of qualified wine critics to tast the wines when needing to determine the quality of the wines. First,each tasting member in the taste of the wine samples give rates in accordance with the classification index, then sum the total scores to determine the quality of the wines. Quality of wine grape has a direct bearing with the quality of the wines. the physical and chemical indicators of wine grape and the wine can reflect the quality of the wine and grape to some extent. Following issues need to be addressed :1. Analysis in Annex 1 two groups of evaluation of wine member of the evaluation results whether there were significant differences of both, which a set of results more reliable.2. According to the physical and chemical indicators of the wine grape and wine quality, how about were these wine grape classified ?3. Analyze the link between the physical and chemical indicators of wine grapes and wine.4. Analyze the physical and chemical index of the wine grape and wine to the influence on the quality of wine, and demonstrate the ability to use the physical and chemical indicators of grape and wine to evaluate the quality of the wine.The analysis of issueBackgroundThe high-quality wines are popular in 2012. It ’s seems to be urgent to study that the main raw materials - whether the quality of the red grapes and white grapes of the wine is good or bad a decisive role. Therefore analyzed the relationship between wines ’ and grapes ’ quality and physical and chemical indicators over thirty kinds of physical and chemical indicators of grape and wine.Assumptions1 Each tasting wine samples from an approximate normal distribution of the distribution of the overall ;2 Tasting members are normal senses, there is not much difference ;3 Annex all the physical and chemical indicators can be representative of the nature of the study, omission of the object of study have a significant impact on physical and chemical indicators ;Symbolic representationα: Significant parameters ;W : Rejection region range ;m : The number of indicator variables ; 12,,...,,m x x x : Evaluation object ;i j a⋅ Standardized index value ; ,j j s μ: Sample mean and sample standard deviation of the j-th indicator ; R : Correlation coefficient matrix ; A : Standardized matrix; (1,2,,)i i m λ= Eigenvalue ;(1,2,,)i e i m = Eigenvectors ;1V Eigenvectors of the correlation coefficient matrix of red wine grapes; 1D Red wine grape correlation coefficient matrix eigenvalue;2V White wine grape correlation coefficient matrix of eigenvectors; 2D Eigenvalues of the correlation matrix of white wine grapes;12,,,p λλλ The characteristic value corresponding to the first, second ...... p maincomponen ;p The number of indicators in the wine ;q The number of indicators of the wine grape ;11R The coefficient matrix of the first set of variables ;22R The coefficient matrix of the second set of variables ;11'R 、22'R The correlation coefficient of the first set of variables and the second setof variables ;1Z Comprehensive evaluation function of the principal component of red grape wine grape ;2Z Comprehensive evaluation function of the principal components of the white grape wine grape ;,1,2,...,28j x j = Transverse section of physical and chemical indicators in accordance with Annex II to turn on behalf of the 27-level indicators of the total amino acids, proteins, VC, ......, as well as wine quality and wine quality ratings;,1,2,...,14,15;i y i = Wine quality, peel quality juice rate (%), respectively, in turn, said, stems ratio (%), one hundred quality / g, ear quality / g dry matter content g/100g solid acid than titratable acidity (g/l), PH value, soluble solids g/l, the reducing sugars g/L, total sugar g/L, and flavonols (mg/kg), resveratrol (mg/kg) and other physical and chemical indicators ;Model establishments and solutionsTask1:Analysis in Annex 1 two groups of evaluation of wine member of the evaluationresults whether there were significant differences of both, which a set of results more reliable.To review the wine member of the evaluation result, significant difference and credibility evaluation calculation methods are varied ,mainly including Sensory evaluation of significant differences, based on the evaluation of the credibility of the Analytic Hierarchy Process, discriminant analysis, T value analysis, F value analysis,etc.Firstly, in accordance with the principle of the score with the same sample that 10 Tasting 'average score obtained in Schedule I of the first and second sets each red and white wine sample tasting ratings. Are listed below:two tables of very difference.Establishments of Model 11-1 For the evaluation of red wine :First of all by the data observation, it is known that on the whole, in view of the same sample wine in the first group and the second group of score difference are more prominent,therefore the relationship between the two with a Broken line vividly expressed. From the sensory ,image display greater differences in two groups Tasting set of evaluation criteria, shown in the following figure line chart:Figure 1 the overall rating of FirstSet and SecondSet for each of the red wine samplesThen, the overall rating results of the two rating wine group in a significant level 0.05α= are made a significant difference test. Firstly, each wine sample is selected from the large number of the same kind of samples wine from testing samples ,sample population can be approximated as a normal distribution . Secondly, Of all samples tested constitute 27 paired samples tested overall. Therefore we paired samples T-test two samples. The results are as follows:Table 3 The paired samples T-test the first and second Sets(The red)Inspection objectthe difference with 95% confidence interval tNPLowerlimitCeilingFirst and Second0.41569 4.66579 2.458 26 0.021In fact, P<0.05α=and 1/2,0.975,262.458 2.0555n t t α->==, the result falls into Rejection region {}1/2W t t α-=≥.Therefore the overall evaluation criteria of the members of the twogroups of wine critic has a significant difference.Which is trustworthier : The smaller the v ariance,the trustworthier the group’s evaluate ,when we study a single kind of wine sample. In that ,we compare the variance of these two groups to define the trustworthier group which have a smaller variance .Table 4 The credibility test for red wineWine sample sFirstSet ’s Variance Second’sVarianceThetrustworthiergroupWine sample sFirstSet ’s Variance Second’sVarianceThetrustworthiergroup1 236.1 736.9 一 15 770.1 372.1 二2 358.1 146 二 16 112.9 180.9 一3 412.4 276.4 二 17 792.1 82.5 二 4 972.4 371.6 二 18 424.9 452.4 一which is the better,the ratio of the two groups for 8:19;therefore the Second is trustworthier.1 -1 For the evaluation of white wine :Firstly,in a word,only studying the same sample wine,two groups are in small diference., therefore the relationship between the two with a Broken line vividly expressed.Said out as follows:Figure 2 the overall rating of FirstSet and SecondSet for each of the white wine samples Because wo use the same way to answer about the white wines’ question , There is no longer the detailed solution process .In summary,the evaluation results of both show significant differences,and the Second is trustworthier wherever in the red wines or the white wines. At the same time ,we find a standard to measure the quality of wine—the tasing ratings of the trustworthier sommeliers. Task2: According to the physical and chemical indicators of the wine grape and wine quality, how about were these wine grape classified ?Analysis of Model 2:There are a lot of the physical and chemical indicators of wine grapes that include more than 30 level indicators and some secondary indicators in Annex 2.we hope that many high correlation variables in wine grape physicochemical indicators are converted into mutually independent or uncorrelated variables,to choose only a small amount of indicators that can reflect most of the nature of the object of study. There are so-called Principal component which can be used to explain the research object indicators.2-1 The Step of using Principal Component Analisis way:(1) Standardize raw dataThere are m indicator variables that can be used to Principal Component Analisis way,namedas 12,,...,.m x x x There are all (1n or )2n evaluation objects.In there ,128,27m n ==,and 228n =( 1n represents the red wine as a research object, 2nrepresents the white wine as aresearch object ). The value of the j th indicator of the ith evaluation object is i j a ⋅,thereforewe gain the initial matrix of the object of study:1111m n n m a a A a a ⋅⋅⋅⋅⎛⎫ ⎪= ⎪ ⎪⎝⎭ ,The value of each indicator is converted to a standardized indicator value.As follows:,1,2,...,;1,2,...,,i j i i j ja ai n j m s μ⋅⋅-=== Among :11,1,2,...,,n i i j j i a s j m n μ⋅====∑At the same time,j and j srespectively is the sample’s mean and standard deviation Correspondingly ,1,2,...,j j j jx xj m s μ-==It ’s a standardized indicator variable.(2)Calculting the Correlation coefficient matrix R: the Correlation coefficient matrix()i j m n R r ⋅⨯=11122122212m m m m m m m r r r r r r R r r r ⋅⋅⋅⋅⋅⋅⋅⋅⋅⎡⎤⎢⎥⎢⎥=⎢⎥⎢⎥⎣⎦ TR A A =*,among : A represents A’s standardized matrix .By nature that R is a realsymmetric matrix (j i i j r r ⋅⋅=r ij =r ji ),therefore we only need to calculate on the upper triangle element or lower triangular elements to seek R . The Correlation coefficient matrix of the red wine grapes is R1,and the Correlation coefficient matrix of the white is R2. Specific data, see Annex 1.0 and Annex 3.0.(3)Calculating eigenvalues and eigenvectorsFirstly , we have solved the characteristic equation 0=-R I λ. We usually obtain eigenvalues (1,2,,)i i m λ= by Jacobi method , then arrange its in order of size 12,0m λλλ≥≥≥≥Secondly ,we respectively obtain the eigenvector (1,2,,)i e i m = corresponding to theeigenvalue i λ. Here is a requirement ,means i e =1,211mijj e ==∑,of which ij e represents the j-th component of the vector i e .The eigenvector V1 and eigenvalue D1 of the red wine grapes’ Correlation coefficient matrix , see Annex 2.0.The Characteristic roots of red wine grapes D1 Sequence :-0.0000 0.0000 0.0016 0.0058 0.0112 0.0156 0.0299 0.0504 0.0652 0.0826 0.1764 0.2025 0.2275 0.2350 0.3019 0.3712 0.5499 0.6844 0.7307 0.8076 0.9969 1.2228 1.5217 1.9934 2.8682 3.2615 4.7702 6.8158The eigenvector V2 and eigenvalue D2 of the white wine grapes’ Correlation coefficient matrix , see Annex 4.0.The Characteristic roots of white wine grapes D2 Sequence :-0.0000 0.0008 0.0026 0.0060 0.0250 0.0441 0.0634 0.0790 0.0953 0.1352 0.2719 0.3142 0.3156 0.3798 0.4458 0.6326 0.7267 0.8919 0.9663 1.0753 1.2937 1.4996 1.6175 1.7869 2.0894 2.9810 4.6623 5.5981(4)Calculation of the contribution rate and cumulative contribution rate of the main componentsThe contribution rate of main component i z :1(1,2,,)imkk i m λλ==∑The cumulative contribution rate :11(1,2,,)ikk mkk i m λλ===∑∑We generally take the characteristic values of 85-95% of the cumulatiive contribution rate corresponding to 1-st,2-nd,…,p-th(p≤m) main cpmponent.2-2 The results of principal component analysis :The eigenvalues 123,,,.....p λλλλwhose accumulative contribution rate of 85-95% can be generally selected as principal component parameters . According to theconclusion of the Principal Component Analysis , whenever in red wine or the white wine, the quality of wine is regarded as the first principal component. This shows that the quality of the evaluation of the grade of wine grapes wine share an important role .In addition ,we also gain:1. In the system which the red wine grapes act as study ,the effect of the principal component analysis of the first eleven characteristic roots whose cumulative contribution rate achieves 90% above is very great . Therefore we choose the first fourteen principal components []121314,,...,,y y y yto run a comprehensive evaluation. The contributions of fourteen principal component variables are the weight tobuild principal component comprehensive evaluation model of the red wine grapes , namly:345678910111213112140.116482559y +0.10243608y 0.0711931110.054346623+0.043671585y +0.035603699y +0.02884296y +0.026096522y +0.024442944y +0.019639356y +0.0.243422980.17036401325719y 894y 0.010782181y Z y y y ++++=+Therefore, we put all the objects corresponding to factors of the various principal components into the model ,to gain the comprehensive evaluation and sort results of the red wine grapes.2-3 ConclutionFor the red wine grapes , there are quite difference to various samples of grapes , therefore the red wine grape samples are divided into four grades: "Premium", "Great", "Qualified" and "Bad" .No. 26 sample is classified as "Premium" level by visible quality and particularly high comprehensive evaluation ;No. 17,24,5, and 20 are classified as "Great" level by great quality and high comprehensive evaluation ;No. 23,25,10,12,18,27,6,8,14,9,19,and sample is classified as "Qualified" level ;And , No. 15,3,13,4,21,7,11,2,22,and 16 sample are only classified as "Bad" , because their evaluateons are less than 60.For the white wine grapes,…Task3:Analyze the link between the physical and chemical indicators of wine grapes and wine.3-1 Model preparation :Introduced the idea of canonical correlation analysis In task 3 , we study the correlation relationship between 27 physical and chemical indicators of wine grapes ,10 of the red wines and 9 of the white wines ; the method which is similar to the main component is used, to respectively find the linear combination of the two sets of variables.Can make the number of variables to simplify, and can achieve the purpose of analysis correlation.3-2 Modeling steps :一、According to the purpose of the analysis to establish the original matrixAmong: p is the number of indicators in the wines, q is the wine grape number of indicators11111111p q n np n nq x x y y x x y y ⎡⎤⎢⎥⎢⎥⎢⎥⎣⎦;二、Standardization of the original data , and calculating a correlation coefficient matrix11212122R R R R R ⎡⎤=⎢⎥⎣⎦Among: 11R ,22R respectively is the correlation coefficient matrix of the first set ofvariables and a second set of variables .三、Seeking canonical correlation coefficient and canonical variablesCalculate the eigenvalues and eigenvectors of the matrix A and B ,to gain the canonical correlation coefficient and canonical variables.Among:1111122221A R R R R --= ,1122211112B R R R R --=.四、Making canonical aorrelation analysis by using SPSS,to analysis of the link between the physical and chemical indicators of the wine grape and wine.The first step, the original data entry wine grapes and wines .As follows : X1,X2, X3 ,X4 ,X5 respectively represents Anthocyanin ,Tannin, Total phenolic , Wine total flavonoids , DPPH half inhibition volume ; Y1 ,Y2 ,Y3 …Y16 respectively represents the original data of the wine grapes of Annex II (Vertical indicators from the total amino acids ). Due to the limited space here is only part of the data is given. Detailed data see Annex Table 5.0(redpu.xls).Run in SPSS results are as follows:between the various indicators are small.If the correlation coefficient of the two indicators, two indicators may reflect the same ,and you can consider the merger.Analyze the physical and chemical index of the wine grape and wine to the influence on the quality of wine, and demonstrate the ability to use the physical and chemical indicators of grape and wine to evaluate the quality of the wine.4-1 The idea of Model 4:In order to analysis of wine grape and wine physical and chemical index to the influence on the quality of wine , we introduce linear regression theory to realize size analysis method . Using the Path Analysis on the basis of multiple regression , correlation coefficient iy r is decomposed into the direct path coefficients and indirect path coefficients .Path Analysis of the theory has been proved that any simple Correlation coefficient (iy r)between an independent variable i x and dependent variable y= Direct path (iy P)coefficient between x and y+ Indirect path coefficients of all the i x and y;Indirect path coefficients ibetween an independent variable any i x and dependent variable any y=Correlation coefficient (iy r)×Path coefficients (jy p) .Making Path Analysis process, it is generally believed that the most difficult part to calculate is the path coefficients. In fact , the path coefficients that we need to can be obtained by liner regression calculation . Then Indirect path coefficients can be multiplied by the correlation coefficient .4-2Problem-solving steps :4.2-1Data entryStart SPSS program, data input SPSS,name of each variable, andset the variable label.Wine quality is acted as the dependent variable y, and the physical and chemical indicators of the wine grape and wine including Anthocyanins, Tannins, Total Phenols, Wine Total Flavonoids, Resveratrol,Trans polydatin,Cis polydatin,Trans-resveratrol,Cis-resveratrol,DPPH half inhibition volume,and Color were the independent variables x1, x2, x3,x4,x5,x6,x7,x8,x9,x10.4.2-2Normality test on the dependent variable yFigure 3y s Standard Q-Q diagramStrengths and Weaknesses1.The strengths of model(1) The model established by the questions one to four are in strict theory based on analysis derived,comparing theoretical calculations with actual background, we have amended ,therefore it makes model more reasonable.(2) The use of paired samples T-test makes the results more reliable . This paper originality is very strong,because of the most of the models in the article derived and established strictly.(3) All calculations are used to specialized mathematical software and processing large amounts of data, such conclusions credibility is higher.We quantitative analysis many influencing factors that model involves, to make the paper more persuasive.2.The weaknesses of modelIn questionI and II ,due to the choice of the numerical inevitably produce a slight error and the complexity of factors affect ,so the calculation results inevitably produce certain error. References[1] Dongyan Chen , Dongmei Li , Shuzhong Wang , Mathematical Model [M].Beijing:Science Press,2007[2] Fengqiu Liu , Shanqiang Li , Zuobao Cao, Mathematical experiment [M].Harbin: HarbinInstitute of Technology Press,2010[3] Shisong Mao,Yiming Cheng,Xiaolong Pu, Probability theory and mathematical statisticstutorial [M].Beijing: Higher Education Press,2004[4] Shoukui Si,Xi Sun, Algorithm and application of mathematical modeling [M].Beijing:National Defence Industry Press,2011[5] Zhixing Zhang, Design and Application of the MATLAB program [M].Beijing: TsinghuaUniversity Press,2002。
2012高教社杯全国大学生数学建模竞赛a
承诺书我们仔细阅读了中国大学生数学建模竞赛的竞赛规则.我们完全明白,在竞赛开始后参赛队员不能以任何方式(包括电话、电子邮件、网上咨询等)与队外的任何人(包括指导教师)研究、讨论与赛题有关的问题。
我们知道,抄袭别人的成果是违反竞赛规则的, 如果引用别人的成果或其他公开的资料(包括网上查到的资料),必须按照规定的参考文献的表述方式在正文引用处和参考文献中明确列出。
我们郑重承诺,严格遵守竞赛规则,以保证竞赛的公正、公平性。
如有违反竞赛规则的行为,我们将受到严肃处理。
我们授权全国大学生数学建模竞赛组委会,可将我们的论文以任何形式进行公开展示(包括进行网上公示,在书籍、期刊和其他媒体进行正式或非正式发表等)。
我们参赛选择的题号是(从A/B/C/D中选择一项填写): A 我们的参赛报名号为(如果赛区设置报名号的话):所属学校(请填写完整的全名):哈尔滨商业大学参赛队员(打印并签名) :1.王羽2. 刘恺利3.王俊杰指导教师或指导教师组负责人(打印并签名):日期: 2012 年 9 月 10 日赛区评阅编号(由赛区组委会评阅前进行编号):编号专用页赛区评阅编号(由赛区组委会评阅前进行编号):赛区评阅记录(可供赛区评阅时使用):评阅人评分备注全国统一编号(由赛区组委会送交全国前编号):全国评阅编号(由全国组委会评阅前进行编号):葡萄酒的评价摘要随着生活水平的提高,葡萄酒已经走进了千家万户,葡萄酒的优劣已成为一个热点问题。
本文通过对已给附件1-2的葡萄酒品尝评分,葡萄和葡萄酒的理化指标,在基于一些合理简化假设的基础上,建立模型计算分析,并充分利用Excel、Spss软件简化计算,对相关问题进行了有针对性的解。
进而对酿酒葡萄,葡萄酒的质理化指标和葡萄酒的质量相关问题求解。
针对问题一,首先,我们对所给数据进行深入分析,借助Excel做出了两组评酒员对红葡萄酒和白葡萄酒评分的平均值,进而利用Spss分别对红葡萄酒和白葡萄酒的评分进行独立T检验,得出红葡萄酒两组的评分没有显著性差异,白葡萄酒两组的评价有显著差异,并且第二组更可信。
2012年国赛A葡萄酒获奖论文带附录(完整版)
2012年国赛A葡萄酒获奖论文带附录(完整版)2012高教社杯全国大学生数学建模竞赛编号专用页赛区评阅编号(由赛区组委会评阅前进行编号):赛区评阅记录(可供赛区评阅时使用):评阅人评分备注全国统一编号(由赛区组委会送交全国前编号):全国评阅编号(由全国组委会评阅前进行编号):A 题葡萄酒的评价摘要:确定葡萄酒质量时一般是通过聘请一批有资质的评酒员进行品评。
一方面由于每个品酒员间存在评价尺度、评价位置和评价方向等方面的差异,导致不同品酒员对同一酒样的评价存在差异,从而不能真实地反映不同酒样间的差异。
另一方面葡萄酒的质量和酿酒葡萄的好坏又有直接的关系,于是根据题中所给的条件和问题提出相关的约束条件和目标函数,建立合理的数学模型。
对于问题一,在分析附件1中所给的数据后,首先根据每组的10名评酒员对其中的一种酒进行品尝后确定葡萄的质量,然后在进行分析评酒员评27种红葡萄酒的差异,最后运用方差分析对两组评酒员的评价结果进行测定,得出两组评酒员存在是否有显著性差异的结果,看其哪组评酒员的技术水平更高些。
问题二是为了对酿酒葡萄进行分级,要从酿酒葡萄的理化指标和葡萄酒的质量进行分级,在附件2、3中,发现酿酒葡萄的成分数据中有很多因素,首先对酿酒葡萄的理化指标经过查找资料、专家咨询进行了较为有效的分类,我们从中选取一些有效因素,例如:氨基酸总量、糖、单宁、色差值、酸、芳香物质等。
然后再采取系统聚类分析法对酿酒葡萄进行分级。
等级大致分为优、良、中、差四个级别。
在解决问题三时,不仅要考虑酿酒葡萄还要考虑葡萄酒的理化指标,因而采用多元回归模型,模型如下:其中,b0为常数项,为回归系数,错误!未找到引用源。
是随机误差。
2012高教社杯全国大学生数学建模竞赛B题论文
承诺书我们仔细阅读了中国大学生数学建模竞赛的竞赛规则.我们完全明白,在竞赛开始后参赛队员不能以任何方式(包括电话、电子邮件、网上咨询等)与队外的任何人(包括指导教师)研究、讨论与赛题有关的问题。
我们知道,抄袭别人的成果是违反竞赛规则的, 如果引用别人的成果或其他公开的资料(包括网上查到的资料),必须按照规定的参考文献的表述方式在正文引用处和参考文献中明确列出。
我们郑重承诺,严格遵守竞赛规则,以保证竞赛的公正、公平性。
如有违反竞赛规则的行为,我们将受到严肃处理。
我们授权全国大学生数学建模竞赛组委会,可将我们的论文以任何形式进行公开展示(包括进行网上公示,在书籍、期刊和其他媒体进行正式或非正式发表等)。
我们参赛选择的题号是(从A/B/C/D中选择一项填写):B我们的参赛报名号为(如果赛区设置报名号的话):所属学校(请填写完整的全名):参赛队员(打印并签名) :1.2.3.指导教师或指导教师组负责人(打印并签名):日期:年月日编号专用页赛区评阅编号(由赛区组委会评阅前进行编号):赛区评阅记录(可供赛区评阅时使用):评阅人评分备注全国统一编号(由赛区组委会送交全国前编号):全国评阅编号(由全国组委会评阅前进行编号):太阳能小屋的最优化模型摘要本文中我们运用了一种“递进式铺设”方案。
将问题进行拆解,把问题转化为五个独立的步骤来解决,在太阳能电池组件铺设过程中,优先选择单位面积经济效益最高的光伏电池组件来进行铺设,进行两次铺设后得到一个较为优化的解。
在此方案的基础上,我们对太阳能小屋铺设问题进行了深入研究。
在问题一中,我们通过题目所给的数据对东南西北立面效益最大化的铺设方案进行计算,通过所得结果是否可以盈利来决定是否进行铺设。
先利用Excel 软件对附件3所给数据根据各光伏电池组件的阈值进行处理,从而得到每种电池一年中的经济效益。
在每个面的铺设方案计算中,均是通过先行铺设单位效益最大的光伏电池组件,对无法铺设到的部分选择单位效益次之的小型光伏电池组件进行铺设,直到无法再进行铺设为止。
- 1、下载文档前请自行甄别文档内容的完整性,平台不提供额外的编辑、内容补充、找答案等附加服务。
- 2、"仅部分预览"的文档,不可在线预览部分如存在完整性等问题,可反馈申请退款(可完整预览的文档不适用该条件!)。
- 3、如文档侵犯您的权益,请联系客服反馈,我们会尽快为您处理(人工客服工作时间:9:00-18:30)。
承诺书我们仔细阅读了中国大学生数学建模竞赛的竞赛规则.我们完全明白,在竞赛开始后参赛队员不能以任何方式(包括电话、电子邮件、网上咨询等)与队外的任何人(包括指导教师)研究、讨论与赛题有关的问题。
我们知道,抄袭别人的成果是违反竞赛规则的, 如果引用别人的成果或其他公开的资料(包括网上查到的资料),必须按照规定的参考文献的表述方式在正文引用处和参考文献中明确列出。
我们郑重承诺,严格遵守竞赛规则,以保证竞赛的公正、公平性。
如有违反竞赛规则的行为,我们将受到严肃处理。
我们参赛选择的题号是(从A/B/C/D中选择一项填写): C我们的参赛报名号为(如果赛区设置报名号的话):所属学校(请填写完整的全名):参赛队员(打印并签名) :1.2.3.指导教师或指导教师组负责人(打印并签名):日期: 2012 年 9 月 10 日赛区评阅编号(由赛区组委会评阅前进行编号):编号专用页赛区评阅编号(由赛区组委会评阅前进行编号):全国统一编号(由赛区组委会送交全国前编号):全国评阅编号(由全国组委会评阅前进行编号):脑卒中发病环境因素分析及干预模型摘要脑卒中是一种全国乃至全世界目前威胁人类生命危险的严重疾病。
这种疾病的诱发与环境、气温、湿度等因素有着密切的关系,同时,它的发生又是一个漫长而缓慢的过程,一旦患病将难以逆转。
本文针对脑卒中发病率与气温、气压以及相对湿度的关系建立数学模型,并结合高危人群的特征和关键指标,研究脑卒中发病的规律,对卫生部门和医疗机构各方面的改善和改革都具有实际意义。
问题一,根据病人的基本信息,对其性别、年龄段、职业等3方面进行分类统计,利用赋值、作图等形式得出结论:1、脑卒中男性患者多于女性患者;2、中老年人在发病人群中发病率最大,高达98%;3、在各职业发病人群中农民的发病率最大(占68%),其次为退休人员(16%)和工人(11%)。
问题二,先对病例和气象因素数据进行分析、处理,运用图表的形式展现2007至2010年各月病例数和气象因素的变化规律,再利用圆形统计分析法通过三角函数变换计算出脑卒中的高峰期为2月13日至7月25日。
进而采用多元线性回归分析,建立模型:⎪⎪⎪⎪⎪⎭⎫⎝⎛+⎪⎪⎪⎪⎪⎭⎫⎝⎛⎪⎪⎪⎪⎪⎭⎫⎝⎛=⎪⎪⎪⎪⎪⎭⎫ ⎝⎛4821481051613.3829.1023239.1020169643.785.1023714.1020116129.51339.1030226.102811044732945v v vβββ 运用最小二乘法计算得多元线性回归方程ν+++=876543219.4529X - X 26.7801- 204.4750X 41.1780X - X 145.2858- 30.0397X - 88.2352X -54.3168X ˆY并对其作随机误差项方差的估计得出回归方程的标准误差4675.380=σ较大,进而采用8项气象指标分别与同期脑卒中的月发病例数进行单因素相关性分析,再应用后退法多元逐步回归分析多种气象因素共同作用与脑卒中的相关性,得出脑卒中与最高气压、平均气压、最高温度、平均相对湿度相关性较大。
问题三,通过网上查阅相关资料及有关文献,运用SPSS19.0软件对其数据进行处论,从脑卒中的可干预因素及不可干预因素中对脑卒中高危人群提出了相应的预防措施和建议方案。
本文采用分类统计法和回归分析法,作出脑卒中与气温、气压、相对湿度的相关性分析,运用SPSS , Matlab ,Excel 等软件进行计算、作图,得出结果准确,制图精准。
【关键词】 脑卒中 圆形分步法 线性回归 SPSS 软件一、问题重述脑卒中(俗称脑中风)是目前威胁人类生命的严重疾病之一,它的发生是一个漫长的过程,一旦得病就很难逆转。
这种疾病的诱发已经被证实与环境因素,包括气温和湿度之间存在密切的关系。
为了对脑卒中疾病的风险作出评估及对高危人群能够及时采取干预措施,需要对脑卒中的发病环境因素进行分析研究。
请根据来源于中国某城市各家医院2007年1月至2010年12月的脑卒中发病病例信息数据(见Appendix-C1)以及相应期间当地的逐日气象资料(Appendix-C2),回答下面的问题:问题一:根据病人基本信息,对发病人群进行统计描述。
问题二:通过建立数学模型研究脑卒中发病率与气温、气压、相对湿度间的关系。
问题三:查阅和搜集文献中有关脑卒中高危人群的重要特征和关键指标,结合问题1、2中所得结论,对高危人群提出预警和干预的建议方案。
二、问题分析问题一:要求根据病人基本信息,对发病人群进行统计描述,根据Appendix-C1的四个表格的数据,发病人数与性别、年龄、职业有关。
1、对性别数据进行处理,同时给男女性别分别赋值(1:男;2:女),得到赋值总和为74643,总人数为61926.于是得到了男女性别赋值总和与总人数的比值p =6192674643。
当5.11<<p 时,则表明男性的患病人数多;当25.1<<p 时,则为女性的患病人数多。
从而得出2007年到2010年四年期间在发病人群中总的男女性别的平均指数为5.10205358.11<≈<p ,即男性患脑中风的比例比女性高。
2、对各表中的年龄进行分析,将所有的病人按不同的年龄段分为童年、少年、青年、中年、老年这五类病。
用Excel 软件进行分段处理,作出饼图,得出从2007年到2010年各年龄段的病人数所占比例。
3、对表中的各职业的发病人数进行分析,用Excel 软件处理,将各职业的病人数区分开,作出饼图,从而得出2007年到2010年各个职业的病人数所占比例。
问题二:为了观察发病的集中时间及流行的高峰期,先计算出各月的月中点,以元旦零时为零角度,则1月份有31天,月中点距零为15.5天,2月份有28天,月中点距零为31+14=45天,依次类推。
再将时间天数换算成角度,全年365天,相当于圆周360º,则一天相当于360/365=0.9863°,1月份月中点为15.5天,则月中位角为0.9863×15.5=15.29°。
再运用三角函数代换原理,令α表示平均角,通过⎪⎪⎩⎪⎪⎨⎧+===∑∑∑∑22/sin /cos y x r f f y ff x αα和⎪⎪⎪⎩⎪⎪⎪⎨⎧==<=>=<+>=0,00,02700,0900)/(1800)/(y x y x y x x x y arctg x x y arctg 且当不定且当且当当当α 。
计算出α,同时计算出角的标准差s ,接着通过s +α以及对角度的转换最终确定出脑卒中发病的高峰点与高峰期。
之后再对2007年至2010年这四年期间的气温、气压与相对湿度的相关数据进行了分析,用Excel 软件计算出四年内的月平均气温、月平均气压以及月平均相对湿度值,从而可分别建立四年间月平均气温、气压与相对湿度的变化规律图。
为了更好的建立模型,我们接着再继续考虑2007—2010年这四年中的八项气象指标(平均气压、最高气压、最低气压、平均温度、最高温度、最低温度、平均相对湿度、最小湿度)分别与脑卒中的月发病人人数的相关系。
即通过对脑卒中的月发病人人数与八项指标数据的处理,用SPSS 软件计算出脑卒中的8项气象指标分别与同期脑卒中的月发病例数进行单因素相关性分析,再应用后退法多元逐步回归分析多种气象因素共同作用与脑卒中的相关性。
问题三:为了了解脑卒中高危人群的重要特征和关键指标,以及能够很好的为高危人群提出干预和建议方案,我们通过网上查阅和搜索文献,对北京市2009年度18-79岁的946位存在有高血压病、心脏病、糖尿病和卒中家族史、肥胖、吸烟史、饮酒史这几项现象的郊区居民人数据进行了分析,运用SPSS19.0软件计算出了它们对脑卒中的爆发率,得出脑卒中的危险因素,并对其进行分析和给予干预的措施。
三、符号说明四、模型假设1、假设附件中的部分缺失数据对计算结果影响不大。
2、假设所给的数据具有一定代表性。
3、假设只考虑题中所给的环境因素(气温、气压、相对湿度),其它因素忽略考虑。
五、模型的建立与求解5.1发病人群的统计描述1.根据中国某城市各家医院2007年1月至2010年12月的脑中风发病病例信息数据,当从性别的因素考虑时,我们给发病人数中的男女性别分别赋值(1:男;2:女)后,对所有进行数据分析,将所有的赋值通过Excel软件进行求和,得到了总的男女赋由表1我们可以看出205361<≈<p,那么由此可见2007年到2010.1.1=p是属5.120536年四年期间在发病人群中男性患脑卒中的比例比女性高。
2.考虑各年龄的发病人数时,我们对年龄进行分段处理并统计出每个年龄段的人数从表2中得出的比例来看,中老年人更容易患脑卒中疾病。
在Excel中建立出该百分比的模型分布图如下图1:图1 2007年至2010年各年龄段患病人数所占比例同样地,我们对已知的各职业发病人数用Excel软件进行了分析处理,如下表3:Array由表3中各职业所占的比例表明,在脑卒中发病人群中,身体机能较差的人也易患高血压病,所以更可能引起脑卒中。
从而建立各职业病人数所占比例的分布图,如下:图2 2007年至2010年各职业患病人数所占比例综合上述数据结论,我们知道了年龄和性别以及职业对脑中风病人的重要影响。
年龄是脑卒中发病的重要因素,脑卒中发病率随年龄的增大而增高。
40岁以上随着年龄的增加中风发病率亦有增加,但通过数据我们又发现青中年中风发病者亦有增加,不可忽视。
一般来说女性中风发病率低于男性。
而对于职业,农民是一种劳力型的职业,这类病人的身体机能易变差,随着自身身心体质的逐渐虚弱患病人数日渐增多,同时,农民的就医意识差,农村地区医疗水平落后等客观因素使得患病后的病人存活期相对缩短。
5.2脑卒中发病率与气温、气压、相对湿度间的关系5.2.1病例数据处理分析由于Appendix-C1中四个表格的数据比较繁杂,我们将其病例数按月份来处理,统计出2007至2010年每个月的病例数(参见附件4),作出柱形图,如下:图3 2007年至2010年各月病例数由图3可看出:脑卒中在一年的不同时期里的病例数量有所变化,即脑卒中的发病率具有季节性变化。
5.2.2 气温、气压和相对湿度的变化规律我们对从2007年至2010年这四年期间的气温、气压与相对湿度的相关数据进行了定量分析,用Excel软件计算出了四年内的月平均气温、月平均气压以及月平均相对湿度。
1.建立四年间的月平均温度变化规律图:图4 2007—2010年月平均温度变化规律图由图4可知道四年间每个年在7-8月份的平均气温最高,1月份气温最低,并且可观察知道每年的9-11月份的温差变化最大。