比较芯片系统的通量(HiScan和iScan)
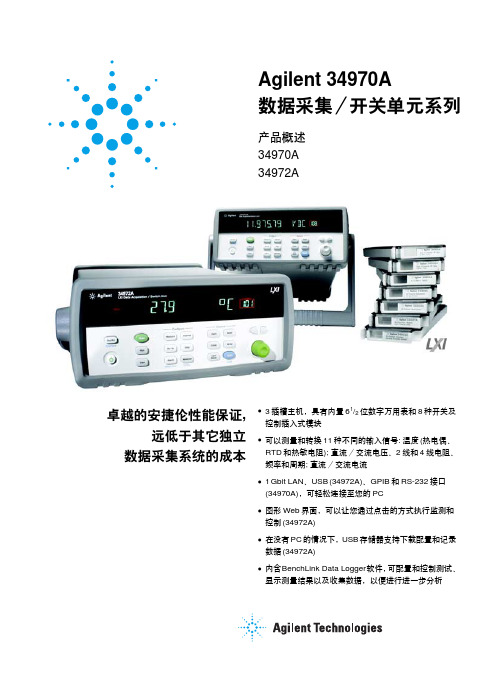
安捷伦34970中文说明书
计算机组成原理期末复习资料

计算机组成原理一、缩写词解释CPU:中央处理器ALU:算术逻辑单元I/O:输入输出接口RAM:随机存储器SRAM:静态随机访问存储器DRAM:动态随机访问存储器ROM:只读存储器PROM:用户可编程的只读存储器EPROM:紫外线可擦除可编程只读存储器FLASH:闪速存储器EEPROM:用电可擦除可编程只读存储器ISA:工业标准总线EISA:扩展工业标准总线PCI:外围部件互连总线USB:通用串行总线RS—232C:串行通信总线Cache:高速缓存FIFO:先进先出算法LRU:近期最少使用算法CRC:循环冗余校验码A/D:模拟/数字转换器D/A:数字/模拟转换器DMA:直接存储器存取方式DMAC:直接内存访问控制器LED:发光二极管FA:全加器OP:操作码CISC:复杂指令系位计算机RISC:精简指令系位计算机VLSI:超大规模集成电路LSI:大规模集成电路MAR:存储器地址寄存器MDR:存储器数据寄存器CU:控制单元CM:控制存储器二、选择题(自己看书吧··)三、名词解释1.计算机系统:由硬件和软件两大部分组成,有多种层次结构。
2.主机:CPU、存储器和输入输出接口合起来构成计算机的主机。
3.主存:用于存放正在访问的信息4.辅存:用于存放暂时不用的信息。
5.高速缓存:用于存放正在访问信息的付本。
6.中央处理器:是计算机的核心部件,由运算器和控制器构成。
7.硬件:是指计算机实体部分,它由看得见摸得着的各种电子元器件,各类光、电、机设备的实物组成。
软件:指看不见摸不着,由人们事先编制的具有各类特殊功能的程序组成。
8.系统软件:又称系统程序,主要用来管理整个计算机系统,监视服务,使系统资源得到合理调度,高效运行。
应用软件:又称应用程序,它是用户根据任务需要所编制的各种程序。
9.源程序:通常由用户用各种编程语言编写的程序。
目的程序:由计算机将其翻译机器能识别的机器语言程序。
10.总线:是连接多个部件的信息传输线,是各部件共享的传输介质。
半导体工艺英语名词解释

半导体工艺英语名词解释CMPCMP 是哪三个英文单词的缩写?答: Chemical Mechanical Polishing (化学机械研磨)CMP是哪家公司发明的?答: CMP是IBM在八十年代发明的。
简述CMP的工作原理?答: 化学机械研磨是把芯片放在旋转的研磨垫(pad)上, 再加一定的压力, 用化学研磨液(slurry)来研磨的。
为什幺要实现芯片的平坦化?答: 当今电子元器件的集成度越来越高, 例如奔腾IV就集成了四千多万个晶体管, 要使这些晶体管可以正常工作, 就需要对每一个晶体管加一定的电压或电流, 这就需要引线来将如此多的晶体管连接起来, 但是将这幺多的晶体管连接起来, 平面布线是不也许的, 只可以立体布线或者多层布线。
在制造这些连线的过程中, 层与层之间会变得不平以至不能多层迭加。
用CMP来实现平坦化, 使多层布线成为了也许。
CMP在什幺线宽下使用?答: CMP在0.25微米以下的制程要用到。
什幺是研磨速率(removal rate)?答: 研磨速率是指单位时间内研磨膜厚度的变化。
研磨液(slurry)的组成是什幺?答: 研磨液是由研磨颗粒(abrasive particles), 以及能对被研磨膜起化学反映的化学溶液组成。
为什幺研磨垫(Pad)上有一些沟槽(groove)?答: 研磨垫上的沟槽是用来使研磨液在研磨垫上达成均匀分布, 使得研磨后芯片上的膜厚达成均匀。
为什幺要对研磨垫进行功能恢复(conditioning)?答: 研磨垫在研磨一段时间后, 就有一些研磨颗粒和研磨下来的膜的残留物留在研磨垫上和沟道内,这些都会影响研磨液在研磨垫的分布,从而影响研磨的均匀性。
什幺是blanket wafer ?什幺是pattern wafer ?答: blanket wafer 是指无图形的芯片。
pattern wafer 是指有图形的芯片。
Blanket wafer 与pattern wafer的removal rate会同样吗?答: 一般来说, blanket wafer 与pattern wafer的removal rate是不同样的。
内存颗粒和模组编号知识

内存颗粒和模组编号知识老头儿的内存颗粒和模组编号知识60问( ,李谦2009-04-24发表)在内存的颗粒和模组的编号中浓缩着内存的主要技术信息,但是,除了JEDEC对模组的标注方法有一个原则规定外,颗粒和模组的编号规则都是由各个生产厂自行设定的,编号方法很不一致。
因此,网上有关编号的问题的讨论也很多,我认为,有许多理解是不准确的。
为此,我花了一些时间到境外生产厂的英文官方网站去寻求答案。
力求收集得全面一些。
还真的有不少斩获。
现将它们整理出来,供网友们参考。
当然,所涉及的内存种类主要是个人电脑用户接触到的UDIMM (Unbuffered non-ECC DIMM也称UBDIMM)内存和SO-DIMM(Small Outline DIMM )内存。
服务器内存和其他专用内存都没有涉及。
为了便于读者朋友查询,我编了一个内存颗粒编号速查表和内存模组编号速查表(见问题3问题4)。
当您要查询一个未知内存编号的含义时,可以首先跟这个速查表比对,了解了生产这种内存的厂商后,再根据本目录查询具体含义。
目录一.关于内存的编号1.目前的主要内存厂商有哪些?2.内存是怎样编号的?3.请给出常用内存颗粒编号速查表!4.请给出常用内存模组编号速查表!二.关于内存的编号方法5.颗粒编号中的术语有哪些?说明其含义。
6.当表示颗粒结构时用“128M×8”是什么意思?7.怎样根据颗粒编号求出BANK深度?8.怎样根据颗粒编号求出颗粒深度?9.如何根据颗粒的编号计算模组容量?10.怎样从内存编号中知道内存的速度?11.内存模组编号的术语有那些?说明其含义。
12.当表示模组结构时用256M×64是什么意思?13.什么是RANK?14.如何根据模组的编号计算模组的容量?15.如何根据模组和颗粒的编号推算模组的颗粒数?16.JEDEC对内存编号内容是如何规定的?17.请解释JEDEC标准中有关内存名词及其含义18.如何根据模组的编号计算模组的RANK数?19.模组的RANK数跟模组的面数有什么关系?20.内存标签上的2R×8就表明内存是双面8个颗粒吗?21.内存标签上的Warranty V oid是什么意思?22.内存标签上的UNB和SOD是什么意思?23.在内存标签上写的RoHS是什么意思?24.有害物质是指哪些?25.内存标签上的“0820”是什么意思?26.内存标签上的P/N和S/N是什么意思?27.我的内存是2GB的,为什么颗粒编号说是1GB的?三.几个主要内存厂商编号方法介绍28.三星内存的颗粒是怎样编号的?29.三星内存的模组是怎样编号的?30.海力士内存以“HY5”为前缀的颗粒是怎样编号的?31.海力士内存以“H5”为前缀的颗粒是怎样编号的?32.海力士SDRAM内存模组是怎样编号的?33.海力士DDR内存模组是怎样编号的?34.海力士DDR2内存模组是怎样编号的?35.海力士DDR3内存模组是怎样编号的?36.现代的乐金内存是怎样编号的?37.美光内存的颗粒是怎样编号的?38.美光内存的模组是怎样编号的?39.日立、日电和东芝旧内存颗粒是怎样编号的?40.尔必达内存的颗粒是怎样编号的?41.尔必达内存的模组是怎样编号的?42.英飞凌和奇梦达内存的颗粒是怎样编号的?43.英飞凌和奇梦达内存的模组是怎样编号的?44.南亚内存的颗粒是怎样编号的?45.南亚内存的模组是怎样编号的?46.易胜的颗粒是怎样编号的?47.易胜的模组是怎样编号的?48.力晶的内存是怎样编号的?49.茂矽和茂德的颗粒是如何编号的?50.茂矽和茂德的模组是如何编号的?51.金士顿Avardram内存是如何编号的?52.金士顿HyperX内存是如何编号的?53.世迈内存的模组是如何编号的?54.海盗船内存是怎样编号的?55.瑞士军刀内存模组是怎样编号的?56.胜创的内存是怎样编号的?57.威刚内存模组是怎样编号的?58.宇瞻内存模组是怎样编号的?59.金邦内存模组是怎样编号的?60.超胜内存是怎样编号的?一.关于内存的编号1.目前的主要内存厂商有哪些?答:内存生产厂商很多,颗粒的生产厂商主要是韩国的三星、海力士;日本的尔必达;美国的美光;德国的奇梦达和我国台湾的南亚、力晶和茂德等。
半导体FAB知识100问

半导体FAB知识100问影响工厂成本的主要因素有哪些?答:Direct Material 直接材料,例如:蕊片 Indirect Material间接材料,例如气体… Labor人力 Fixed Manufacturing机器折旧,维修,研究费用……等 ProducTIon Support其它相关单位所花费的费用在FAB内,间接物料指哪些?答:Gas 气体 Chemical 酸,碱化学液 PHOTO Chemical 光阻,显影液 Slurry 研磨液 Target 靶材 Quartz 石英材料 Pad & Disk 研磨垫 Container 晶舟盒(用来放蕊片) Control Wafer 控片 Test Wafe r测试,实验用的蕊片什幺是变动成本(Variable Cost)?答:成本随生产量之增减而增减.例如:直接材料,间接材料什幺是固定成本(Fixed Cost)?答:此种成本与产量无关,而与每一期间保持一固定数额.例如:设备租金,房屋折旧及檵器折旧Yield(良率)会影响成本吗?如何影响?答:Fab yield=若无报废产生,投入完全等于产出,则成本耗费最小CP Yield:CP Yield 指测试一片芯片上所得到的有效的IC数目。
当产出芯片上的有效IC数目越多,即表示用相同制造时间所得到的效益愈大.生产周期(Cycle TIme)对成本(Cost)的影响是什幺?答:生产周期愈短,则工厂制造成本愈低。
正面效益如下:(1)积存在生产线上的在制品愈少(2)生产材料积存愈少(3)节省管理成本(4)产品交期短,赢得客户信赖,建立公司信誉FAC根据工艺需求排气分几个系统?答:分为一般排气(General)、酸性排气(Scrubbers)、碱性排气(Ammonia)和有机排气(Solvent)四个系统。
高架地板分有孔和无孔作用?答:使循环空气能流通,不起尘,保证洁净房内的洁净度;防静电;便于HOOK-UP。
RN8302用户手册

杭
州
深圳市锐能微科技有限公司
正 泰
仪
表
有
第 2 页
限
公
司
专
用
版本 1.1
三相多功能防窃电计量芯片 RN8302
1 芯片介绍
1.1 芯片特性
计量 提供全波、基波有功电能,5000:1 动态范围内,非线性误差<0.1%,满足国家电网 0.5S 和 0.2S 级有功电能表精度要求 提供全波、基波无功电能,5000:1 动态范围内,非线性误差<0.1% 提供全波、基波视在电能 提供有功、无功功率方向,支持无功四象限判断 具有潜动启动功能,启动阈值可调 电表常数可调 提供有功、无功、视在的快速脉冲计数 提供全波、基波,有功、无功和视在脉冲输出 测量 提供全波和基波有功、无功、视在功率 提供全波、基波和谐波三相电压电流有效值 提供全波、基波功率因数 提供电压线频率,精度<0.02% 提供各相基波电压电流相角,分辨率<0.02° 提供七路过零检测,过零阈值可设置 提供电压相序错检测 提供失压指示,失压阈值可设置 提供灵活的电压、电流波形缓存数据 提供电压暂降检测 提供过压、过流检测 防窃电 提供零线电流测量 提供一种低功耗模式 NVM2, 用于电流比较预判, 阈值 2 档可设置, 功耗小于 150μA 提供一种低功耗模式 NVM1,实现低功耗电流有效值测量,功耗小于 2mA 具有二次侧互感器开短路检测功能 软件校表 提供七路 ADC 通道增益校正,适用功率校表法 提供七路 ADC 通道相位校正,其中 A、B、C 三路电流通道支持分段相位校正 提供功率增益校正、相位校正 提供有功、无功、有效值 Offset 校正 提供校验和寄存器,对校表数据自动校验 适用于三相三线、三相四线制 单+3.3V 电源供电,具有电源监控功能
龙芯2K1000处理器数据手册说明书
龙芯2K1000处理器数据手册V1.22020年4月龙芯中科技术有限公司版权声明本文档版权归龙芯中科技术有限公司所有,并保留一切权利。
未经书面许可,任何公司和个人不得将此文档中的任何部分公开、转载或以其他方式散发给第三方。
否则,必将追究其法律责任。
免责声明本文档仅提供阶段性信息,所含内容可根据产品的实际情况随时更新,恕不另行通知。
如因文档使用不当造成的直接或间接损失,本公司不承担任何责任。
龙芯中科技术有限公司Loongson Technology Corporation Limited地址:北京市海淀区中关村环保科技示范园龙芯产业园2号楼Building No.2, Loongson Industrial Park, Zhongguancun Environmental Protection Park电话(Tel):************传真(Fax):************阅读指南《龙芯2K1000处理器数据手册》主要介绍龙芯2K1000处理器接口结构,特性,电气规范,以及硬件设计指导。
修订历史文档更新记录文档名: 龙芯2K1000处理器数据手册版本号:V1.2创建人: 芯片研发部创建日期: 2020-4更新历史序号. 更新日期版本号更新内容1 2017-7 V1.0 第一版2 2018-8 V1.1 1.增加CAMERA和VPU相关内容2.修改DVO0和UART2的复用关系3.更新LIO读写时序4.增加芯片分级信息3 2020-4 V1.2 1. 1.2.3节将DVO解释为通用并行显示接口2. 1.2.4节内存控制器功能描述修改3. 1.2.21节增加CAN总线描述内容4. 1.3节芯片工作温度更新5. 2.3节更正DVO0_CLKP/N与LIO_RDn/WRn的复用关系6. 2.6节USB接口功能描述修改7. 2.14节更正SDIO_DATA[3:0]与GPIO[39:36]复用关系8. 3.4节增加LIO波形图的说明9. 3.14节增加GMAC接口说明10.5.22节增加SATA/PCIE时钟特性11.第8章封装图改为矢量图,增加DIE位置信息12.增加第9章订货信息13.更新TBD相关内容手册信息反馈: *******************也可通过问题反馈网站/向我司提交芯片产品使用过程中的问题,并获取技术支持。
vdbench结果参数
vdbench结果参数
Vdbench是一款常用的存储性能测试工具,通过对存储设备进行读写操作,可以获得大量的测试结果参数,对于评估存储设备的性能指标及其是否满足应用场景的需求有着重要的意义。
以下是vdbench测试中常用的结果参数:
1. Response Time:响应时间,指从发送请求到获取响应的时间,通常以毫秒为单位。
该参数是衡量存储设备性能的关键指标之一,它反映了存储设备的读写速度,越小越好。
2. Throughput:吞吐量,指单位时间内可以处理的数据量,通常以MB/s为单位。
该参数反映了存储设备的数据传输效率,越大越好。
3. IOPS:每秒钟的IO操作数,指单位时间内IO请求的数量。
该参数反映了存储设备的处理能力,越大越好。
4. CPU Utilization:CPU利用率,指存储设备CPU的利用率。
该参数反映了存储设备的CPU负载情况,如果CPU利用率过高,可能会影响存储设备的性能。
5. Latency:延迟,指IO请求从发出到完成的时间。
该参数反映了存储设备的响应速度,越小越好。
6. Error Rate:错误率,指测试过程中IO请求的错误率。
该参数反映了存储设备的稳定性和可靠性,越小越好。
通过分析上述参数,可以全面了解存储设备的性能指标和处理能力,从而针对具体的应用场景选择合适的存储设备。
高通量DSC比较:TA Instruments Nano DSC Autosampler系统与GE
TA Instruments – Application Note__________________________________________________________________________________ High-throughput DSC: A Comparison of the TA Instruments Nano DSC Autosampler System™ with the GE Healthcare VP-Capillary DSC™Nichola Garbett, Lynn DeLeeuw and Jonathan B. ChairesJames Graham Brown Cancer CenterUniversity of LouisvilleLouisville, KYPurpose: The purpose of this study was to directly compare the performance of the new Nano DSC Autosampler System™ from TA Instruments and the VP-Capillary DSC™from GE Healthcare (MicroCal, LLC). Data were collected for both platforms in the same laboratory by the same operator using identical reagents and closely matched protocols. The quality of the raw data collected under a variety of conditions and the resulting transition temperatures (T max) and enthalpies (ΔH) were evaluated and compared.Background: All differential scanning calorimetry (DSC) scans in this study were performed using the protein lysozyme and standard solution conditions and protocols as recommended by the International Union of Pure and Applied Chemistry (IUPAC) (1). Results reported by Hinz and Schwarz for the recommended test materials and protocols were validated by collecting data sets on identical reagents in six different laboratories around the world using six different DSC instruments. The protein used by Hinz and Schwarz and the current study, lysozyme, is a 14.3 kDa enzyme that catalyzes the hydrolysis of 1,4-beta-linkages between N-acetylmuramic acid and N-acetyl-D-glucosamine residues in peptidoglycan and between N-acetyl-D-glucosamine residues in chitodextrins. This well-characterized enzyme is recognized as the standard testing material for DSC by organizations such as IUPAC and NIST (National Institute of Standards and Technology) (2).TA Instruments recently introduced the Nano DSC Autosampler System, a high sensitivity microcalorimeter that features a liquid handling system for automated operation. Test samples and matching reference buffer solutions were prepared and loaded into separate thermostated 96-well plates located within the liquid handling system. The DSC sample and reference cells were automatically filled with the solutions from the 96-well plates, and following the calorimetric run and data acquisition, were then rinsed and cleaned with a preset cleaning protocol prior to the next sample run. Once test samples and their matching buffer solutions are prepared and loaded into the plate, the Nano DSC Autosampler System operated unattended under computer control. Table 1 compares the specifications of the TA Instruments Nano DSC Autosampler System to those of the MicroCal VP-Capillary DSC system.TA Instruments – Application Note__________________________________________________________________________________Experimental Design: Each calorimeter system was operated using closely matched protocols (see Appendix A). For each system, run cycle times are specified by the user. Each cycle features equilibration times following cell loading, the actual data collection run, cooling, sample removal, washing and rinsing, and loading of the new samples.The two calorimeter systems were compared by running identical lysozyme samples (see Appendix B) at two different scanning rates, 1 and 2 °C min-1, and protein concentrations ranged from 0.05 - 2.22 mg mL-1. A total of seventy-eight thermograms were collected from triplicate measurements of protein samples at the various conditions. Sixty-four buffer reference scans were also collected. The buffer scans were collected before and after each concentration series of five to eight sample scans. DSC data for the lysozyme concentration series of 0.05, 0.10, 0.50, 1.00 and 2.00 mg mL-1were collected on both instruments. Data for additional lysozyme concentrations of 0.22, 1.11 and 2.22 mg mL-1 were collected on only the MicroCal VP-Capillary DSC to provide data for a direct comparison of identical sample mass (see Figure 1). All thermograms were baseline corrected and normalized using the manufacturer's software provided with each system.Results: Two key performance criteria most researchers are concerned with include total sample consumption and instrument sensitivity. Figure 1 shows representative results obtained for lysozyme thermal denaturation using the two systems. For these thermograms, data were selected for comparison for which the number of moles of protein used in the active sample cell volume of each instrument was identical. The number of moles of protein is the product of the sample concentration and the cell volume. While the TA Instruments Nano DSC Autosampler sample cell volume is 2.22 times larger than the MicroCal VP-Capillary DSC cell volume, toTA Instruments – Application Note__________________________________________________________________________________ analyze identical moles of protein, sample concentrations can be reduced by the same factor to provide data of similar or superior quality.For all cases shown, both calorimeters provided excellent thermograms and upon analysis yielded T max and ΔH values fully consistent with IUPAC standards (1). Panel A shows the thermogram for a dilute sample (0.11 mg mL-1) run on the Nano DSC Autosampler system. Panel B shows the thermogram of comparable moles of protein (required concentration of 0.23 mg mL-1) run on the VP-Capillary DSC system. At lower protein concentrations the Nano DSC Autosampler system provided superior data with less noise in the signal. Panels C and D show thermograms at much higher protein concentrations for which each DSC system provided data of equivalent quality.TA Instruments – Application Note __________________________________________________________________________________For accurate and precise protein analysis with DSC, the baseline reproducibility and stability are the most important performance specifications of the instrument. When comparing the buffer baselines that were generated on both instruments, two important observations could be made. First, the Nano DSC Autosampler had superior baseline reproducibility with no baseline scans excluded from the data set because of artifacts or other variations that would make them unusable in the analyses. Second, the stability of the baseline scans for the Nano DSC Autosampler was also superior to those generated on the VP-Capillary DSC .Figure 2 shows buffer-buffer scans collected on both instruments under the same scanning conditions over the course of approximately 3 days. The buffer scans collected on the Nano DSC Autosampler were highly reproducible with consistent shape and similar offset. In contrast, the buffer scans collected on the VP-Capillary DSC were much less reproducible with a number of buffer scans exhibiting significant changes in shape and offset, and erratic high temperature noise observed in two of the scans.TA Instruments – Application Note __________________________________________________________________________________Several thermodynamic parameters are calculated from DSC scans. T max and H values are routinely used in characterizing protein stability. Figure 3 shows the results obtained in this comparative study, along with the published data from the IUPAC recommendation study. Both the Nano DSC Autosampler and the VP-Capillary DSC compare favorably. Both instruments allow data to be collected at lower protein concentrations than were used in the earlier IUPAC study with commercial calorimeters of earlier generations. T max values calculated for both instruments in this study were slightly lower than those reported previously (1). Although T max values were slightly lower, many factors including sample preparation methods, sample concentrations and exact sample buffer composition could explain the variation seen with both instruments.he H values generated by both instruments were very comparable to H values reported previously (1). At the lower concentrations the variance in H from the expected value was much larger using the VP-Capillary DSC than that observed with the Nano DSC Autosampler . This discrepancy is most likely associated with inaccuracies in the estimation of peak areas because of greater uncertainties in baseline correction for samples of lower signal-to-noise ratios.TA Instruments – Application Note__________________________________________________________________________________ SummaryThe Nano DSC Autosampler system produced thermograms with superior baseline stability and reproducibility.The Nano DSC Autosampler system produced thermograms with superior signal-to-noise ratios at lower protein concentrations.At higher sample concentrations, the Nano DSC Autosampler and the VP-Capillary DSC produced thermograms with equivalent signal-to-noise ratios.Sample consumption was equivalent for the Nano DSC Autosampler and the VP-Capillary DSC platforms. The larger cell volume required for the Nano DSC Autosampler can be compensated for by the use of samples with lower concentrations.The superior signal-to-noise ratio of the Nano DSC Autosampler allows the routine use of lower sample concentrations.Both the TA Instruments Nano DSC Autosampler and the MicroCal VP-Capillary DSC are high-quality systems that perform very well and permit the highest possible sample throughput with automated, unattended sample handling.For each automated DSC system, the rate of sample throughput depends on user's choices of scan rate, temperature range and cycle settings (washes, equilibrations, etc.) References1. Hinz H-J & Schwarz FP (2001) Measurement and analysis of results obtained onbiological substances with differential scanning calorimetry. Pure Appl. Chem.73(4):745-759.2. Gatta GDG, Richardson MJ, Sarge SM, & Stolen S (2006) Standards, Calibration andGuidelines in Microcalorimetry. Part 2. Calibration Standards for Differential ScanningCalorimetry (IUPAC Technical Report). Pure Appl. Chem.78(7):1455-1476.TA Instruments – Application Note__________________________________________________________________________________Appendix ADetails of Instrument ProtocolsTA Instruments Nano DSC Autosampler SystemStart temperature: 10 °CFinal temperature: 80 °CScan rate: 1 or 2 °C min-1Pre-scan equilibration time: 10 minCleaning start temperature: 25 °CCleaning routine: 2 x 10 mL deionized water each capillary; soak time 0 s; initial & final air purge Loading window: 10 °CIdling temperature: 20 °C96-well tray thermostat temperature: 5 °CGE Healthcare VP-Capillary DSC SystemStart temperature: 10 °CFinal temperature: 80 °CScan rate: 1 or 2 °C min-1Pre-scan equilibration time: 10 minFeedback mode/gain: MidFiltering period: 2 sCleaning start temperature: 25 °CCleaning routine: 4 x 2.5 mL deionized water each capillary; 4 x 2.5 mL deionized water, syringe Cell filing volume: 300 µLSpeed of injection: 50 µL/sNumber of filing strokes: 4Idling temperature: 20 °C96-well tray thermostat temperature: 5 °CTA Instruments – Application Note__________________________________________________________________________________Appendix BDetails of Sample PreparationMaterialsGlycine, ≥ 99 % (SIGMA, Catalog # G7126)Hydrochloric acid, 37 % (SIGMA, Catalog # 258148)Lysozyme, ≥ 98 % (SIGMA, Catalog # L4919; lot # 088K13582) (N.B. Lysozyme, ≥ 90 %) (SIGMA, Catalog # L6876; lot # 117K1547 used for initial studies)Preparation of buffer: 0.1 M Glycine-HCl, pH 2.4Glycine (15.014 g) was dissolved in freshly deionized water (1.8 L) with stirring for 15 min. The pH was adjusted to 2.4 using concentrated hydrochloric acid and the solution transferred to a 2 L volumetric flask with exhaustive rinsing of vessels during transfer. The volume was adjusted to 2 L using freshly deionized water and the solution filtered (PALL Supor-200 membrane filter, Catalog # 63025) before use. A total of 4 L of buffer was prepared.Preparation of lysozyme solutionsLysozyme (60 mg) was dissolved in 0.1 M Glycine-HCl buffer (5 mL) overnight at 4 o C on a rotary mixer. The lysozyme stock solution was then transferred to a dialysis cassette (Pierce, Catalog # 66110; 3-12 mL; 3.5 K MWCO) and dialyzed against 0.1 M Glycine-HCl buffer for a period of 24 h at 4 o C with four buffer changes of 1 L at intervals of 3 h, 4 h, 4 h and overnight. The lysozyme stock solution was recovered from overnight dialysis and filtered (National Scientific 0.45 µm syringe filter, Catalog # F2513-14). Dialysis buffer was filtered into a 1 L screw top buffer bottle (PALL Supor-200 membrane filter, Catalog # 63025). The concentration of the lysozyme stock solution was determined spectrophotometrically using an extinction coefficient of 2.65 L g-1 cm-1 at 280 nm (1). Working solutions at 0.05, 0.10, 0.22, 0.50, 1.00, 1.11, 2.00 and 2.22 mg mL-1 were prepared from the stock solution and dialysis buffer and the precise concentrations determined spectrophotometrically.。
史上最强悍的LTE知识集锦,看完你也成大神
●OFDM系统优点: ◇通过把高速率数据流进行串并转换, 使得每个子载波上的数据符号持续长度相对增加, 从而有 效地减少由于无线信道时间弥散所带来地ISI,进而减少了接收机内均衡器地复杂度,有时甚至 可以不采用均衡器,而仅仅通过插入循环前缀地方法消除ISI的不利影响。 ◇OFDM技术可用有效的抑制无线多径信道的频率选择性衰落。 因为OFDM的子载波间隔比较小, 一般的都会小于多径信道的相关带宽,这样在一个子载波内,衰落是平坦的。进一步,通过合理 的子载波分配方案, 可以将衰落特性不同的子载波分配给同一个用户, 这样可以获取频率分集增
益,从而有效的克服了频率选择性衰落。 ◇传统的频分多路传输方法是将频带分为若干个不相交的子频带来并行传输数据流, 各个子信道 之间要保留足够的保护频带。 而OFDM系统由于各个子载波之间存在正交性, 允许子信道的频谱 相互重叠,因此于常规的频分复用系统相比,OFDM系统可以最大限度的利用频谱资源。 ◇各个子信道的正交调制和解调可以分别通过采用IDFT(Inverse Discrete Fourier Transform)和 DFT实现, 在子载波数很大的系统中, 可以通过采用IFFT(Inverse Fast Fourier Transform)和FFT 实现,随着大规模集成电路技术和DSP技术的发展,IFFT和FFT都是非常容易实现的。 ◇无线数据业务一般存在非对称性,即下行链路中的数据传输量大于上行链路中的数据传输量, 这就要求物理层支持非对称的高速率数据传输, OFDM系统可以通过使用不同数量的子信道来实 现上行和下行链路中不同的传输速率。 ●OFDM系统缺点: ◇易受频率偏差的影响。 由于子信道的频谱相互覆盖, 这就对他们之间的正交性提出了严格的要 求, 无线信道的时变性在传输过程中造成了无线信号频谱偏移, 或发射机与接收机本地振荡器之 间存在频率偏差,都会使OFDM系统子载波之间的正交性遭到破坏,导致子信道间干扰( ICI, Inter-Channel Interference),这种对频率偏差的敏感性是OFDM系统的主要缺点之一。 ◇存在较高的峰值平均功率比。 多载波系统的输出是多个子信道信号的叠加, 因此如果多个信号 的相位一致时, 所得到的叠加信号的瞬时功率就会远远高于信号的平均功率, 导致较大的峰值平 均功率比(PAPR,Peak-to-Average power Ratio),这就对发射机内放大器的线性度提出了很 高的要求,因此可能带来信号畸变,使信号的频谱发生变化,从而导致各个子信道间的正交性遭 到破坏,产生干扰,使系统的性能恶化。
- 1、下载文档前请自行甄别文档内容的完整性,平台不提供额外的编辑、内容补充、找答案等附加服务。
- 2、"仅部分预览"的文档,不可在线预览部分如存在完整性等问题,可反馈申请退款(可完整预览的文档不适用该条件!)。
- 3、如文档侵犯您的权益,请联系客服反馈,我们会尽快为您处理(人工客服工作时间:9:00-18:30)。
Weekly Throughput of Selected BeadChips with a Single HiScan or iScan System
BEADCHIP APPROXIMATE SCAN TIME PER SAMPLE (MINUTES) MANUAL LOADING* (SAMPLES PER WEEK) WITH AUTOMATION**
(SAMPLES PER WEEK)
HiScan iScan HiScan iScan HiScan iScan
Infinium HumanOmni5 15 26 128 128 480 272
Infinium HumanOmni2.5-8 6.5 11.4 256 256 1,088 608
Infinium
HumanOmniExpress+
6.1 7.5 256 256 1,152 960
Infinium Methylation450K 5.0 5.0 384 384 1,440 1,440
Infinium HumanCytoSNP-12 1.8 2.9 384 384 1,728 1,728
InfiniumHD iSelect (12x1) 2.9 2.9 384 384 1,728 1,728
InfiniumHD iSelect (24x1) 1.0 1.0 768 768 3,456 3,456
BovineLD 0.3 0.3 768 768 3,456 3,456
Universal-32 BeadChip for
GoldenGate Genotyping
0.3 0.3 1,440 1,440 1,440 1,440
*Manual: 1FTE, 1 HiScan or iScan system, 16 BeadChips/batch, 2 batches/FTE/Tecan per week
** Automated: 1FTE, 1 HiScan or iScan system, 2 Tecans, 1 Autoloader 2.x, 24 BeadChips/batch, 2
batches/FTE/Tecan per week