Isospin odd pi K scattering length
翻译

通过注射玻璃纤维增强型塑料来提高模具的耐磨性纤维增强塑料注塑成型过程中的磨损对于模具的磨损性能而言无疑又是种挑战。
在过去的几十年中,为了最大限度地减少磨损问题大量开发PVD和CVD涂层模具。
在这项工作中,为了增加用于玻璃纤维增强塑料模具的表面耐磨损性,对TiAlSiN和氮化铬/ CRCN / DLC这两种不同的涂层进行试验TiAlSiN沉积作为分级单层涂层,而CrN / CRCN / DLC是一个由三个不同层纳米结构涂层组成的。
这两种涂层都由PVD非平衡磁控溅射产生,并且被用于由能量色散光谱(EDS)提供的扫描电子显微镜(SEM),原子力显微镜(AFM),显微硬度(MH )和划痕试验分析的表征。
探究涂层形貌,厚度,粗糙度,化学成分和结构,基质的硬度和粘性(对模具的影响)。
耐磨性通过将涂层样本和未加涂层的参考样本插入含30wt%的玻璃纤维增强型聚丙烯注塑模具的管道来测试表征。
结果表明,经过45,000周期,相比无涂层模具钢,表面有TiAlSiN和氮化铬/ CRCN / DLC涂层的模具的耐磨性分别提高了25倍和58倍。
1 。
前言汽车零部件产业用注射玻璃纤维增强型塑料来生产许多汽车零部件。
这些材料对于模具型腔而言非常粗糙,这是在注塑行业出现的主要问题之一:由于在成型的表面磨损,模具寿命短。
在注射过程中玻璃纤维的运动使他们的端部在模具表面产生划痕,使表面足够粗糙以减少注塑产品的表面亮度。
这问题导致需要额外的修复操作成本和非生产性时间与随之而来的缺乏生产效率。
为了解决这种不便,已经采纳了一些解决方案,如涂层和表面处理,从镀铬到高速氧燃料(HVOF )的WC / Co [1]和金属涂层,如通过电沉积或无电沉积产生的硬铬或镍- 磷[2]。
还有钛,铝层和通过物理气相沉积(PVD)或化学气相沉积(CVD)产生的其他的碳化物或氮化物层[3]已被用于具有相同的目的。
这项工作目的是表征TiAlSiN和CrN / CRCN / DLC PVD的溅射涂层在使用玻璃注塑工艺纤维强化型过程中的性能,以确定一个耐磨性更好的产品。
射线检测术语

《无损检测术语射线照相检测》1范围本标准界定了工业射线照相检测的术语。
2术语和定义2.1吸收absorption2.2活度activity2.3老化灰雾ageing fog2.4阳极anode2.5阳极电流anode current2.6伪像(假显示)artefact ( false indication )2.7衰减attenuation2.8衰减系数attenuation coefficientμ2.9平均梯度average gradient2.10背散射back scatter背散射线back scattered radiation2.11射束角beam angle2.12电子回旋加速器betatron2.13遮挡介质blocking medium2.14累积因子build-up factor2.15暗盒cassette暗袋2.16阴极cathode2.17已校验的阶梯密度片calibrated density step wedge2.18(胶片的)特性曲线characteristic curve ( of a film )2.19清澈时间clearing time2.20准直collimation2.21准直器collimator2.22康普顿散射Compton scatter2.23计算机层析成像computerized tomography ( CT )2.24恒电势电路constant potential circuit2.25连续谱continuous spectrum2.26对比度contrast2.27反衬介质contrast medium2.28对比灵敏度(厚度灵敏度)contrast sensitivity ( thickness sensitivity )2.29衰减曲线decay curve2.30密度计densitometer2.31(胶片或相纸的)显影development ( of a film or paper )2.32衍射斑纹diffraction mottle2.33剂量计dosemeter ( dosimeter )2.34剂量率计dose rate meter2.35双焦点管dual focus tube2.36双线像质计duplex wire image quality indicator双丝像质计双线图像质量指示器2.37边缘遮挡材料edge-blocking material2.38均值过滤器(射线束致平器)equalizing filter ( beam flattener ) 2.39等效X射线电压equivalent X-ray voltage2.40曝光exposure2.41曝光计算器exposure calculator2.42曝光曲线exposure chart2.43曝光宽容度exposure latitude2.44曝光时间exposure time2.45片基film base2.46胶片梯度film gradientG2.47观片灯(观察屏)film illuminator ( viewing screen )2.48胶片处理film processing2.49胶片系统速度film system speed2.50滤光板filter2.51定影fixing2.52探伤灵敏度flaw sensitivity2.53荧光增感屏fluorescent intensifying screen2.54金属荧光增感屏fluorometallic intensifying screen2.55荧光透视fluoroscopy2.56焦点focal spot2.57焦点尺寸focal spot size2.58焦距focus-to-film-distanceffd2.59灰雾度fog density2.60伽玛射线照相gamma radiography2.61伽玛射线gamma raysγ射线2.62伽玛射线源gamma-ray source2.63伽玛射线源容器gamma-ray source container2.64几何不清晰度geometric unsharpness2.65颗粒性graininess2.66颗粒度granularity2.67半衰期half life2.68半价层half value thicknessHVT2.69光源illuminator观片灯2.70图像对比度image contrast2.71图像清晰度image definition2.72图像增强image enhancement2.73图像增强器image intensifier2.74像质image quality图像质量2.75像质计image quality indicator图像质量指示器IQI2.76像质值image quality value图像质量值IQI灵敏度IQI sensitivity2.77入射射线束轴线incident beam axis2.78工业放射学industrial radiology2.79固有过滤inherent filtration2.80固有不清晰度inherent unsharpness2.81增感因子intensifying factor2.82增感屏intensifying screen2.83潜影latent image2.84直线电子加速器linear electron accelerator ( LINAC ) 2.85屏蔽masking2.86金属屏metal screen2.87微焦点射线照相microfocus radiography2.88调制传递函数modulation transfer functionMTF2.89运动不清晰度movement unsharpness2.90工件对比度object contrast2.91工件至胶片距离object-to-film distance2.92周向曝光panoramic exposure2.93透度计penetrameter2.94压痕pressure mark2.95初始射线primary radiation2.96投影放大率projective magnification2.97投影放大技术projective magnification technique 2.98(射线束)质量quality ( of a beam of radiation ) 2.99照射对比度radiation contrast2.100辐射源radiation source2.101射线照相底片/照片radiograph2.102射线照相胶片radiographic film2.103射线照相radiography2.104放射性同位素radioisotope2.105射线透视radioscopy2.106棒阳极管rod anode tube2.107散射线scattered radiation2.108增感型胶片screen type film2.109源固定器source holder2.110源尺寸source size2.111源至胶片距离(sfd)source-to-film distance ( sfd ) 2.112空间分辨力spatial resolution2.113比活度specific activity2.114阶梯楔块step wedge2.115立体射线照相stereo radiography2.116靶target2.117管子光阑tube diaphragm2.118管头tube head2.119管罩tube shield2.120管子遮光器tube shutter2.121管子窗口tube window2.122管电压tube voltage2.123未密封源unsealed source2.124不清晰度unsharpness2.125有效密度范围useful density range2.126真空暗盒vacuum cassette2.127观察屏蔽viewing mask2.128可视对比度visual contrast2.129X射线X-rays2.130X射线胶片X-ray film2.131X射线管X-ray tube。
椭偏仪相关

Multichannel ellipsometer for real time spectroscopy of thin film deposition from 1.5 to 6.5 eVJ. A. Zapien, R. W. Collins, and R. MessierCitation: Rev. Sci. Instrum. 71, 3451 (2000); doi: 10.1063/1.1288260View online: /10.1063/1.1288260View Table of Contents: /resource/1/RSINAK/v71/i9Published by the American Institute of Physics.Related ArticlesMulti-channel far-infrared HL-2A interferometer-polarimeterRev. Sci. Instrum. 83, 10E336 (2012)Collinearity alignment of probe beams in a laser-based Faraday effect diagnosticRev. Sci. Instrum. 83, 10E320 (2012)Spatial heterodyne Stokes vector imaging of the motional Stark-Zeeman multipletRev. Sci. Instrum. 83, 10D510 (2012)Far-infrared polarimetry diagnostic for measurement of internal magnetic field dynamics and fluctuations in the C-MOD Tokamak (invited)Rev. Sci. Instrum. 83, 10E316 (2012)First results from the J-TEXT high-resolution three-wave polarimeter-interferometerRev. Sci. Instrum. 83, 10E306 (2012)Additional information on Rev. Sci. Instrum.Journal Homepage: Journal Information: /about/about_the_journalTop downloads: /features/most_downloadedInformation for Authors: /authorsMultichannel ellipsometer for real time spectroscopy of thinfilm deposition from1.5to6.5eVJ.A.Zapien,R.W.Collins,a)and R.MessierDepartment of Engineering Science and Mechanics and the Materials Research Laboratory,The Pennsylvania State University,University Park,Pennsylvania16802͑Received9March2000;accepted for publication9June2000͒A rotating polarizer multichannel ellipsometer has been optimized for operation well into theultraviolet͑UV͒spectral range.With this instrument,132spectral points in the ellipsometricparameters͑,⌬͒over the photon energy range from1.5eV͑827nm͒to6.5eV͑191nm͒can becollected in a minimum acquisition time of24.5ms,corresponding to one optical cycle of therotating polarizer.Averages over two and80optical cycles͑obtained in49ms and1.96s,respectively͒give standard deviations in͑,⌬͒of less than͑0.04°,0.08°͒and͑0.007°,0.015°͒,respectively,for the energy range from3.5to6.0eV,as determined from successive measurementsof a stable thermally oxidized silicon wafer.Key modifications to previous instrument designsinclude:͑i͒a tandem in-line Xe/D2source configuration for usable spectral output from1.5to6.5eV;͑ii͒MgF2Rochon polarizers for high transmission in the UV without the need for opticalactivity corrections;͑iii͒a spectrograph with a grating blazed at250nm and two stages of internallymounted order-sortingfilters;and͑iv͒nonuniform grouping of the pixels of the photodiode arraydetector for a more uniform spectral resolution versus photon energy,with energy spreads per pixelgroup ranging from0.02eV at1.6eV to0.05eV at5.1eV.As an example of the application of thisinstrument,results of real time spectroscopic ellipsometry studies are reported for the deposition ofan amorphous silicon nitride thinfilm by radio-frequency magnetron sputtering onto a silicon wafersubstrate.©2000American Institute of Physics.͓S0034-6748͑00͒04909-1͔I.INTRODUCTIONReal time spectroscopic ellipsometry͑RTSE͒has beenapplied widely in thinfilm studies to characterize the evolu-tion offilm thicknesses,optical properties,and micro-structure.1In the instrument designfirst applied by Kimet al.,2the basic components of the rotating polarizer multi-channel ellipsometer include:͑i͒a Xe lamp as a broadbandsource,͑ii͒collimating optics,͑iii͒a continuously rotatingpolarizer,͑iv͒a reflecting sample,͑v͒afixed analyzer,͑vi͒focusing optics,͑vii͒a prism spectrograph,and͑viii͒a pho-todiode array͑PDA͒detection system.Such an instrumentis capable of collecting spectra in the ellipsometry angles ͑,⌬͒and the polarized reflectance R simultaneously with a minimum acquisition time of/ϳ15ms,whereis the polarizer angular rotation frequency.3,4The spectra obtainedby current state-of-the-art multichannel ellipsometers typi-cally range from1.5to4.5eV with the upper limit depend-ing sensitively on the instrument design and sample reflec-tance.This spectral range of operation severely limits theanalysis capabilities in studies of wide band gap materials,examples being nitrides and oxides which are useful in avariety of applications extending from microelectronics tooptical and wear-resistant coatings.Although ellipsometerswith single channel detection have been applied for manyyears covering the spectral range from1.5to5.5eV,5andmore recently to an upper spectral limit of6.5eV,6,7they do so with the use of scanning double monochromators and long collection times.As a result,such instrument designs are unsuitable for adaptation to real time spectroscopy of thin film growth.With the increasing demands in wide band gap materials performance and reliability,there is a compelling need to extend the upper limit of RTSE deeper into the ultraviolet ͑UV͒above5.0eV.In this way one can take full advantage of the capabilities of the technique,as has been demonstrated for Si-based thinfilms studied over the1.5–4.5eV spectral range.8The primary spectral limitation in the UV for current multichannel ellipsometer designs results from a sharp re-duction in the irradiance output of the light source,a high-pressure Xe lamp,for photon energies above3.5eV.This effect is often compounded by a reduction in the spectral throughput of the ellipsometer.For example,the reflection efficiency of the spectrograph grating may fall rapidly in the UV unless the grating is chosen with a blaze approaching the lowest accessible wavelengths.In addition,the low light lev-els at the UV-detecting pixels of the PDA must compete with the stray light originating from the stronger visible light that enters the spectrograph in parallel.Stray light can have a number of sources ranging from defects in the optical com-ponents of the spectrograph to multiple reflections between the protective window of the PDA and the array surface.9 In this article,we describe in detail the design enhance-ments to the rotating-polarizer multichannel ellipsometer that result in a useful spectral range in͕(,⌬),R͖from1.5eV ͑827nm͒to6.5eV͑191nm͒,while maintaining high speed data acquisition necessary for RTSE.10In addition to thea͒Author to whom correspondence should be addressed;electronic mail:rwc6@REVIEW OF SCIENTIFIC INSTRUMENTS VOLUME71,NUMBER9SEPTEMBER200034510034-6748/2000/71(9)/3451/10/$17.00©2000American Institute of Physicsinstrument design details,we provide an illustrative example of the application of the instrument for thin film growth analysis.In this example,the deposition of an amorphous silicon nitride (a -SiN x )thin film on a crystalline Si (c -Si)wafer by reactive radio-frequency ͑rf ͒magnetron sputtering is characterized using a two-layer model that simulates the separate processes of interface formation and bulk film growth.II.INSTRUMENT DEVELOPMENTFigure 1shows a schematic of the components of the UV-extended multichannel ellipsometer designed to span the photon energy range from 1.5to 6.5eV.In this instrument design,the broadband source incorporates a see-through deu-terium (D 2)lamp 11with the conventional high-pressure Xe lamp mounted behind it.The combined emission from this tandem Xe–D 2source configuration can be tailored by ad-justing an iris between the two lamps and,thus,controlling the irradiance from the Xe lamp that is allowed to pass through the center of the discharge of the D 2lamp.An UV achromatic objective 12is used to collimate the combined source output.The achromatic objective was preferred over an off-axis parabolic mirror for the following two reasons.First,the mirror was found to provide less collimating power for a weak,extended source such as the D 2lamp,and sec-ond,the mirror also made it more difficult to eliminate un-desirable source polarization effects which lead to errors in the data for the rotating polarizer configuration.In the instrument design of Fig.1,the rotating polarizer and fixed analyzer are constructed from MgF 2Rochon elements.13The advantages of MgF 2over quartz elements used in earlier ellipsometer designs 14include lower reflection losses,the absence of optical activity effects,and most im-portantly,greater transmittance above 5.7eV.The rotating polarizer element is specified by the manufacturer as gener-ating a displacement of Ͻ1arc min ͑or Ͻ0.02°͒in the trans-mitted beam over the rotational period.13This narrow speci-fication minimizes the possibility of periodic beam misalignment as the polarizer rotates.In fact,irradiance mea-surements performed over half rotations of the polarizer agree to better than 0.05%,indicating that such spatial dis-placements are experimentally insignificant.A second UV achromatic objective is mounted after the fixed analyzer to focus the collimated beam onto the entrance slit of the spectrograph.The detection stage consists of a grating spectrograph 15and a silicon PDA detector with 1024pixels.16The spectrograph uses an aberration-corrected holo-graphic grating with 285grooves/mm blazed at 250nm.A nonuniform pixel-grouping mode ͑26pixels @16ϫ;40pix-els @8ϫ;and 66pixels @4ϫ͒has been used to improve the photon energy resolution at high energy which would other-wise degrade due to the linear dispersion of the diffraction grating versus wavelength.In this nonuniform grouping mode,a photon energy spread per pixel group has been ob-tained that closely matches the spectrograph resolution for the 0.1mm slit used here ͑see Table I ͒.Figure 2presents the unprocessed PDA output ͑in arbi-trary units ͒for the Xe lamp alone and for the tandem Xe–D 2source,both measured in the straight-through configuration.Also shown are the positions of two thin ͑0.07and 0.19mm ͒plastic color filters 17mounted directly on top of the silicon PDA that serve to reject higher order diffractions from the grating.The inset of Fig.2shows the transmittance of both filters as measured by the PDA.For the UV-extended multi-channel ellipsometer,two filters have been preferred over a previous single filter design 18for two reasons.First,with the extended UV range there is a need to reject the second order diffraction for wavelengths as short as 380nm ͑3.26eV ͒.Second,when relying on a single filter,it is necessary for its cutoff wavelength to be sharp and as close as possible to theTABLE I.͑a ͒Photon energy spread ⌬E per pixel group for the 1024pixel PDA of the UV-extended multichannel ellipsometer,using uniform and nonuniform pixel grouping modes;͑b ͒the full width at half-maximum ͑FWHM ͒of spectral lines from a low pressure mercury lamp using a fully ungrouped mode with 0.05and 0.1mm spectrograph entrance slits.͑a ͒Energy spread per pixel group Uniform grouping Nonuniform grouping Energy ͑eV ͒Group size ⌬E ͑eV ͒Group size ⌬E ͑eV ͒1.6080.01160.022.2480.02160.042.3180.0280.023.5080.0580.053.5480.0540.035.0780.1040.056.3980.1640.08͑b ͒Spectrograph resolution FWHM of the emission lines ofa low pressure Hg lamp Energy ͑eV ͒0.05mm slit0.10mm slit2.270.010.022.850.020.033.070.020.033.400.030.043.970.040.054.190.040.064.900.060.08FIG.1.Schematic of the rotating polarizer multichannel ellipsometer ca-pable of covering the 1.5–6.5eV spectral range.The maximum polarizer rotation frequency is 20.4Hz.3452Rev.Sci.Instrum.,Vol.71,No.9,September 2000Zapien,Collins,and Messierhighest photon energy where second order diffraction is present.As a result,a loss in the detected intensity in favor of a gain in rejection efficiency is unavoidable.Figure 2and its inset shows that with the two filters selected here,second order rejection has been achieved with minimum irradiance losses.With the use of the tandem Xe–D 2source and this two filter scheme,a remarkably flat spectral output over the energy range from 2.0to 5.5eV has been achieved ͑see Fig.2͒.In the present configuration,the PDA outputs drop from their peak values by a factor of 20at 4.1eV when the Xe lamp alone is used and at 6.6eV when the tandem Xe–D 2source is used.Above these photon energies,stray light cor-rections are essential to maintain accuracy.9The new instrument is well suited for real time charac-terization of wide band gap materials.For the first applica-tions of this new instrument,a magnetron sputtering system is mounted at the vertical goniometer axis of the ellipsometer as shown in Fig.1.Optical access is provided by two vitre-ous silica windows mounted on ultrahigh vacuum ͑UHV ͒compatible flanges.The substrate holder is attached to a pre-cision x –y –z -tilt manipulator that allows precise alignment of the sample using controls external to the vacuum system.The substrate holder can be heated to 400°C and biased using either pulsed direct current or rf.Materials of interest that can be deposited in the present configuration include boron nitride ͑BN ͒,silicon nitrides (SiN x ),silicon oxyni-trides (SiO y N x ),and tantalum oxide (Ta 2O 5),among others.For the application presented here,an a -SiN x thin film was deposited using rf plasma excitation.Further details of the specific deposition process studied here are given in Sec.IV.III.INSTRUMENT THEORY AND OPERATIONA comprehensive review of the calibration,error correc-tion,and data reduction for rotating polarizer multichannelellipsometers in general can be found in the literature.19Here,we emphasize detection system error correction,in-strument calibration,and data reduction as it relates to the performance of the instrument at high energy.In addition,we highlight various improvements in error correction estab-lished since the previous reports.9,19First,in Sec.III A the basic mode of data collection will be reviewed for an ideal ͑error-free ͒system.Characterization and correction of themain error sources for the UV-extended multichannel ellip-someter will be discussed in Sec.III B.Finally,Sec.III C outlines the determination of the polarizer and analyzer cali-bration angles and summarizes data reduction.A.Data collection principlesFor an error-free system with a polarizer mechanical ro-tation frequency of ,the irradiance at any pixel k of the detector exhibits the wave formI k Ј͑t ͒ϭI 0k Ј͑1ϩ␣k Јcos 2t ϩk Јsin 2t ͒.͑1͒Here ␣kЈand k Јare the normalized 2Fourier coefficients of the irradiance wave form,uncorrected for the absolute phase of polarizer rotation.Because the PDA is an integrating de-tector,these coefficients can be determined from the follow-ing equations:␣kЈϭͩ2ͪ͑S 1k ϪS 2k ϪS 3k ϩS 4k ͒/͑S 1k ϩS 2k ϩS 3k ϩS 4k ͒,͑2a ͒kЈϭͩ2ͪ͑S 1k ϩS 2k ϪS 3k ϪS 4k ͒/͑S 1k ϩS 2k ϩS 3k ϩS 4k ͒.͑2b ͒Here the ͕S jk ,j ϭ1,...,4͖values represent the raw data;each value is an integration of the irradiance wave form over the time interval between two successive readouts ͑i.e.,the exposure time ͒.Readouts are triggered four times per optical cycle ͑one-half mechanical cycle ͒synchronously with the polarizer rotation using the output of an optical encoder.As a result,the exposure time is /4.For an error-free ellip-someter aligned in the straight-through configuration with the sample removed,the light entering the fixed analyzer should be linearly polarized.Under these conditions,the re-sidual function should vanish for all pixels k .This function is defined byR k ϭ1Ϫ͑␣k Ј2ϩk Ј2͒1/2.͑3͒Deviations in R k from zero can be traced to various errors including source polarization,ellipsometer misalignment,polarizer imperfections,and detection system errors such as nonlinearity and image persistence.The residual function will be studied in detail when image persistence errors are considered in Sec.III B.Ellipsometer calibration also employs the residual func-tion as discussed in Sec.III C.Calibration procedures deter-mine the absolute phase of the wave form of Eq.͑1͒in terms of the true angle of the polarizer transmission axis P Ј,mea-sured with respect to the plane of incidence.Specifically,such procedures identify the value of P Јat the onset of the S 1k integration.This value denoted ϪP Sk is a linear function of pixel group number k ͑for uniform grouping ͒with a slope equal to the polarizer rotation during the elapsed time be-tween the readout of two successive pixel groups.B.Systematic errorsThe principles described in Sec.III A assume instrument ideality.In practice,several systematic errors specifictoFIG.2.Unprocessed output of the photodiode array ͑in arbitrary units ͒plotted vs photon energy obtained in the straight-through configuration for a Xe lamp alone ͑light line ͒and for a tandem Xe–D 2source ͑bold line ͒.The inset shows the measured transmittance for filters 1͑line ͒and 2͑points ͒.3453Rev.Sci.Instrum.,Vol.71,No.9,September 2000Multichannel ellipsometerPDA detection systems have been identified and accounted for,including:͑i͒detector nonlinearity,͑ii͒detector image persistence,and͑iii͒spectrograph stray light.Previous stud-ies have shown that the nonlinearity effect varies signifi-cantly depending on the commercial supplier of the PDA. For the UV-extended multichannel ellipsometer,the detector nonlinearity has been characterized by measuring the inte-grated irradiance over increasingly long exposure times and by repeating this measurement using different spectrograph slit widths in order to vary the count rate at each detector pixel.With this procedure,count rates ranging from10to 1200counts/ms for integration times ranging from5to600 ms have been analyzed.͑The saturation level for this PDA system is214counts.͒Analyses of the observed counts ver-sus exposure time at the different pixels give linear regres-sion coefficients between0.99995and0.99999for the dif-ferent count rates used here.Such results are considered sufficient to rule out detector nonlinearity as a significant source of error for the purposes of ellipsometric measurements.9Stray light refers to the small fraction of light that reaches the detector after following a path different than the designed one.Sources of stray light include:͑i͒scattered background light within the spectrograph-detector enclosure;͑ii͒multiply reflected light between the detector element and its window;and͑iii͒leakage between detector pixel groups. To avoid stray light source͑ii͒,the detector window has been removed for the instrument developed here.Although a cor-rection procedure for source͑i͒has been developed,19it has yet to be implemented for the UV-extended ellipsometer. Because of the rapid falloff in the Xe lamp output,stray light corrections for photon energies aboveϳ4.1eV are required for previous multichannel ellipsometer designs.Owing to the remarkablyflat output of the tandem Xe–D2source,such corrections for the present design are not required in most applications even at energies as high as6.5eV.It is clear that for samples in which the reflected irradiance is strongly modulated,however,the͑,⌬͒data can be quite sensitive to stray light errors over the spectral ranges of low reflectance. As a result,stray light corrections are to be implemented in the future for highest accuracy.For the discussion to follow, it is important to remark that stray light may not contribute to errors in the residual function measured in the straight-through configuration because the linear polarization pro-duced is independent of photon energy,and hence,the stray and true light may be indistinguishable.As noted above,the experimental errors that contribute to a nonzero residual function include:͑i͒source polariza-tion,͑ii͒misalignment and imperfection of the optical com-ponents,and͑iii͒PDA image persistence.Figure3shows the residual function versus energy for the optimally aligned in-strument.The characteristic features observed here have been found to be reproducible throughout the system devel-opment and optimization,which included modification or re-placement of the Xe lamp,collimating optics,polarizer and analyzer elements,and spectrograph diffraction grating,as well as incorporation of the D2lamp.More definitive in-sights into the nature of the nonzero residual function were obtained by rotating the detector180°with respect to the diffraction grating.Upon rotation,the relationship between the pixel number and photon energy is reversed;however, the measured residual function deviations from zero were found to be precisely reversed as well.Thus,the measured errors are specific to the pixels of the detector.From more detailed studies to be described next,it was determined that a pixel-dependent image persistence factor was needed to cor-rect the errors in the residual function across the spectrum.The image persistence correction factor as a function of pixel number is estimated using two independent measure-ments.In thefirst,more direct approach,repetitive measure-ments versus time are performed as a fast shutter is being closed͑5ms open-to-close transfer time͒.For an image persistence-free detector,the integrated irradiance measured when the shutter is fully closed over the entire exposure time should be zero͑after background correction͒.In reality,how-ever,some counts are detected that persist from the previous nonzero detector readout͑when the shutter is at least par-tially open͒.The image persistence correction factor͑IPCF͒is then defined as the ratio of the persisting counts divided by the counts detected during the previous readout.This mea-surement must be done at the same high speed and grouping mode as the RTSE measurements.As a result,the determi-nation of the IPCF by this method has relatively poor signal to noise ratio.For this reason,a second method for determin-ing the IPCF is adopted.In this method,it is assumed that the entire error in the measured residual function is due to image persistence.The corresponding IPCF for each pixel group is then determined from a numerical inversion of the measured residual function at that group.The correct IPCF is given by the value that leads to a zero residual function.The good agreement between the IPCF measured by both tech-niques,as shown in Fig.4,supports the assumption that the contributions to the nonzero residual function from other sources of error are negligible.A measure of the residual function after implementation of an average IPCF obtained in multiple error analyses is shown in Fig.5͑a͒.The effect of the IPCF on measurements of a c-Si wafer substrate with a 20Ånative oxide is presented in Fig.5͑b͒.A considerable improvement in the⌬spectra at low energies can be ob-served.The effect of the IPCF in this region is more notice-able because the image persistence and the instrument sensi-tivity to systematic errors are both greaterhere.FIG.3.Residual function measured in the straight-through configuration for the well aligned UV-extended multichannel ellipsometer.The characteristic features shown here have been found to be reproducible throughout the ellipsometer optimization.3454Rev.Sci.Instrum.,Vol.71,No.9,September2000Zapien,Collins,and MessierC.Ellipsometer calibration and data reductionThe calibration procedures as they relate to the UV-extended operational range of the multichannel ellipsometer are described in this section.The general case has been treated extensively by Nguyen et al.19and includes incorpo-ration of the effects of source polarization as well as optical activity in both polarizer and analyzer elements.For the par-ticular case of the UV-extended multichannel ellipsometer,the use of MgF 2Rochon elements for the rotating polarizer and fixed analyzer eliminates the need for optical activity corrections.Further simplification of the description of Ref.19results because source polarization has been found to be negligible in the present instrument.Under these conditions,the theoretical irradiance at pixel group k of the detector is I k ͑t ͒ϭI 0k ͓1ϩ␣k cos 2͑t ϪP Sk ͒ϩk sin 2͑t ϪP Sk ͔͒,͑4͒where the Fourier coefficients ␣k and k are related to thecoefficients ␣k Јand k Јof Eq.͑1͒through a 2P Sk rotationtransformation,i.e.,R (2P Sk )͕(␣Ј,Ј)͖→(␣,).The residual function calibration procedure relies on the fact that for a strongly absorbing isotropic sample measured at oblique incidence,the light beam reflected from thesample is linearly polarized only if the incident beam is lin-early polarized along the parallel (p)or perpendicular (s)directions with respect to the plane of incidence.14As the incident linear polarization is rotated away from these direc-tions,the reflected beam gradually acquires nonzero elliptic-ity.In the rotating polarizer configuration,a plot of the re-sidual function ͓see Eq.͑3͔͒versus the analyzer reading A yields minima in R (A )for A ϭA S ͑corresponding to the reading when the analyzer transmission axis lies in the p direction ͒and for A ϭA S ϩ/2͑corresponding to the reading when the analyzer transmission axis lies in the s direction ͒.The phase angle spectrum of the polarizer P Sk is obtained from the phase function which is defined by⌰͑A ͒ϭ͓tan Ϫ1͑Ј/␣Ј͔͒/2͑5a ͒ϭP Sk ϩ͕͓tan Ϫ1͑/␣͔͒/2͖͑5b ͒and evaluated at A ϭA S or A ϭA S ϩ/2to obtain the spectra in P Sk .In practice for higher accuracy,a second order poly-nomial fit to R (A )in the neighborhood of A ϭA S or A ϭA S ϩ/2is used ͑rather than the raw data ͒to determine the value of A ϭA S at which R (A )is a minimum.Similarly,a linear fit to ⌰(A )in the neighborhood of A ϭA S or A ϭA S ϩ/2is evaluated at A S to determine the spectrum in P Sk .For weakly absorbing materials,the residual function ap-proach fails and an alternative calibration method is pre-ferred.An effective alternative is based on the zone-difference phase function,defined by 20⌽͑A ͒ϵ⌰͑A ͒Ϫ⌰͑A ϩ/2͒.͑6͒The A -axis intercept of a linear fit to the experimental zone-difference phase function ⌽in the neighborhood of A ϭA S provides the value of A S .The P Sk spectrum can be obtained,as before,by evaluating the linear fit to the phase function Eqs.͑5͒at A S .The zone-difference phase function calibra-tion is most accurate for ͉⌬͉Ͻ30°or ͉⌬͉Ͼ150°,conditions found for weakly absorbing materials.An example of the zone-difference phase function method is presented in Fig.6for an optically polished glassy carbon sample.The results for A S and ␦P S are shown,where ␦P S represents the devia-tion of the experimental P Sk values from the best linearfitFIG.4.Image persistence correction factor ͑IPCF ͒measured independently from the ratio of the integrated irradiances between two successive readouts as a fast shutter is being closed ͑solid line ͒and from the residual function under the assumption that the departure from zero in the straight-through configuration is due solely to image persistence ͑points ͒.FIG.5.͑a ͒Residual function measurement after incorporation of the IPCF shown in Fig.4;͑b ͒measurement of a c -Si wafer with a 20Ånative oxide before ͑lines ͒and after ͑squares ͒incorporation of the IPCF in the data reduction.A uniform ͑8ϫ͒grouping mode wasused.FIG.6.Results of a zone-difference phase function calibration procedure for a bulk glassy carbon sample yielding the analyzer offset angle A S ͑i.e.,the analyzer scale reading when the transmission axis is aligned along the p direction ͒͑solid points ͒,and ͑ii ͒the deviation ␦P S in the polarizer phase angle from the best fitting linear function vs pixel number ͑open points ͒.3455Rev.Sci.Instrum.,Vol.71,No.9,September 2000Multichannel ellipsometerversus pixel number.Maximum deviations of 0.05°from the average values are obtained for both A S and ␦P S over the photon energy range from 2.0to 6.0eV.In summary,complete data analysis is performed as fol-lows.Once the ͕S jk ,j ϭ1,...,4͖values have been cor-rected using the IPCF as described in Sec.III B,the experi-mental values of the 2Fourier coefficients ␣k Јand k Јare obtained from Eqs.͑2͒.A rotation transformation by 2P Sk ,determined in the calibration,is used to calculate the phase corrected Fourier coefficients ␣k and k in Eq.͑4͒.Finally,spectra in the ellipsometric angles k and ⌬k are determined according totan k ϭ͓͑1ϩ␣k ͒/͑1Ϫ␣k ͔͒1/2͉tan ͑A ϪA S ͉͒,͑7a ͒cos ⌬k ϭk /͑1Ϫ␣k 2͒1/2,͑7b ͒where tan k exp(i ⌬k )ϭr pk /r sk ,with r pk and r sk denotingthe spectra in the complex amplitude reflection coefficients in the p and s directions.The indeterminate sign of ⌬k in Eq.7͑b ͒is inherent in rotating polarizer systems;a positive sign is chosen here for a bare substrate (⌬k Ͼ0).IV.RESULTS AND DISCUSSIONA.Multichannel ellipsometer performancePerformance characterization of the UV-extended multi-channel ellipsometer has been undertaken by assessing in-strument precision and accuracy.To obtain information on the instrument precision,100consecutive spectral measure-ments were collected separately for three different thermally oxidized Si wafers with stable oxide thicknesses of 121,991,and 1608Å.These thicknesses were chosen to provide com-posite spectra in the precision that avoid the regions ⌬ϳ0°or 180°and ϳ0°or 90°,where the precision is the poorest for the rotating-polarizer configuration.Figure 7shows a com-posite of the standard deviations in ͑,⌬͒,plotted as a func-tion of the photon energy using results from the three samples.The data in Fig.7are obtained as averages of 1and40polarizer rotations per consecutive spectral measurement,requiring 49ms ͑open symbols ͒and 1.96s ͑filled symbols ͒,respectively.It has been found that for the 40-rotation aver-ages the precision in ͑,⌬͒from 2.2to 6.2eV is near or below ͑0.01°,0.02°͒,corresponding to a sensitivity better than ϳ0.01monolayer.The highest precision of ͑0.004°,0.007°͒is obtained at the PDA output maximum at 5.2eV ͑see Fig.2͒.Even when the averaging is set at one polarizer rotation,which allows monolayer resolution at deposition rates as high as 50Å/s,the precision in ͑,⌬͒from 2.5to 6eV is near or below ͑0.05°,0.1°͒,i.e.,a sensitivity better than ϳ0.05monolayer.The first indication of accuracy is given by the residual function R measured in the straight-through configuration and presented in Fig.5͑a ͒.As described in Sec.III B,these results for R have been obtained using a pixel dependent image persistence correction factor.The maxi-mum R values of 6ϫ10Ϫ4after the correction correspond to maximum systematic errors in cos ⌬of 3ϫ10Ϫ3.This can lead to maximum inaccuracies in ⌬ranging from 0.17°for ⌬ϭ90°to ϳ3.5°for ⌬ϭ0°or 180°,where the rotating po-larizer configuration shows the highest and lowest accura-cies,respectively.The most significant random and uncorrected systematic errors were incorporated into the RTSE data analysis proce-dure through the biased estimator,given by2ϭ͓1/͑n Ϫm Ϫ1͔͚͒k ϭ1n͑k ,exp Ϫk ,cal ͒2/͑␦k ͒2,͑8͒where n ,m ,and k ,exp ͑cal ͒represent the number of data points,the number of parameters in the optical model of the sample,and the experimental ͑calculated ͒spectra,respec-tively.The quantity ␦k represents the estimated errors in the measurement of for pixel group k .The need of a biased estimator to weight more strongly the higher accuracy re-gions of the spectra in ex situ spectroscopic ellipsometry has been discussed in the literature.21Here we have propagated a number of errors through to k for the rotating polarizer configuration,including:͑i ͒the uncertainty in determining the analyzer offset A S and polarizer phase P Sk angles;͑ii ͒the fluctuations in the measured ͕S jk ,j ϭ1,...,4͖arising from fluctuations in the polarizer rotation frequency;and ͑iii ͒the noise in the detector dark current which is assumed to limit the precision of the measured S jk values.As discussed pre-viously,the remaining systematic errors are deemed to be of lesser significance once the image persistence has been taken into account.The uncertainties in A S and P Sk ͓i.e.,␦A S and ␦P S used to compute ␦k in Eq.͑8͔͒can be estimated from the ellipsometer calibration to be ϳ0.07°͑see Fig.6͒.Error ͑ii ͒is assumed to be proportional to the measured irradiance,and a proportionality constant of 0.005has been determined from measurements of the variations in the polarizer motor frequency.To estimate the error contribution from dark cur-rent noise,20consecutive spectra with the shutter closed are collected.Ideally,when the first spectrum is used to establish a background correction,all subsequent corrected spectra should be zero.However,a few counts are still detected due to thermally generated electron–hole pairs in thedepletionFIG.7.Standard deviation in 100consecutive measurements of the ͑,⌬͒spectra obtained as a composite of measurements on three c -Si wafers with different stable oxide thicknesses ͑121,991,and 1608Å͒.Each measure-ment is taken as an average over one polarizer rotation requiring 49ms ͑open symbols ͒and 40polarizer rotations requiring 1.96s ͑filled symbols ͒.3456Rev.Sci.Instrum.,Vol.71,No.9,September 2000Zapien,Collins,and Messier。
数字半导体测试基础英文版

常用半导体中英对照表离子注入机ion implanterLSS理论Lindhand Scharff and Schiott theory,又称“林汉德-斯卡夫-斯高特理论”。
沟道效应channeling effect射程分布range distribution深度分布depth distribution投影射程projected range阻止距离stopping distance阻止本领stopping power标准阻止截面standard stopping cross section 退火annealing激活能activation energy等温退火isothermal annealing激光退火laser annealing应力感生缺陷stress-induced defect 择优取向preferred orientation制版工艺mask-making technology 图形畸变pattern distortion初缩first minification精缩final minification母版master mask铬版chromium plate干版dry plate乳胶版emulsion plate透明版see-through plate高分辨率版high resolution plate, HRP超微粒干版plate for ultra-microminiaturization 掩模mask掩模对准mask alignment对准精度alignment precision光刻胶photoresist,又称“光致抗蚀剂”。
负性光刻胶negative photoresist正性光刻胶positive photoresist无机光刻胶inorganic resist多层光刻胶multilevel resist电子束光刻胶electron beam resist X射线光刻胶X-ray resist刷洗scrubbing甩胶spinning涂胶photoresist coating后烘postbaking光刻photolithographyX射线光刻X-ray lithography电子束光刻electron beam lithography 离子束光刻ion beam lithography深紫外光刻deep-UV lithography光刻机mask aligner投影光刻机projection mask aligner 曝光exposure接触式曝光法contact exposure method接近式曝光法proximity exposure method光学投影曝光法optical projection exposure method 电子束曝光系统electron beam exposure system分步重复系统step-and-repeat system显影development线宽linewidth去胶stripping of photoresist氧化去胶removing of photoresist by oxidation等离子[体]去胶removing of photoresist by plasma 刻蚀etching干法刻蚀dry etching反应离子刻蚀reactive ion etching, RIE各向同性刻蚀isotropic etching各向异性刻蚀anisotropic etching反应溅射刻蚀reactive sputter etching离子铣ion beam milling,又称“离子磨削”。
翻译

超声波探伤和分层特性在薄复合板中使用的信号处理技术摘要为了在多层薄复合板中的分层探测,两种不同的技术产生了,这种技术是基于窄带超声波回波从样品中反射的过程。
第一种方法利用无裂缝和分层区信号之间的差异,利用修改出现重复的将规范反褶积。
被过滤的A型显示器和二维C型显示器以不同的方式被制造。
第二种技术是基于一个光谱分析的微小信号样本,从被减少的参考信号中获得,被一个无裂缝区域反射,脉冲在不同的频率接收到任意点描述的二维的图像。
实验结果表明,这两种技术都是由层面板发生分层所决定的。
1997年爱斯维尔科技出版社。
关键词复合材料,超声波无损检测,超声波信号处理,超声波光谱学。
1、引言由于高可靠性和低成本,多层复合材料正交异性层合板广泛应用于许多先进的工业领域。
最重要的问题之一,仍然是有效的检测和在多层薄复合材料正交异性层合板发生的分层。
为了这个目的,各种超声波技术被开发。
他们中的大多数是基于所谓的直达传送器或脉冲回波技术,样品在试验中被超声波脉冲和透射波所辐射,对此进行了分析。
然而,在薄层合板的情况下,遇到了厚度低于超声波脉冲空间的长度的严重问题。
由于有限的带宽和非线性相位响应的常用的超声波检测设备,超声波脉冲在复合材料试件的反射情况的失真,导致了一个操作员彻底失败的掌握了分层信息。
这将通过两个仿真试验来证明。
一个可能的解决方案是使用宽带系统,例如,基于超声波传感器与非均匀特性或逆滤波,在纳秒范围内使其产生和检测脉冲短波。
这些拥有高空间的分辨率保证了薄复合层材料的探测。
然而,这些系统还不够普及,因此一个方法基于商业开发现有的设备和特殊的信号处理程序变得更具吸引力。
本文的目的是介绍信号处理算法能够有效的检测和表征薄膜多层复合材料的分层及获得中频超声信号常用的超声波仪器。
特别是,算法会利用改进的LI规范反褶积和频域成像进行分析。
算法被模拟信号和真正的信号所测试。
为了这个目的,基于一个矩阵的一维数学模型通过了实验的证实,并且被开发。
【精品】外文翻译-使用高光谱成像系统评估猪肉的质量和细脂肪纹路的水2

外文翻译-使用高光谱成像系统评估猪肉的质量和细脂肪纹路的水2使用高光谱成像系统评估猪肉的质量和大理石花纹的水平原文来源:Qiao Jun, Ngadi M O, Wang Ning, Gariepy C, Prasher S O. Pork quality and marbling level assessment using a hyperspectral imaging system. J Food Eng, 2007, 83: 10–16摘要评价猪肉品质通常主观地建立在颜色、大理石花纹和分泌特点的基础之上。
在这项研究中,,为了快速、准确并且客观地评估猪肉的质量,我们对一个基于高光谱成像的方法进行了评价。
此外,大理石花纹水平也被自动确定。
该系统提取出了猪肉样本的光谱特性,获得了猪肉的大理石花纹分布的适当的空间特征,对现有的大理石花纹标准进行了扫描,并且大理石花纹分数指标由共生矩阵来表达。
应用主成分分析(PCA)方法,压缩整个光谱波长的光(430nm–1000nm)到5、10、20主成分(pc),然后将其归属到质量组。
用人工神经网络对这些组进行分类。
结果表明,带红色、坚硬和无渗出物(RFN)的样本与带红色、柔软和有渗出物(RSE)的样本被成功地分组;总准确率为75%-80%。
由前馈神经网络模型归结了修正的类别;其中,5主成分为69%,10主成分为85%。
除了在10主成分里面,二阶矩角(ASM)被成功地用于决定猪肉的大理石花纹分数。
对40个样本加以分类,结果表明样品的大理石花纹分数从3.0到5.0不等。
2007年教育部博士点基金有限公司版权所有。
关键词:高光谱图像;猪肉质量;大理石花纹;主成分分析;聚类分析;神经网络1.前言加拿大是世界上最大的猪肉出口国之一。
随着市场的扩张与分割,为了保持领先地位,加拿大的加工行业需要用来评价猪肉品质的高效技术。
鲜猪肉质量变化极大。
传统上,猪肉质量过去常常根据颜色、纹理(坚实度)和分泌物(滴水损失)分为三个级别。
非均匀塞曼展宽英语
非均匀塞曼展宽英语Inhomogeneous Zeeman Broadening in Spectral AnalysisSpectral analysis plays a crucial role in variousscientific fields, including astrophysics, chemistry, and material science. One of the phenomena that can significantly affect the interpretation of spectral lines is Zeeman broadening, which arises due to the interaction between the magnetic field and the magnetic moment of the particles emitting the light. Inhomogeneous Zeeman broadening is a specific case where the broadening effect is not uniform across the entire spectral line.The inhomogeneous broadening occurs when there is aspatial variation in the magnetic field strength across the region of the emitting source. This can lead to a spread inthe energy levels of the emitting particles, which in turn causes a broadening of the spectral lines that is not uniform. The effect is particularly noticeable in stars, where the magnetic field can vary significantly from the surface to the core.To analyze the inhomogeneous Zeeman broadening, one must consider the distribution of the magnetic field within the emitting region. This can be complex, as it may involve turbulent fields, localized magnetic spots, or other non-uniformities. The spectral lines will be broadened todifferent extents depending on the local magnetic fieldstrength, leading to a complex profile that can be challenging to interpret.In the context of stellar atmospheres, the inhomogeneous broadening can be modeled using various techniques. One common approach is to use a magneto-optical model that takes into account the Hanle and Zeeman effects. These models can help in disentangling the effects of the magnetic field from other broadening mechanisms, such as thermal broadening or pressure broadening.The study of inhomogeneous Zeeman broadening is not only important for understanding the magnetic properties of celestial objects but also for diagnosing physical conditions such as temperature, density, and velocity fields within the emitting medium. Accurate measurements and analysis of this broadening can provide insights into the dynamics of stellar interiors and the behavior of plasmas in various astrophysical environments.In conclusion, inhomogeneous Zeeman broadening is a complex but important aspect of spectral analysis that can reveal valuable information about the magnetic fields and physical conditions of the sources under study. Advanced modeling and careful interpretation of the spectral data are essential for extracting meaningful physical parameters from the observed spectra.。
激光器中英文名词解释
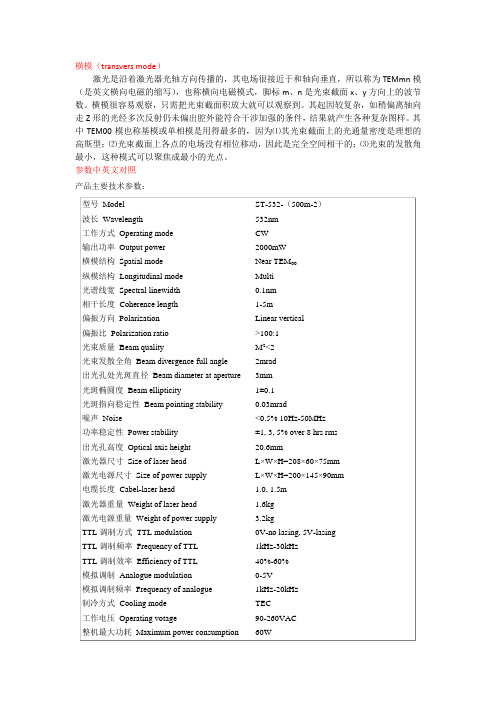
横模(transvers mode)
激光是沿着激光器光轴方向传播的,其电场很接近于和轴向垂直,所以称为TEMmn模(是英文横向电磁的缩写),也称横向电磁模式,脚标m、n是光束截面x、y方向上的波节数。
横模很容易观察,只需把光束截面积放大就可以观察到。
其起因较复杂,如稍偏离轴向走Z形的光经多次反射仍未偏出腔外能符合干涉加强的条件,结果就产生各种复杂图样。
其中TEM00模也称基模或单相模是用得最多的,因为⑴其光束截面上的光通量密度是理想的高斯型;⑵光束截面上各点的电场没有相位移动,因此是完全空间相干的;⑶光束的发散角最小,这种模式可以聚焦成最小的光点。
参数中英文对照
产品主要技术参数:。
- 1、下载文档前请自行甄别文档内容的完整性,平台不提供额外的编辑、内容补充、找答案等附加服务。
- 2、"仅部分预览"的文档,不可在线预览部分如存在完整性等问题,可反馈申请退款(可完整预览的文档不适用该条件!)。
- 3、如文档侵犯您的权益,请联系客服反馈,我们会尽快为您处理(人工客服工作时间:9:00-18:30)。
a r X i v :h e p -p h /0507323v 1 28 J u l 2005UWThPh-2005-12Isospin odd πK scattering lengthJ.SchweizerInstitut f¨u r Theoretische Physik,University of Vienna,A–1090Vienna,AustriaE-mail:julia.schweizer@univie.ac.at1IntroductionIn the sixties and seventies a set of experiments was performed on πK scat-tering [1].To obtain predictions for the low–energy parameters,the measured πK phases had to be extrapolated using dispersion relations and crossing symmetry [2],since the region of interest is not directly accessible by scat-tering experiments.The most precise values for the πK scattering lengths were obtained only recently from an analysis of Roy-Steiner equations [3,4].Alternatively,particular combinations of πK scattering lengths may be ex-tracted from experiments on πK atoms [5,6,7].The πK atom decays due to the strong interactions into π0K 0and a lifetime measurement will allow one todetermine the isospin odd S-wave πK scattering length a −0=1/3(a 1/20−a 3/20).Such a measurement is planned at CERN [8].Particularly interesting aboutthe isospin oddπK scattering length is that there exists a low–energy the-orem due to Roessl[9].Based on SU(2)chiral perturbation theory(CHPT) [9,10,11,12],where the strange quark mass is treated as a heavy partner,it is valid to all orders in powers of m s.It states that Weinberg’s current algebra result[13,14]receives corrections of order M2πonly,a−0=MπMK8πF2π(Mπ+MK) 1+δ(2)+δ(4)+O(p6) ,(2) where O(p6)={ˆm3,ˆm2m s,ˆmm2s}.The scattering length is expressed in termsof the physical meson masses Mπand MKand the physical pion decay constant Fπ[24].The next-to-leading order contributionδ(2)[16,17]depends on onesingle low–energy constant L r5[19]only,δ(2)=M2πµ2−3(2M2K−M2π)M2K−4M2K−M2π3M2π+MπM K3(4M2K−M2π))−¯J(uthr,M2K,1(2π)d(m21−q2)−1(m22−(p+q)2)−1.(4)Note that at the order considered it makes a difference whether we represent δ(2)as a function of the physical pion,kaon andηmasses or express one of them through the other two1.In Eq.(3),we choose to describeδ(2)in terms of the physical pion and kaon mass only,because this ensures that bothδ(2) andδ(4)are independently scale invariant.The two–loop order correction can be decomposed asδ(4)=δ(4)Li=C i=0+δ(4)1−loop Li+δ(4)Li L j+δ(4)Ci.(5)Thefirst term contains the two–loop functions,the second one–loop functions with insertions of O(p4)coupling constants and the last two terms consist of counter term contributions.Some of the two–loop functions inδ(4)Li=C i=0 are very demanding to analyze analytically.For the moment,we thus restrictourselves to the chiral double logs,δ(4)Li=C i=0=δ(4)log2+δ(4)rem,(6)and neglect the remainderδ(4)rem which is given numerically in Table2.In a first step,we extract the contributions from the p6low–energy constants(C r i) [23,25]from the representation of theπK scattering amplitude in Ref.[18],δ(4)Ci =16M2π1This will generate a correction proportional to∆GMO≡(4M2K−M2π−3M2η)/(M2η−M2π)[19]which contributes toδ(4).as well as products of two p4constants(L r i×L r j),δ(4)Li L j =64M2πL r5dµ=−1dµ=1dµ=−Γ(2)i2L(µ/µ0),C r i(µ)=C r i(µ0)−12 2Γ(1)i+Γ(L)i(µ0) L(µ/µ0),(11)with the chiral logarithmL(µ/µ0)=1µ20.(12)As a two–loop order quantityδ(4)consists ofδ(4)=ˆa(µ)+ i b i C r i(µ)+ i,j b ij L r i(µ)L r j(µ),(13)whereˆa(µ)is scale dependent and contains one–loop functions with insertions of p4constants as well as two–loop functions.In order to extract the dou-ble log and log×L r i contributions fromˆa(µ),we insert the solutions for the renormalized coupling constants into the latter equation,δ(4)=ˆa(µ0)+ i b i C r i(µ0)+ i,j b ij L r i(µ0)L r j(µ0),ˆa(µ0)=ˆa(µ)−12L(µ/µ0) b i 2Γ(1)i+Γ(L)i(µ0) −2b ijΓi L r j(µ0) .(14)Now,the scale dependence ofˆa(µ0)becomes apparent and we may read offthe wanted log2and log×L r i terms.The solutions of the renormalization group equations thus allow us to determine the double log and log×L r i contributions from Eqs.(7)and(8).The double chiral logs(log2)amount toδ(4) log2=M2π8+59M2π3F4π M2K[84L r1+114L r2+53L3−96L r4−28L r5+48(3L r6+L7+2L r8)]−M2π[12L r1+30L r2+19L3−64L r5+24(2L7+L r8)]}L(Mχ/µ).(16) Here Mχstands for a characteristic meson mass.In the remaining part of this section,we investigate Roessl’s low–energy the-orem[9]at next-to-next-to-leading order in SU(3)CHPT.More precisely,we specify the order M2πand order M4πcorrections to Eq.(1).To approach the SU(2)chiral expansion,we regard the kaon mass as heavy and expand a−0in powers of Mπ/M K,a−0=MπMKF2π 8L r5−1µ2+4ln M2π144π2 −12+10√2−7ln4Table 1Isospin odd scattering length a −0:CA current algebra value,SU(2)prediction [9],chiral SU(3)prediction at order p 4[16]and order p 6[18],dispersive analysis from Roy-Steiner equations [4].*Note that in Ref.[9]M π=137.5MeV and M K =495.5MeV,while all other references use M π.=M π+and M K .=M K +for the pion and kaon masses in the isospin symmetry limit.with insertions of p 4couplings in powers of M π/M K .We havec 2|1−loop L i =M 2K2[84L r 1+114L r 2+53L 3−96L r 4−28L r5+48(3L r 6+L 7+2L r 8)]lnM 2K27L 356√2−5ln43[L r 5−6(2L 7+L r8)] 13√2+2ln42L r 2+20458π2F 4π1µ2+4[8L r 1+12L r 2+6L 3−8L r4−9L r 5+6(2L r 6+L r 8)]lnM 2π281L 3−14152+49L 3−17L r 5+18(2L 7+L r 8)ln448L r 1+4L r 2−4106L r 5−67(2L 7+L r8),(20)where we have checked that the log ×L r i terms agree with Eq.(16).Here both the contributions to M 2πc 2and M 4πc 4are numerically sizeable,see Table 2.Table 2Numerical results for the p 6contributions at the scale µ=770MeV:⋆pure loop contributions and †resonance estimate are taken from Ref.[18].The notation is understood as in Eq.(5).For instance the contributions of the 1-loop ×L r i terms toδ(4)is given by δ(4)1−loop L i =0.013.3Numerical analysisIn the following,we present the numerical results for the partial p 6corrections to δ(4).The pion and kaon mass in the isospin symmetry limit are identifiedwith their charged masses M π.=M π+and M K .=M K +.To be consistent with the numerical analysis performed in Ref.[18],we use for the pion decay constant 2F π=92.4MeV.In Table 1,we list the various numerical results for a −0available in the literature.The first row contains the current algebra value,the next number is the SU(2)prediction at next-to-leading order [9],row three and four display the order p 4[16]and order p 6[18]SU(3)predictions and the last value is based on a phenomenological analysis from Roy-Steiner equations [4].As can be read off,the SU(3)prediction at order p 6is in good agreement with the Roy-Steiner value.The SU(3)chiral expansion of the scattering length a −0looks as follows8πF 2π(M π+M K )2Recently,a new value was obtained F π=92.2±0.2MeV [27].Table3Variations of the partial p6contributions toδ(4)for Mη≤µ≤770MeV(Mρ).More precisely,we display the difference∆δ(4)a=δ(4)a|µ=Mη−δ(4)a|µ=Mρ.For the notation, see Table2.10of Ref.[28].The double chiral logs are evaluated for a characteristic meson mass3Mχ=Mand the size of the remainderδ(4)rem is estimated by the use of KEq.(6).Row two and three of Table2contain the partial order p6corrections to the coefficients c2and c4,respectively.Note that for the double chiral logs as well as for the products of p4constants their contribution to c4can be neglected while for the one–loop functions with insertions of L r i’s,both M2πc2 and M4πc4are numerically sizeable.The enhancement of the coefficient c4is,see Eq.(20). mainly due the contributions proportional to ln Mπ/MKAs one can read offfrom Table2,more than half of the contributions to δ(4)=0.14stem from the resonance estimate for the p6constants which in-cludes effects of the lowest-lying vector and scalar resonances[18].We checked that with this procedure the meson resonance exchange contributions to C r15 and C r17vanish which implies that c4|C i is equal to zero.Further,for the combination of p6constants occurring in c2|C i,the contributions from scalar resonances do not play a dominant role:They amount to0.03of the0.08 generated by the C r i’s in total.It would be instructive to see whether these features persist in an improved estimate for the p6constants which respects the constraints that follow by imposing the proper asymptotic behaviour for massless QCD[29].The splitting of the order p6contributions in Table2is scale dependent. Table3displays the scale dependence of the various contributions toδ(4). The values for the1-loop×L r i,L r i×L r j and C r i terms at the scalesµ=770 MeV andµ=Mηallow us to read offthe scale dependence of the pure loop.contributionsδ(4)Li=C i=0Finally,we sum up the various SU(3)one-and two–loop contributions to c2,and c4and get for the expansion of a−0in powers of Mπ/MK)8πF2π(Mπ+MK3The choice Mχ=√Note that this decomposition is valid up to the contribution ofδ(4)rem=0.04 pared to the chiral SU(3)expansion in Eq.(21),the series in Mπ/MK converges much more rapidly.The correction M2πc2consists ofM2πc2=M2π(4πFπ)2β+··· ,(23)where the coefficientsαandβcontain the one–loop and two–loop contribu-tions,respectively.Numerically,we haveα=7.6,where the dominant part stems from the term proportional to ln Mπ/MKin Eq.(18).The contributions from double logs,1-loop×L i terms and p6constants toβare listed in Table 2.Here the bulk part comes from the resonance estimate for the p6constants [18].4ConclusionsIn the present work,we used the chiral two–loop representation for theπK amplitude available in the literature[18]to investigate the isospin odd S-wave scattering length a−0.This scattering length differs from other low–energy parameters inπK scattering in the sense that contributions of m s in the chiral expansion are suppressed by powers ofˆm.Based on SU(2)CHPT[9],there exists a low–energy theorem(1)which states that the current algebra result for a−0receives corrections of order M2πonly.It was therefore expected that the one–loop result[15,16,17]in SU(3)CHPT represents a decent estimate for the scattering length.However,the dispersive analysis from Roy-Steiner equations[4]and the chiral two–loop calculation[18]are not in agreement with this expectation.In fact,the numerical analysis performed in Ref.[18] showed that the two–loop order corrections to a−0are of the same order of magnitude as the one–loop contributions.In order to understand this rather substantial next-to-next-to-leading order correction,we determined analytically the contributions containing p6con-stants(7),products of two p4constants(8),double chiral logs(15)and single logarithms times p4constants(16).We further expanded the one–loop func-tions with insertions of p4constants in powers of Mπ/MK,see Eqs.(19)and(20).The expansion of the pure two–loop functions in powers of Mπ/MKwas beyond the scope of this work.The numerical values of the partial p6contri-butions are collected in Table2.In the remaining part of this work,we investigated the low–energy theorem for a−0at next-to-next-to-leading order in the SU(3)expansion.While it is true that the corrections are of order M2π,the chiral expansion of the accom-panying coefficient proceeds in powers of MKand is not protected againstsizeable contributions.At two–loop accuracy in the SU(3)expansion,the or-der M2πcorrection roughly amounts to about20%,see Eq.(22).Note that this number depends on the resonance estimate[18]for the p6constants.If we compare this result with Roessl’s value[9],the SU(2)prediction for the scattering length a−0seems to be underestimated.Atfirst surprisingly,we have to keep in mind that the numerical estimates for the low–energy constants in SU(2)CHPT were obtained through matching the scattering amplitude with the corresponding SU(3)CHPT result at one–loop order.It would be very in-teresting to estimate these low–energy constants using a resonance saturation approach in the context of SU(2)CHPT with strangeness number1. AcknowledgmentsIt is a pleasure to thank J.Gasser for many helpful comments and discussions. Further,I thank J.Bijnens,G.Ecker,R.Kaiser and P.Talavera for useful re-marks and discussions,and J.Bijnens for providing me with fortran programs for the two–loopπK scattering amplitude.This work was supported by the Swiss National Science Foundation.References[1]For a review,we refer to:ng,Fortsch.Phys.26(1978)509.[2] ng,Nuovo Cim.A41(1977)73;ng and W.Porod,Phys.Rev.D21(1980)1295;N.Johannesson and G.Nilsson,Nuovo Cim.A43(1978) 376;A.Karabarbounis and G.Shaw,J.Phys.G6,583(1980).[3] B.Ananthanarayan and P.Buettiker,Eur.Phys.J.C19(2001)517[arXiv:hep-ph/0012023].[4]P.Buettiker,S.Descotes-Genon and B.Moussallam,Eur.Phys.J.C33(2004)409[arXiv:hep-ph/0310283].[5]S.Deser,M.L.Goldberger,K.Baumann and W.Thirring,Phys.Rev.96(1954)774.[6]S.M.Bilenky,V.H.Nguyen,L.L.Nemenov and ebuchava,Yad.Fiz.10(1969)812;[7]J.Schweizer,Phys.Lett.B587(2004)33[arXiv:hep-ph/0401048];J.Schweizer,Eur.Phys.J.C36(2004)483[arXiv:hep-ph/0405034].[8] B.Adeva et al.,CERN-SPSC-2004-009;available at:http://dirac.web.cern.ch/DIRAC/future.html[9] A.Roessl,Nucl.Phys.B555(1999)507[arXiv:hep-ph/9904230].[10]S.Weinberg,PhysicaA96(1979)327.[11]J.Gasser and H.Leutwyler,Annals Phys.158,142(1984).[12]M.Frink, B.Kubis and U.G.Meissner,Eur.Phys.J.C25(2002)259[arXiv:hep-ph/0203193].[13]S.Weinberg,Phys.Rev.Lett.17(1966)616.[14]R.W.Griffith,Phys.Rev.176(1968)1705.[15]V.Bernard,N.Kaiser and U.G.Meissner,Nucl.Phys.B357(1991)129.[16]B.Kubis and U.G.Meissner,Phys.Lett.B529(2002)69[arXiv:hep-ph/0112154].[17]A.Nehme,Eur.Phys.J.C23(2002)707[arXiv:hep-ph/0111212].[18]J.Bijnens,P.Dhonte and P.Talavera,JHEP0405(2004)036[arXiv:hep-ph/0404150].[19]J.Gasser and H.Leutwyler,Nucl.Phys.B250(1985)465.[20]V.Bernard,N.Kaiser and U.G.Meissner,Nucl.Phys.B364(1991)283.[21]M.Jamin,J. A.Oller and A.Pich,Nucl.Phys.B587(2000)331[arXiv:hep-ph/0006045].[22]J.Sa Borges and F.R.A.Simao,Phys.Rev.D53(1996)4806;J.Sa Borges,J.Soares Barbosa and V.Oguri,Phys.Lett.B412(1997)389.[23]J.Bijnens,G.Colangelo and G.Ecker,Annals Phys.280(2000)100[arXiv:hep-ph/9907333].[24]G.Amoros,J.Bijnens and P.Talavera,Nucl.Phys.B568(2000)319[arXiv:hep-ph/9907264].[25]J.Bijnens,G.Colangelo and G.Ecker,JHEP9902(1999)020[arXiv:hep-ph/9902437].[26]M.Jamin,J. A.Oller and A.Pich,JHEP0402(2004)047[arXiv:hep-ph/0401080].[27]S.Descotes-Genon and B.Moussallam,arXiv:hep-ph/0505077.[28]G.Amoros,J.Bijnens and P.Talavera,Nucl.Phys.B602(2001)87[arXiv:hep-ph/0101127].[29]G.Ecker,J.Gasser,A.Pich and E.de Rafael,Nucl.Phys.B321(1989)311;G.Ecker,J.Gasser,H.Leutwyler, A.Pich and E.de Rafael,Phys.Lett.B223(1989)425;M.Knecht,B.Moussallam and J.Stern,Nucl.Phys.B429(1994)125[arXiv:hep-ph/9402318];M.Knecht and A.Nyffeler,Eur.Phys.J.C21(2001)659[arXiv:hep-ph/0106034];V.Cirigliano,G.Ecker, M.Eidemuller,R.Kaiser,A.Pich and J.Portoles,JHEP0504(2005)006 [arXiv:hep-ph/0503108].11。