modeling tabular data using conditional gan
SPSS术语中英文对照

SPSS术语中英文对照【常用软件】SPSS术语中英文对照Absolute deviation, 绝对离差Absolute number, 绝对数Absolute residuals, 绝对残差Acceleration array, 加速度立体阵Acceleration in an arbitrary direction, 任意方向上的加速度Acceleration normal, 法向加速度Acceleration space dimension, 加速度空间的维数Acceleration tangential, 切向加速度Acceleration vector, 加速度向量Acceptable hypothesis, 可接受假设Accumulation, 累积Accuracy, 准确度Actual frequency, 实际频数Adaptive estimator, 自适应估计量Addition, 相加Addition theorem, 加法定理Additivity, 可加性Adjusted rate, 调整率Adjusted value, 校正值Admissible error, 容许误差Aggregation, 聚集性Alternative hypothesis, 备择假设Among groups, 组间Amounts, 总量Analysis of correlation, 相关分析Analysis of covariance, 协方差分析Analysis of regression, 回归分析Analysis of time series, 时间序列分析Analysis of variance, 方差分析Angular transformation, 角转换ANOVA (analysis of variance), 方差分析ANOVA Models, 方差分析模型Arcing, 弧/弧旋Arcsine transformation, 反正弦变换Area under the curve, 曲线面积AREG , 评估从一个时间点到下一个时间点回归相关时的误差ARIMA, 季节和非季节性单变量模型的极大似然估计Arithmetic grid paper, 算术格纸Arithmetic mean, 算术平均数Arrhenius relation, 艾恩尼斯关系Assessing fit, 拟合的评估Associative laws, 结合律Asymmetric distribution, 非对称分布Asymptotic bias, 渐近偏倚Asymptotic efficiency, 渐近效率Asymptotic variance, 渐近方差Attributable risk, 归因危险度Attribute data, 属性资料Attribution, 属性Autocorrelation, 自相关Autocorrelation of residuals, 残差的自相关Average, 平均数Average confidence interval length, 平均置信区间长度Average growth rate, 平均增长率Bar chart, 条形图Bar graph, 条形图Base period, 基期Bayes' theorem , Bayes定理Bell-shaped curve, 钟形曲线Bernoulli distribution, 伯努力分布Best-trim estimator, 最好切尾估计量Bias, 偏性Binary logistic regression, 二元逻辑斯蒂回归Binomial distribution, 二项分布Bisquare, 双平方Bivariate Correlate, 二变量相关Bivariate normal distribution, 双变量正态分布Bivariate normal population, 双变量正态总体Biweight interval, 双权区间Biweight M-estimator, 双权M估计量Block, 区组/配伍组BMDP(Biomedical computer programs), BMDP统计软件包Boxplots, 箱线图/箱尾图Breakdown bound, 崩溃界/崩溃点Canonical correlation, 典型相关Caption, 纵标目Case-control study, 病例对照研究Categorical variable, 分类变量Catenary, 悬链线Cauchy distribution, 柯西分布Cause-and-effect relationship, 因果关系Cell, 单元Censoring, 终检Center of symmetry, 对称中心Centering and scaling, 中心化和定标Central tendency, 集中趋势Central value, 中心值CHAID -χ2 Automatic Interac tion Detector, 卡方自动交互检测Chance, 机遇Chance error, 随机误差Chance variable, 随机变量Characteristic equation, 特征方程Characteristic root, 特征根Characteristic vector, 特征向量Chebshev criterion of fit, 拟合的切比雪夫准则Chernoff faces, 切尔诺夫脸谱图Chi-square test, 卡方检验/χ2检验Choleskey decomposition, 乔洛斯基分解Circle chart, 圆图Class interval, 组距Class mid-value, 组中值Class upper limit, 组上限Classified variable, 分类变量Cluster analysis, 聚类分析Cluster sampling, 整群抽样Code, 代码Coded data, 编码数据Coding, 编码Coefficient of contingency, 列联系数Coefficient of determination, 决定系数Coefficient of multiple correlation, 多重相关系数Coefficient of partial correlation, 偏相关系数Coefficient of production-moment correlation, 积差相关系数Coefficient of rank correlation, 等级相关系数Coefficient of regression, 回归系数Coefficient of skewness, 偏度系数Coefficient of variation, 变异系数Cohort study, 队列研究Column, 列Column effect, 列效应Column factor, 列因素Combination pool, 合并Combinative table, 组合表Common factor, 共性因子Common regression coefficient, 公共回归系数Common value, 共同值Common variance, 公共方差Common variation, 公共变异Communality variance, 共性方差Comparability, 可比性Comparison of bathes, 批比较Comparison value, 比较值Compartment model, 分部模型Compassion, 伸缩Complement of an event, 补事件Complete association, 完全正相关Complete dissociation, 完全不相关Complete statistics, 完备统计量Completely randomized design, 完全随机化设计Composite event, 联合事件Composite events, 复合事件Concavity, 凹性Conditional expectation, 条件期望Conditional likelihood, 条件似然Conditional probability, 条件概率Conditionally linear, 依条件线性Confidence interval, 置信区间Confidence limit, 置信限Confidence lower limit, 置信下限Confidence upper limit, 置信上限Confirmatory Factor Analysis , 验证性因子分析Confirmatory research, 证实性实验研究Confounding factor, 混杂因素Conjoint, 联合分析Consistency, 相合性Consistency check, 一致性检验Consistent asymptotically normal estimate, 相合渐近正态估计Consistent estimate, 相合估计Constrained nonlinear regression, 受约束非线性回归Constraint, 约束Contaminated distribution, 污染分布Contaminated Gausssian, 污染高斯分布Contaminated normal distribution, 污染正态分布Contamination, 污染Contamination model, 污染模型Contingency table, 列联表Contour, 边界线Contribution rate, 贡献率Control, 对照Controlled experiments, 对照实验Conventional depth, 常规深度Convolution, 卷积Corrected factor, 校正因子Corrected mean, 校正均值Correction coefficient, 校正系数Correctness, 正确性Correlation coefficient, 相关系数Correlation index, 相关指数Correspondence, 对应Counting, 计数Counts, 计数/频数Covariance, 协方差Covariant, 共变Cox Regression, Cox回归Criteria for fitting, 拟合准则Criteria of least squares, 最小二乘准则Critical ratio, 临界比Critical region, 拒绝域Critical value, 临界值Cross-over design, 交叉设计Cross-section analysis, 横断面分析Cross-section survey, 横断面调查Crosstabs , 交叉表Cross-tabulation table, 复合表Cube root, 立方根Cumulative distribution function, 分布函数Cumulative probability, 累计概率Curvature, 曲率/弯曲Curvature, 曲率Curve fit , 曲线拟和Curve fitting, 曲线拟合Curvilinear regression, 曲线回归Curvilinear relation, 曲线关系Cut-and-try method, 尝试法Cycle, 周期Cyclist, 周期性D test, D检验Data acquisition, 资料收集Data bank, 数据库Data capacity, 数据容量Data deficiencies, 数据缺乏Data handling, 数据处理Data manipulation, 数据处理Data processing, 数据处理Data reduction, 数据缩减Data set, 数据集Data sources, 数据来源Data transformation, 数据变换Data validity, 数据有效性Data-in, 数据输入Data-out, 数据输出Dead time, 停滞期Degree of freedom, 自由度Degree of precision, 精密度Degree of reliability, 可靠性程度Degression, 递减Density function, 密度函数Density of data points, 数据点的密度Dependent variable, 应变量/依变量/因变量Dependent variable, 因变量Depth, 深度Derivative matrix, 导数矩阵Derivative-free methods, 无导数方法Design, 设计Determinacy, 确定性Determinant, 行列式Determinant, 决定因素Deviation, 离差Deviation from average, 离均差Diagnostic plot, 诊断图Dichotomous variable, 二分变量Differential equation, 微分方程Direct standardization, 直接标准化法Discrete variable, 离散型变量DISCRIMINANT, 判断Discriminant analysis, 判别分析Discriminant coefficient, 判别系数Discriminant function, 判别值Dispersion, 散布/分散度Disproportional, 不成比例的Disproportionate sub-class numbers, 不成比例次级组含量Distribution free, 分布无关性/免分布Distribution shape, 分布形状Distribution-free method, 任意分布法Distributive laws, 分配律Disturbance, 随机扰动项Dose response curve, 剂量反应曲线Double blind method, 双盲法Double blind trial, 双盲试验Double exponential distribution, 双指数分布Double logarithmic, 双对数Downward rank, 降秩Dual-space plot, 对偶空间图DUD, 无导数方法Duncan's new multiple range method, 新复极差法/Duncan新法Effect, 实验效应Eigenvalue, 特征值Eigenvector, 特征向量Ellipse, 椭圆Empirical distribution, 经验分布Empirical probability, 经验概率单位Enumeration data, 计数资料Equal sun-class number, 相等次级组含量Equally likely, 等可能Equivariance, 同变性Error, 误差/错误Error of estimate, 估计误差Error type I, 第一类错误Error type II, 第二类错误Estimand, 被估量Estimated error mean squares, 估计误差均方Estimated error sum of squares, 估计误差平方和Euclidean distance, 欧式距离Event, 事件Event, 事件Exceptional data point, 异常数据点Expectation plane, 期望平面Expectation surface, 期望曲面Expected values, 期望值Experiment, 实验Experimental sampling, 试验抽样Experimental unit, 试验单位Explanatory variable, 说明变量Exploratory data analysis, 探索性数据分析Explore Summarize, 探索-摘要Exponential curve, 指数曲线Exponential growth, 指数式增长EXSMOOTH, 指数平滑方法Extended fit, 扩充拟合Extra parameter, 附加参数Extrapolation, 外推法Extreme observation, 末端观测值Extremes, 极端值/极值F distribution, F分布F test, F检验Factor, 因素/因子Factor analysis, 因子分析Factor Analysis, 因子分析Factor score, 因子得分Factorial, 阶乘Factorial design, 析因试验设计False negative, 假阴性False negative error, 假阴性错误Family of distributions, 分布族Family of estimators, 估计量族Fanning, 扇面Fatality rate, 病死率Field investigation, 现场调查Field survey, 现场调查Finite population, 有限总体Finite-sample, 有限样本First derivative, 一阶导数First principal component, 第一主成分First quartile, 第一四分位数Fisher information, 费雪信息量Fitted value, 拟合值Fitting a curve, 曲线拟合Fixed base, 定基Fluctuation, 随机起伏Forecast, 预测Four fold table, 四格表Fourth, 四分点Fraction blow, 左侧比率Fractional error, 相对误差Frequency, 频率Frequency polygon, 频数多边图Frontier point, 界限点Function relationship, 泛函关系Gamma distribution, 伽玛分布Gauss increment, 高斯增量Gaussian distribution, 高斯分布/正态分布Gauss-Newton increment, 高斯-牛顿增量General census, 全面普查GENLOG (Generalized liner models), 广义线性模型Geometric mean, 几何平均数Gini's mean difference, 基尼均差GLM (General liner models), 一般线性模型Goodness of fit, 拟和优度/配合度Gradient of determinant, 行列式的梯度Graeco-Latin square, 希腊拉丁方Grand mean, 总均值Gross errors, 重大错误Gross-error sensitivity, 大错敏感度Group averages, 分组平均Grouped data, 分组资料Guessed mean, 假定平均数Half-life, 半衰期Hampel M-estimators, 汉佩尔M估计量Happenstance, 偶然事件Harmonic mean, 调和均数Hazard function, 风险均数Hazard rate, 风险率Heading, 标目Heavy-tailed distribution, 重尾分布Hessian array, 海森立体阵Heterogeneity, 不同质Heterogeneity of variance, 方差不齐Hierarchical classification, 组内分组Hierarchical clustering method, 系统聚类法High-leverage point, 高杠杆率点HILOGLINEAR, 多维列联表的层次对数线性模型Hinge, 折叶点Histogram, 直方图Historical cohort study, 历史性队列研究Holes, 空洞HOMALS, 多重响应分析Homogeneity of variance, 方差齐性Homogeneity test, 齐性检验Huber M-estimators, 休伯M估计量Hyperbola, 双曲线Hypothesis testing, 假设检验Hypothetical universe, 假设总体Impossible event, 不可能事件Independence, 独立性Independent variable, 自变量Index, 指标/指数Indirect standardization, 间接标准化法Individual, 个体Inference band, 推断带Infinite population, 无限总体Infinitely great, 无穷大Infinitely small, 无穷小Influence curve, 影响曲线Information capacity, 信息容量Initial condition, 初始条件Initial estimate, 初始估计值Initial level, 最初水平Interaction, 交互作用Interaction terms, 交互作用项Intercept, 截距Interpolation, 内插法Interquartile range, 四分位距Interval estimation, 区间估计Intervals of equal probability, 等概率区间Intrinsic curvature, 固有曲率Invariance, 不变性Inverse matrix, 逆矩阵Inverse probability, 逆概率Inverse sine transformation, 反正弦变换Iteration, 迭代Jacobian determinant, 雅可比行列式Joint distribution function, 分布函数Joint probability, 联合概率Joint probability distribution, 联合概率分布K means method, 逐步聚类法Kaplan-Meier, 评估事件的时间长度Kaplan-Merier chart, Kaplan-Merier图Kendall's rank correlation, Kendall等级相关Kinetic, 动力学Kolmogorov-Smirnove test, 柯尔莫哥洛夫-斯米尔诺夫检验Kruskal and Wallis test, Kruskal及Wallis检验/多样本的秩和检验/H检验Kurtosis, 峰度Lack of fit, 失拟Ladder of powers, 幂阶梯Lag, 滞后Large sample, 大样本Large sample test, 大样本检验Latin square, 拉丁方Latin square design, 拉丁方设计Leakage, 泄漏Least favorable configuration, 最不利构形Least favorable distribution, 最不利分布Least significant difference, 最小显著差法Least square method, 最小二乘法Least-absolute-residuals estimates, 最小绝对残差估计Least-absolute-residuals fit, 最小绝对残差拟合Least-absolute-residuals line, 最小绝对残差线Legend, 图例L-estimator, L估计量L-estimator of location, 位置L估计量L-estimator of scale, 尺度L估计量Level, 水平Life expectance, 预期期望寿命Life table, 寿命表Life table method, 生命表法Light-tailed distribution, 轻尾分布Likelihood function, 似然函数Likelihood ratio, 似然比line graph, 线图Linear correlation, 直线相关Linear equation, 线性方程Linear programming, 线性规划Linear regression, 直线回归Linear Regression, 线性回归Linear trend, 线性趋势Loading, 载荷Location and scale equivariance, 位置尺度同变性Location equivariance, 位置同变性Location invariance, 位置不变性Location scale family, 位置尺度族Log rank test, 时序检验Logarithmic curve, 对数曲线Logarithmic normal distribution, 对数正态分布Logarithmic scale, 对数尺度Logarithmic transformation, 对数变换Logic check, 逻辑检查Logistic distribution, 逻辑斯特分布Logit transformation, Logit转换LOGLINEAR, 多维列联表通用模型Lognormal distribution, 对数正态分布Lost function, 损失函数Low correlation, 低度相关Lower limit, 下限Lowest-attained variance, 最小可达方差LSD, 最小显著差法的简称Lurking variable, 潜在变量Main effect, 主效应Major heading, 主辞标目Marginal density function, 边缘密度函数Marginal probability, 边缘概率Marginal probability distribution, 边缘概率分布Matched data, 配对资料Matched distribution, 匹配过分布Matching of distribution, 分布的匹配Matching of transformation, 变换的匹配Mathematical expectation, 数学期望Mathematical model, 数学模型Maximum L-estimator, 极大极小L 估计量Maximum likelihood method, 最大似然法Mean, 均数Mean squares between groups, 组间均方Mean squares within group, 组内均方Means (Compare means), 均值-均值比较Median, 中位数Median effective dose, 半数效量Median lethal dose, 半数致死量Median polish, 中位数平滑Median test, 中位数检验Minimal sufficient statistic, 最小充分统计量Minimum distance estimation, 最小距离估计Minimum effective dose, 最小有效量Minimum lethal dose, 最小致死量Minimum variance estimator, 最小方差估计量MINITAB, 统计软件包Minor heading, 宾词标目Missing data, 缺失值Model specification, 模型的确定Modeling Statistics , 模型统计Models for outliers, 离群值模型Modifying the model, 模型的修正Modulus of continuity, 连续性模Morbidity, 发病率Most favorable configuration, 最有利构形Multidimensional Scaling (ASCAL), 多维尺度/多维标度Multinomial Logistic Regression , 多项逻辑斯蒂回归Multiple comparison, 多重比较Multiple correlation , 复相关Multiple covariance, 多元协方差Multiple linear regression, 多元线性回归Multiple response , 多重选项Multiple solutions, 多解Multiplication theorem, 乘法定理Multiresponse, 多元响应Multi-stage sampling, 多阶段抽样Multivariate T distribution, 多元T分布Mutual exclusive, 互不相容Mutual independence, 互相独立Natural boundary, 自然边界Natural dead, 自然死亡Natural zero, 自然零Negative correlation, 负相关Negative linear correlation, 负线性相关Negatively skewed, 负偏Newman-Keuls method, q检验NK method, q检验No statistical significance, 无统计意义Nominal variable, 名义变量Nonconstancy of variability, 变异的非定常性Nonlinear regression, 非线性相关Nonparametric statistics, 非参数统计Nonparametric test, 非参数检验Nonparametric tests, 非参数检验Normal deviate, 正态离差Normal distribution, 正态分布Normal equation, 正规方程组Normal ranges, 正常范围Normal value, 正常值Nuisance parameter, 多余参数/讨厌参数Null hypothesis, 无效假设Numerical variable, 数值变量Objective function, 目标函数Observation unit, 观察单位Observed value, 观察值One sided test, 单侧检验One-way analysis of variance, 单因素方差分析Oneway ANOVA , 单因素方差分析Open sequential trial, 开放型序贯设计Optrim, 优切尾Optrim efficiency, 优切尾效率Order statistics, 顺序统计量Ordered categories, 有序分类Ordinal logistic regression , 序数逻辑斯蒂回归Ordinal variable, 有序变量Orthogonal basis, 正交基Orthogonal design, 正交试验设计Orthogonality conditions, 正交条件ORTHOPLAN, 正交设计Outlier cutoffs, 离群值截断点Outliers, 极端值OVERALS , 多组变量的非线性正规相关Overshoot, 迭代过度Paired design, 配对设计Paired sample, 配对样本Pairwise slopes, 成对斜率Parabola, 抛物线Parallel tests, 平行试验Parameter, 参数Parametric statistics, 参数统计Parametric test, 参数检验Partial correlation, 偏相关Partial regression, 偏回归Partial sorting, 偏排序Partials residuals, 偏残差Pattern, 模式Pearson curves, 皮尔逊曲线Peeling, 退层Percent bar graph, 百分条形图Percentage, 百分比Percentile, 百分位数Percentile curves, 百分位曲线Periodicity, 周期性Permutation, 排列P-estimator, P估计量Pie graph, 饼图Pitman estimator, 皮特曼估计量Pivot, 枢轴量Planar, 平坦Planar assumption, 平面的假设PLANCARDS, 生成试验的计划卡Point estimation, 点估计Poisson distribution, 泊松分布Polishing, 平滑Polled standard deviation, 合并标准差Polled variance, 合并方差Polygon, 多边图Polynomial, 多项式Polynomial curve, 多项式曲线Population, 总体Population attributable risk, 人群归因危险度Positive correlation, 正相关Positively skewed, 正偏Posterior distribution, 后验分布Power of a test, 检验效能Precision, 精密度Predicted value, 预测值Preliminary analysis, 预备性分析Principal component analysis, 主成分分析Prior distribution, 先验分布Prior probability, 先验概率Probabilistic model, 概率模型probability, 概率Probability density, 概率密度Product moment, 乘积矩/协方差Profile trace, 截面迹图Proportion, 比/构成比Proportion allocation in stratified random sampling, 按比例分层随机抽样Proportionate, 成比例Proportionate sub-class numbers, 成比例次级组含量Prospective study, 前瞻性调查Proximities, 亲近性Pseudo F test, 近似F检验Pseudo model, 近似模型Pseudosigma, 伪标准差Purposive sampling, 有目的抽样QR decomposition, QR分解Quadratic approximation, 二次近似Qualitative classification, 属性分类Qualitative method, 定性方法Quantile-quantile plot, 分位数-分位数图/Q-Q图Quantitative analysis, 定量分析Quartile, 四分位数Quick Cluster, 快速聚类Radix sort, 基数排序Random allocation, 随机化分组Random blocks design, 随机区组设计Random event, 随机事件Randomization, 随机化Range, 极差/全距Rank correlation, 等级相关Rank sum test, 秩和检验Rank test, 秩检验Ranked data, 等级资料Rate, 比率Ratio, 比例Raw data, 原始资料Raw residual, 原始残差Rayleigh's test, 雷氏检验Rayleigh's Z, 雷氏Z值Reciprocal, 倒数Reciprocal transformation, 倒数变换Recording, 记录Redescending estimators, 回降估计量Reducing dimensions, 降维Re-expression, 重新表达Reference set, 标准组Region of acceptance, 接受域Regression coefficient, 回归系数Regression sum of square, 回归平方和Rejection point, 拒绝点Relative dispersion, 相对离散度Relative number, 相对数Reliability, 可靠性Reparametrization, 重新设置参数Replication, 重复Report Summaries, 报告摘要Residual sum of square, 剩余平方和Resistance, 耐抗性Resistant line, 耐抗线Resistant technique, 耐抗技术R-estimator of location, 位置R估计量R-estimator of scale, 尺度R估计量Retrospective study, 回顾性调查Ridge trace, 岭迹Ridit analysis, Ridit分析Rotation, 旋转Rounding, 舍入Row, 行Row effects, 行效应Row factor, 行因素RXC table, RXC表Sample, 样本Sample regression coefficient, 样本回归系数Sample size, 样本量Sample standard deviation, 样本标准差Sampling error, 抽样误差SAS(Statistical analysis system ), SAS统计软件包Scale, 尺度/量表Scatter diagram, 散点图Schematic plot, 示意图/简图Score test, 计分检验Screening, 筛检SEASON, 季节分析Second derivative, 二阶导数Second principal component, 第二主成分SEM (Structural equation modeling), 结构化方程模型Semi-logarithmic graph, 半对数图Semi-logarithmic paper, 半对数格纸Sensitivity curve, 敏感度曲线Sequential analysis, 贯序分析Sequential data set, 顺序数据集Sequential design, 贯序设计Sequential method, 贯序法Sequential test, 贯序检验法Serial tests, 系列试验Short-cut method, 简捷法Sigmoid curve, S形曲线Sign function, 正负号函数Sign test, 符号检验Signed rank, 符号秩Significance test, 显著性检验Significant figure, 有效数字Simple cluster sampling, 简单整群抽样Simple correlation, 简单相关Simple random sampling, 简单随机抽样Simple regression, 简单回归simple table, 简单表Sine estimator, 正弦估计量Single-valued estimate, 单值估计Singular matrix, 奇异矩阵Skewed distribution, 偏斜分布Skewness, 偏度Slash distribution, 斜线分布Slope, 斜率Smirnov test, 斯米尔诺夫检验Source of variation, 变异来源Spearman rank correlation, 斯皮尔曼等级相关Specific factor, 特殊因子Specific factor variance, 特殊因子方差Spectra , 频谱Spherical distribution, 球型正态分布Spread, 展布SPSS(Statistical package for the social science), SPSS统计软件包Spurious correlation, 假性相关Square root transformation, 平方根变换Stabilizing variance, 稳定方差Standard deviation, 标准差Standard error, 标准误Standard error of difference, 差别的标准误Standard error of estimate, 标准估计误差Standard error of rate, 率的标准误Standard normal distribution, 标准正态分布Standardization, 标准化Starting value, 起始值Statistic, 统计量Statistical control, 统计控制Statistical graph, 统计图Statistical inference, 统计推断Statistical table, 统计表Steepest descent, 最速下降法Stem and leaf display, 茎叶图Step factor, 步长因子Stepwise regression, 逐步回归Storage, 存Strata, 层(复数)Stratified sampling, 分层抽样Stratified sampling, 分层抽样Strength, 强度Stringency, 严密性Structural relationship, 结构关系Studentized residual, 学生化残差/t化残差Sub-class numbers, 次级组含量Subdividing, 分割Sufficient statistic, 充分统计量Sum of products, 积和Sum of squares, 离差平方和Sum of squares about regression, 回归平方和Sum of squares between groups, 组间平方和Sum of squares of partial regression, 偏回归平方和Sure event, 必然事件Survey, 调查Survival, 生存分析Survival rate, 生存率Suspended root gram, 悬吊根图Symmetry, 对称Systematic error, 系统误差Systematic sampling, 系统抽样Tags, 标签Tail area, 尾部面积Tail length, 尾长Tail weight, 尾重Tangent line, 切线Target distribution, 目标分布Taylor series, 泰勒级数Tendency of dispersion, 离散趋势Testing of hypotheses, 假设检验Theoretical frequency, 理论频数Time series, 时间序列Tolerance interval, 容忍区间Tolerance lower limit, 容忍下限Tolerance upper limit, 容忍上限Torsion, 扰率Total sum of square, 总平方和Total variation, 总变异Transformation, 转换Treatment, 处理Trend, 趋势Trend of percentage, 百分比趋势Trial, 试验Trial and error method, 试错法Tuning constant, 细调常数Two sided test, 双向检验Two-stage least squares, 二阶最小平方Two-stage sampling, 二阶段抽样Two-tailed test, 双侧检验Two-way analysis of variance, 双因素方差分析Two-way table, 双向表Type I error, 一类错误/α错误Type II error, 二类错误/β错误UMVU, 方差一致最小无偏估计简称Unbiased estimate, 无偏估计Unconstrained nonlinear regression , 无约束非线性回归Unequal subclass number, 不等次级组含量Ungrouped data, 不分组资料Uniform coordinate, 均匀坐标Uniform distribution, 均匀分布Uniformly minimum variance unbiased estimate, 方差一致最小无偏估计Unit, 单元Unordered categories, 无序分类Upper limit, 上限Upward rank, 升秩Vague concept, 模糊概念Validity, 有效性VARCOMP (Variance component estimation), 方差元素估计Variability, 变异性Variable, 变量Variance, 方差Variation, 变异Varimax orthogonal rotation, 方差最大正交旋转Volume of distribution, 容积W test, W检验Weibull distribution, 威布尔分布Weight, 权数Weighted Chi-square test, 加权卡方检验/Cochran检验Weighted linear regression method, 加权直线回归Weighted mean, 加权平均数Weighted mean square, 加权平均方差Weighted sum of square, 加权平方和Weighting coefficient, 权重系数Weighting method, 加权法W-estimation, W估计量W-estimation of location, 位置W估计量Width, 宽度Wilcoxon paired test, 威斯康星配对法/配对符号秩和检验Wild point, 野点/狂点Wild value, 野值/狂值Winsorized mean, 缩尾均值Withdraw, 失访Youden's index, 尤登指数Z test, Z检验Zero correlation, 零相关Z-transformation, Z变换。
高维时空数据的建模与统计推断, 英文
高维时空数据的建模与统计推断, 英文In the realm of data science, the modeling and statistical inference of high-dimensional spatiotemporal data present unique challenges and opportunities. This type of data, which encapsulates information across multiple dimensions and over time, offers a rich source of insights but also poses computational and analytical complexities. The key lies in developing effective techniques that can capture the intricate relationships and patterns inherent in these data, while also accounting for their inherent noise and uncertainty.在数据科学领域,高维时空数据的建模与统计推断既带来了独特的挑战,也提供了丰富的机遇。
这类数据涵盖了多个维度和时间的信息,提供了深入洞察的丰富资源,但同时也带来了计算和分析的复杂性。
关键在于开发有效的技术,这些技术既要能够捕捉数据中固有的复杂关系和模式,又要考虑其固有的噪声和不确定性。
To address these challenges, a multifaceted approach is necessary. On the modeling front, techniques such as dimensionality reduction and sparse modeling can help identify the most relevant features and reduce the computational burden. Machine learning algorithms, especially those designed for handling high-dimensional data, can also be leveraged to capture complex relationships and patterns.为了应对这些挑战,需要采取多方面的方法。
Geometric Modeling
Geometric ModelingGeometric modeling is a fundamental concept in computer graphics and design, playing a crucial role in various industries such as architecture, engineering, and entertainment. It involves creating digital representations of physical objects or environments using mathematical and computational techniques. Geometric modeling allows designers and engineers to visualize, analyze, and manipulate complex shapes and structures, leading to the development of innovative products and solutions. However, it also presents several challenges and limitations that need to be addressed to ensure its effectiveness and efficiency. One of the key challenges in geometric modeling is the accurate representation of real-world objects and environments. This requires the use of advanced mathematical algorithms and computational methods to capture the intricate details and complexities of physical entities. For example, creating a realistic 3D model of a human face or a natural landscape involves precise measurements, surface calculations, and texture mapping to achieve a lifelike appearance. This level of accuracy is essential in industries such as animation, virtual reality, and simulation, where visual realism is critical for creating immersive experiences. Another challenge in geometric modeling is the efficient manipulation and editing of geometric shapes. Designers and engineers often need to modify existing models or create new ones to meet specific requirements or constraints. This process can be time-consuming and labor-intensive, especially when dealing with large-scale or highly detailed models. As a result, there is a constant demand for more intuitive and user-friendly modeling tools that streamline the design process and enhance productivity. Additionally, the interoperability of geometric models across different software platforms and systems is a persistent issue that hinders seamless collaboration and data exchange. Moreover, geometric modeling also faces challenges in terms of computational resources and performance. Generating and rendering complex 3D models requires significant computing power and memory, which can limit the scalability and accessibility of geometric modeling applications. High-resolution models with intricate geometries may strain hardware capabilities and lead to slow processing times, making it difficult for designers and engineers to work efficiently. This is particularly relevant in industries such as gamingand virtual reality, where real-time rendering and interactive simulations are essential for delivering engaging and immersive experiences. Despite these challenges, geometric modeling continues to evolve and advance through technological innovations and research efforts. The development of advanced modeling techniques such as parametric modeling, procedural modeling, and non-uniform rational B-spline (NURBS) modeling has significantly improved the accuracy and flexibility of geometric representations. These techniques enable designersand engineers to create complex shapes and surfaces with greater precision and control, paving the way for more sophisticated and realistic virtual environments. Furthermore, the integration of geometric modeling with other disciplines such as physics-based simulation, material science, and machine learning has expanded its capabilities and applications. This interdisciplinary approach allows for the creation of interactive and dynamic models that accurately simulate physical behaviors and interactions, leading to more realistic and immersive experiences. For example, in the field of architecture and construction, geometric modeling combined with structural analysis and environmental simulation enables the design and evaluation of sustainable and resilient buildings and infrastructure. In conclusion, while geometric modeling presents several challenges and limitations, it remains an indispensable tool for innovation and creativity in various industries. The ongoing advancements in geometric modeling techniques and technologies continue to push the boundaries of what is possible, enabling designers and engineers to create increasingly realistic and complex digital representations of the physical world. As computational power and software capabilities continue to improve, the future of geometric modeling holds great promise for revolutionizing the way we design, visualize, and interact with the world around us.。
Workbench菜单选项中英文对照
1、ANSYS12。
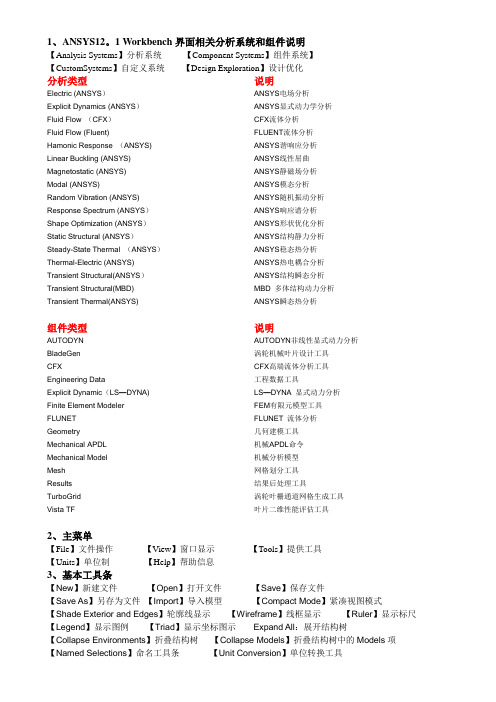
1 Workbench界面相关分析系统和组件说明【Analysis Systems】分析系统【Component Systems】组件系统】【CustomSystems】自定义系统【Design Exploration】设计优化分析类型说明Electric (ANSYS)ANSYS电场分析Explicit Dynamics (ANSYS)ANSYS显式动力学分析Fluid Flow (CFX)CFX流体分析Fluid Flow (Fluent) FLUENT流体分析Hamonic Response (ANSYS) ANSYS谐响应分析Linear Buckling (ANSYS) ANSYS线性屈曲Magnetostatic (ANSYS) ANSYS静磁场分析Modal (ANSYS) ANSYS模态分析Random Vibration (ANSYS) ANSYS随机振动分析Response Spectrum (ANSYS)ANSYS响应谱分析Shape Optimization (ANSYS)ANSYS形状优化分析Static Structural (ANSYS)ANSYS结构静力分析Steady-State Thermal (ANSYS)ANSYS稳态热分析Thermal-Electric (ANSYS) ANSYS热电耦合分析Transient Structural(ANSYS)ANSYS结构瞬态分析Transient Structural(MBD) MBD 多体结构动力分析Transient Thermal(ANSYS) ANSYS瞬态热分析组件类型说明AUTODYN AUTODYN非线性显式动力分析BladeGen 涡轮机械叶片设计工具CFX CFX高端流体分析工具Engineering Data 工程数据工具Explicit Dynamic(LS—DYNA) LS—DYNA 显式动力分析Finite Element Modeler FEM有限元模型工具FLUNET FLUNET 流体分析Geometry 几何建模工具Mechanical APDL 机械APDL命令Mechanical Model 机械分析模型Mesh 网格划分工具Results 结果后处理工具TurboGrid 涡轮叶栅通道网格生成工具Vista TF 叶片二维性能评估工具2、主菜单【File】文件操作【View】窗口显示【Tools】提供工具【Units】单位制【Help】帮助信息3、基本工具条【New】新建文件【Open】打开文件【Save】保存文件【Save As】另存为文件【Import】导入模型【Compact Mode】紧凑视图模式【Shade Exterior and Edges】轮廓线显示【Wireframe】线框显示【Ruler】显示标尺【Legend】显示图例【Triad】显示坐标图示Expand All:展开结构树【Collapse Environments】折叠结构树【Collapse Models】折叠结构树中的Models项【Named Selections】命名工具条【Unit Conversion】单位转换工具【Messages:Messages】信息窗口【Simulation Wizard】向导【Graphics Annotations】注释【Section Planes】截面信息窗口【Reset Layout】重新安排界面4、建模【Geometry】几何模型【New Geometry】新建几何模型【Details View】详细信息窗口【Graphics】图形窗口:显示当前模型状态【Extrude】拉伸【Revolve】旋转【Sweep】扫掠【Skin/Loft】蒙皮【Thin/Surface】抽壳:【Thin】创建薄壁实体【Surface】创建简化壳【Face to Remove】删除面:所选面将从体中删除。
ansysworkbench中英文对照
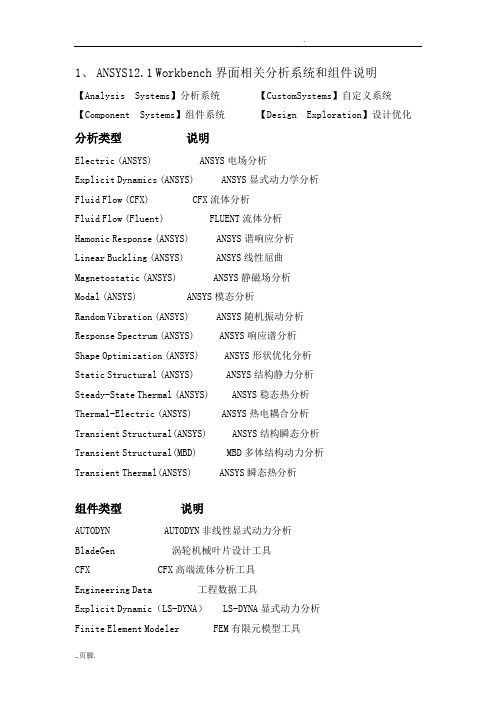
1、ANSYS12.1Workbench界面相关分析系统和组件说明【Analysis Systems】分析系统【Component Systems】组件系统【CustomSystems】自定义系统【Design Exploration】设计优化分析类型说明Electric(ANSYS)ANSYS电场分析Explicit Dynamics(ANSYS)ANSYS显式动力学分析Fluid Flow(CFX)CFX流体分析Fluid Flow(Fluent)FLUENT流体分析Hamonic Response(ANSYS)ANSYS谐响应分析Linear Buckling(ANSYS)ANSYS线性屈曲Magnetostatic(ANSYS)ANSYS静磁场分析Modal(ANSYS)ANSYS模态分析Random Vibration(ANSYS)ANSYS随机振动分析Response Spectrum(ANSYS)ANSYS响应谱分析Shape Optimization(ANSYS)ANSYS形状优化分析Static Structural(ANSYS)ANSYS结构静力分析Steady-State Thermal(ANSYS)ANSYS稳态热分析Thermal-Electric(ANSYS)ANSYS热电耦合分析Transient Structural(ANSYS)ANSYS结构瞬态分析Transient Structural(MBD)MBD多体结构动力分析Transient Thermal(ANSYS)ANSYS瞬态热分析组件类型说明AUTODYN AUTODYN非线性显式动力分析BladeGen涡轮机械叶片设计工具CFX CFX高端流体分析工具Engineering Data工程数据工具Explicit Dynamic(LS-DYNA)LS-DYNA显式动力分析Finite Element Modeler FEM有限元模型工具FLUNET FLUNET流体分析Geometry几何建模工具Mechanical APDL机械APDL命令Mechanical Model机械分析模型Mesh网格划分工具Results结果后处理工具TurboGrid涡轮叶栅通道网格生成工具Vista TF叶片二维性能评估工具2、主菜单【File】文件操作【View】窗口显示【Tools】提供工具【Units】单位制【Help】帮助信息3、基本工具条【New】新建文件【Open】打开文件【Save】保存文件【Save As】另存为文件【Import】导入模型【Compact Mode】紧凑视图模式【Shade Exterior and Edges】轮廓线显示【Wireframe】线框显示【Ruler】显示标尺【Legend】显示图例【Triad】显示坐标图示【Expand All】展开结构树【Collapse Environments】折叠结构树【Collapse Models】折叠结构树中的Models项【Named Selections】命名工具条【Unit Conversion】单位转换工具【Messages:Messages】信息窗口【Simulation Wizard】向导【Graphics Annotations】注释【Section Planes】截面信息窗口【Reset Layout】重新安排界面4、建模【Geometry】几何模型【New Geometry】新建几何模型【Details View】详细信息窗口【Graphics】图形窗口:显示当前模型状态【Extrude】拉伸【Revolve】旋转【Sweep】扫掠【Skin/Loft】蒙皮【Thin/Surface】抽壳: 【Thin】创建薄壁实体【Surface】创建简化壳【Face to Remove】删除面:所选面将从体中删除。
ANSYSfluent菜单中英文对照
1、ANSYS12.1Workbench界面相关分析系统和组件说明【AnalysisSystems】分析系统【ComponentSystems】组件系统【CustomSystems】自定义系统【DesignExploration】设计优化分析类型说明Electric(ANSYS)ANSYS电场分析ExplicitDynamics(ANSYS)ANSYS显式动力学分析FluidFlow(CFX)CFX流体分析FluidFlow(Fluent)FLUENT流体分析HamonicResponse(ANSYS)ANSYS谐响应分析LinearBuckling(ANSYS)ANSYS线性屈曲Magnetostatic(ANSYS)ANSYS静磁场分析Modal(ANSYS)ANSYS模态分析RandomVibration(ANSYS)ANSYS随机振动分析ResponseSpectrum(ANSYS)ANSYS响应谱分析ShapeOptimization(ANSYS)ANSYS形状优化分析StaticStructural(ANSYS)ANSYS结构静力分析Steady-StateThermal(ANSYS)ANSYS稳态热分析Thermal-Electric(ANSYS)ANSYS热电耦合分析TransientStructural(ANSYS)ANSYS结构瞬态分析TransientStructural(MBD)MBD多体结构动力分析TransientThermal(ANSYS)ANSYS瞬态热分析组件类型说明AUTODYNAUTODYN非线性显式动力分析BladeGen涡轮机械叶片设计工具CFXCFX高端流体分析工具EngineeringData工程数据工具ExplicitDynamicLS-DYNALS-DYNA显式动力分析FiniteElementModelerFEM有限元模型工具FLUNETFLUNET流体分析Geometry几何建模工具MechanicalAPDL机械APDL命令MechanicalModel机械分析模型Mesh网格划分工具Results结果后处理工具TurboGrid涡轮叶栅通道网格生成工具VistaTF叶片二维性能评估工具2、主菜单【File】文件操作【View】窗口显示【Tools】提供工具【Units】单位制【Help】帮助信息3、基本工具条【New】新建文件【Open】打开文件【Save】保存文件【SaveAs】另存为文件【Import】导入模型【CompactMode】紧凑视图模式【ShadeExteriorandEdges】轮廓线显示【Wireframe】线框显示【Ruler】显示标尺【Legend】显示图例【Triad】显示坐标图示【ExpandAll】展开结构树【CollapseEnvironments】折叠结构树【CollapseModels】折叠结构树中的Models项【NamedSelections】命名工具条【UnitConversion】单位转换工具【MessagesMessages】信息窗口【SimulationWizard】向导【GraphicsAnnotations】注释【SectionPlanes】截面信息窗口【ResetLayout】重新安排界面4、建模【Geometry】几何模型【NewGeometry】新建几何模型【DetailsView】详细信息窗口【Graphics】图形窗口显示当前模型状态【Extrude】拉伸【Revolve】旋转【Sweep】扫掠【Skin/Loft】蒙皮【Thin/Surface】抽壳:【Thin】创建薄壁实体【Surface】创建简化壳【FacetoRemove】删除面所选面将从体中删除。
practical multilevel modeling using r pdf

practical multilevel modeling using rpdfPractical Multilevel Modeling (MLM) using R is an essential tool for data scientists looking to gain a better understanding of their data. With the ability to generate predictions, evaluate trends and detect correlations, MLM can provide an invaluable tool to analyse large datasets in an efficient manner.MLM is a type of linear regression that takes into account the hierarchical structure of the data. It allows for multiple levels of analysis, such as individual-level variables, group-level variables and even cross-level variables. This makes it possible to examine how group-level variables influence individual-level behaviour. For example, in education research, MLM can be used to explore how school-level factors interact with learner-level behaviour.Using R to conduct multilevel analyses is relatively straightforward. First, it is important to understand the key concepts of MLM and obtain an overview of the dataset. The next step is to load the data into R and check for missing or invalid values and prepare the data for analysis. Then, the MLM model and its associated parameters must be specified and estimated, after which the results can be visualised and interpreted. Further, post hoc tests can be performed to further investigate the relationships between variables.In addition to the basic MLM, there are also several other extensions that can be employed to extract additionalinformation from the data. This includes mixed-effects models, which allow for both fixed and random effects to be includedin the analysis, and nonlinear mixed-effects models, whichcan be used to fit more complex and nonlinear models.MLM is an incredibly useful tool for data analysts andit offers a wealth of opportunities for better understandingof data. By using R, data scientists can easily access the capabilities of MLM, allowing them to unlock insights from large and complex datasets.。
ansysworkbench菜单选项中英文对照翻译
ansys Workbench;菜单选项中英文对照1、 Workbench 界面相关分析系统和组件说明【Analysis Systems】分析系统【Component Systems】组件系统】【CustomSystems 】自定义系统【Design Exploration】设计优化分析类型Electric (ANSYS)Explicit Dynamics (ANSYS)Fluid Flow (CFX)Fluid Flow (Fluent)Hamonic Response (ANSYS)Linear Buckling (ANSYS)Magnetostatic (ANSYS)Modal (ANSYS)Random Vibration (ANSYS)Response Spectrum (ANSYS)Shape Optimization (ANSYS)Static Structural (ANSYS)Steady-State Thermal (ANSYS)Thermal-Electric (ANSYS)Transient Structural(ANSYS)Transient Structural(MBD)Transient Thermal(ANSYS)说明ANSYS 电场分析 ANSYS 显式动力学分析 CFX 流体分析 FLUENT 流体分析ANSYS 谐响应分析 ANSYS 线性屈曲 ANSYS 静磁场分析 ANSYS 模态分析 ANSYS 随机振动分析 ANSYS 响应谱分析 ANSYS 形状优化分析 ANSYS 结构静力分析ANSYS 稳态热分析 ANSYS 热电耦合分析 ANSYS 结构瞬态分析 MBD 多体结构动力分析 ANSYS 瞬态热分析组件类型AUTODYNBladeGenCFXEngineering DataExplicit Dynamic(LS-DYNA )Finite Element ModelerFLUNETGeometryMechanical APDLMechanical ModelMeshResultsTurboGridVista TF说明AUTODYN 非线性显式动力分析涡轮机械叶片设计工具 CFX 高端流体分析工具工程数据工具 LS-DYNA显式动力分析 FEM 有限元模型工具FLUNET流体分析几何建模工具机械APDL 命令机械分析模型网格划分工具结果后处理工具涡轮叶栅通道网格生成工具叶片二维性能评估工具2、主菜单【File 】文件操作【V iew 】窗口显示【Tools 】提供工具【Units 】单位制【Help 】帮助信息3、基本工具条【New 】新建文件【Open 】打开文件【Save 】保存文件【Save As】另存为文件【Import 】导入模型【Compact Mode】紧凑视图模式【Shade Exterior and Edges】轮廓线显示【Wireframe 】线框显示【Ruler 】显示标尺【Legend 】显示图例【Triad 】显示坐标图示 Expand All:展开结构树【Collapse Environments】折叠结构树【Collapse Models】折叠结构树中的Models 项【Named Selections】命名工具条【Unit Conversion】单位转换工具【Messages :Messages 】信息窗口【Simulation Wizard】向导【Graphics Annotations】注释【Section Planes】截面信息窗口【Reset Layout】重新安排界面4、建模【Geometry 】几何模型【New Geometry】新建几何模型【Details View】详细信息窗口【Graphics 】图形窗口:显示当前模型状态【Extrude 】拉伸【Revolve 】旋转【Sweep 】扫掠【Skin/Loft】蒙皮【Thin/Surface】抽壳:【Thin 】创建薄壁实体【Surface 】创建简化壳【Face to Remove】删除面:所选面将从体中删除。
- 1、下载文档前请自行甄别文档内容的完整性,平台不提供额外的编辑、内容补充、找答案等附加服务。
- 2、"仅部分预览"的文档,不可在线预览部分如存在完整性等问题,可反馈申请退款(可完整预览的文档不适用该条件!)。
- 3、如文档侵犯您的权益,请联系客服反馈,我们会尽快为您处理(人工客服工作时间:9:00-18:30)。
Modeling Tabular Data Using Conditional GANIntroductionIn recent years, the generation and analysis of tabular data has gained substantial attention in the field of machine learning and data science. Tabular data, which consists of rows and columns, is commonly used to represent structured information such as customer records, financial transactions, and sensor readings. Traditional statistical and machine learning models have been widely used for modeling and analyzing tabular data. However, these models often assume linear relationships and have limitations in capturing complex patterns and dependencies within the data. In this article, we will explore the use of Conditional Generative Adversarial Networks (CGANs) for modeling tabular data, providing a powerful and flexible approach to simulate, generate, and analyze structured data.What is a Generative Adversarial Network (GAN)?A Generative Adversarial Network (GAN) is a type of deep learning model consisting of two components: a generator and a discriminator. The generator takes random noise as input and generates synthetic data, while the discriminator evaluates whether the generated data is real or fake. The generator and discriminator are trained together in a competitive manner, with the generator aiming to fool the discriminator and the discriminator trying to distinguish between real and fake data. Through this adversarial training process, the generator gradually improves its ability to generate realistic data that isindistinguishable from the real data.Conditional Generative Adversarial Networks (CGANs)Conditional Generative Adversarial Networks (CGANs) extend the basic GAN architecture by introducing conditional information. In the case of tabular data, this conditional information could be additionalattributes or labels associated with each data point. By conditioning the generator on specific input conditions, CGANs are capable ofgenerating data that corresponds to the given conditions. This makes CGANs well-suited for tasks such as data augmentation, missing value imputation, and synthetic data generation.Architecture of CGANGeneratorThe generator in a CGAN takes both random noise and conditional information as input. It consists of multiple layers of neural networks, typically implemented using fully connected layers. The last layer of the generator outputs the generated data, which should match the structure and distribution of the real data. To ensure the generated data is conditioned on the given input, the conditional information is usually concatenated with the noise input at each layer of the generator.DiscriminatorThe discriminator in a CGAN also takes both real and generated data as input, along with the corresponding conditional information. The discriminator’s role is to distinguish real data from generated data. Similar to the generator, the discriminator is implemented using neural networks with fully connected layers. The last layer of thediscriminator outputs a probability score, indicating the likelihood of the input being real or fake. The discriminator is trained using both real and generated data, adjusting its parameters to improve its ability to distinguish between the two.Training ProcedureThe training of a CGAN involves an adversarial process where the generator and discriminator are trained iteratively. The generator first generates synthetic data conditioned on the input conditions. This generated data, along with the real data and corresponding conditions, are fed into the discriminator for evaluation. The generator’sobjective is to produce synthetic data that the discriminator cannot distinguish from real data. Conversely, the discriminator’s objectiveis to accurately classify real and fake data. This adversarial trainingprocess continues until both the generator and discriminator reach a stable equilibrium.Applications of CGANs for Tabular Data ModelingData AugmentationOne of the main applications of CGANs in tabular data modeling is data augmentation. Data augmentation refers to the process of expanding the size of the training dataset by generating new synthetic samples. By conditioning the generator on the existing data and additional attribute or label information, CGANs can generate realistic synthetic data that captures the underlying patterns and distributions of the original data. This augmented data can then be used to improve the performance of traditional machine learning models by providing more diverse and representative examples.Missing Value ImputationIn many real-world datasets, missing values are a common issue that can affect the performance of machine learning models. CGANs can be leveraged to impute missing values by conditioning the generator on the available attributes or labels and generating synthetic values for the missing entries. By capturing the dependencies and patterns present in the data, CGANs can generate realistic imputations that preserve the overall characteristics of the dataset. This allows for more accurate analysis and modeling of the data.Synthetic Data GenerationCGANs can also be used to generate entirely synthetic datasets that follow the same patterns and distributions as the real data. This can be particularly useful in scenarios where access to real data is limited due to privacy concerns or other constraints. By conditioning the generator on the desired attributes or labels, CGANs can produce synthetic datasets that mimic the characteristics of the real data. These synthetic datasets can then be used for various purposes, such as training machine learning models, conducting simulations, or performing sensitivity analyses.Outlier DetectionAnother application of CGANs in tabular data modeling is outlier detection. Outliers are data points that deviate significantly from the majority of the data and can have a substantial impact on the results of data analysis and modeling. CGANs can be trained to learn the underlying patterns and distributions of the data, making them capable of identifying unusual patterns or data points that do not conform to these patterns. By comparing the generated data with the real data, the discriminator can help identify potential outliers or anomalous data points.Advantages and Limitations of CGANs for Tabular Data ModelingAdvantages•CGANs provide a flexible and powerful approach to model and analyze tabular data, capturing complex patterns and dependencies that traditional models may struggle to capture.•By conditioning the generator on specific input conditions, CGANs can generate data that corresponds to those conditions, enablingvarious applications such as data augmentation, missing valueimputation, and synthetic data generation.•CGANs can generate realistic synthetic data that can be used to expand the training dataset, improve model performance, andaddress privacy concerns.•The adversarial training process of CGANs allows for the generation of data that closely matches the distribution andcharacteristics of the real data, leading to more accurateanalysis and modeling results.Limitations•CGANs require large amounts of data for training, as well as careful tuning of hyperparameters to ensure stable and meaningful results.•The quality and fidelity of the generated data heavily depend on the architecture and training procedure of the CGAN. If thegenerator or discriminator are not well-designed, the generateddata may not accurately represent the real data.•CGANs may struggle with generating rare or uncommon data points, as they are not often observed in the training data and may not be well-represented in the generated samples.•The interpretation of the generated data can be challenging, as it does not originate from real observations and may not reflect the true underlying processes and mechanisms present in the data.ConclusionConditional Generative Adversarial Networks (CGANs) provide a powerful and flexible approach for modeling and analyzing tabular data. By conditioning the generator on specific input conditions, CGANs can generate realistic synthetic data that captures the underlying patterns and dependencies of the real data. This opens up various applications in data augmentation, missing value imputation, synthetic data generation, and outlier detection. Despite some limitations, CGANs offer a promising solution to the challenges associated with modeling tabular data and can provide valuable insights for decision-making and analysis in various domains.。