国际经济学题库(克鲁格曼版)经_2
克鲁格曼《国际经济学》第八版课后答案(英文)-Ch02.doc
Chapter 2World Trade: An Overview⏹Chapter OrganizationWho Trades with Whom?Size Matters: the Gravity ModelThe Logic of the Gravity ModelUsing the Gravity Model: Looking for AnomaliesImpediments to Trade: Distance, Barriers, and BordersThe Changing Pattern of World TradeHas the World Gotten SmallerWhat Do We Trade?Service OutsourcingDo Old Rules Still Apply?Summary⏹Key ThemesBefore entering into a series of theoretical models that explain why countries trade across borders and the benefits of this trade (Chapters 3–11), Chapter 2 considers the pattern of world trade which we observe today. The core idea of the chapter is the empirical model known as the gravity model. The gravity model is based on the observations that: (1) countries tend to trade with other nearby economies and (2) countries’ trade is proportional to their size. The model is called the gravity model as it is similar in form to the physics equation that describes the pull of one body on another as proportional to their size and distance.The basic form of the gravity equation is T ij=A⨯Y i⨯Y j/D ij. The logic supporting this equation is that large countries have large incomes to spend on imports and produce a large quantity of goods to sell as exports. This means that the larger either trade partner, the larger the volume of trade between them. At the same time, the distance between two trade partners can substitute for the transport costs that they face as well as proxy for more intangible aspects of a trading relationship such as the ease of contact for firms. This model can be used to estimate the predicted trade between two countries and look for anomalies in trade patterns. The text shows an example where the gravity model can be used to demonstrate the importance of national borders in determining trade flows. According to many estimates, the border between the U.S. and Canada has the impact on trade equivalent to roughly 2000 miles of distance. Other factors, such as tariffs, trade agreements, and common language can all affect trade and can be incorporated into the gravity model.The chapter also considers the way trade has evolved over time. While people often feel that the modern era has seen unprecedented globalization, in fact, there is precedent. From the end of the 19th century to World War I, the economies of different countries were quite connected. Trade as a share of GDP was higher in 1910 than 1960, and only recently have trade levels surpassed the pre World War trade. The nature of trade has change though. The majority of trade is in manufactured goods with agriculture and mineral products (and oil) making up less than 20% of world trade. Even developing countries now export primarily manufactures. In contrast, a century ago, more trade was in primary products as nations tended to trade for things that literally could not be grown or found at home. Today, the reasons for trade are more varied and the products we trade are ever changing (for example, the rise in trade of things like call centers). Th e chapter concludes by focusing on one particular expansion of what is “tradable”—the increase in services trade. Modern information technology has greatly expanded what can be traded as the person staffing a call center, doing your accounting, or reading your X-ray can literally be half-way around the world. While still relatively rare, the potential for a large increase in service outsourcing is an important part of how trade will evolve in the coming decades. The next few chapters will explain the theory of why nations trade.Answers to Textbook Problems1. We saw that not only is GDP important in explaining how much two countries trade, but also,distance is crucial. Given its remoteness, Australia faces relatively high costs of transporting imports and exports, thereby reducing the attractiveness of trade. Since Canada has a border with a largeeconomy (the U.S.) and Australia is not near any other major economy, it makes sense that Canada would be more open and Australia more self-reliant.2. Mexico is quite close to the U.S., but it is far from the European Union (EU). So it makes sense thatit trades largely with the U.S. Brazil is far from both, so its trade is split between the two. Mexico trades more than Brazil in part because it is so close to a major economy (the U.S.) and in partbecause it is a member of a free trade agreement with a large economy (NAFTA). Brazil is farther away from any large economy and is in a free trade agreement with relatively small countries.3. No, if every country’s GDP were to double, world trade would not quadruple. One way to see thisusing the example from Table 2-2 would simply be to quadruple all the trade flows in 2-2 and also double the GDP in 2-1. We would see that the first line of Table 2-2 would be—, 6.4, 1.6, 1.6. If that were true, Country A would have exported $8 trillion which is equal to its entire GDP. Likewise, it would have imported $8 trillion, meaning it had zero spending on its own goods (highly unlikely). If instead we filled in Table 2-2 as before, by multiplying the appropriate shares of the world economy times a country’s GDP, we would see the first line of Table 2-2 reads—, 3.2, 0.8, 0.8. In this case, 60% of Country A’s GDP is exported, the same as before. The logic is that while the world G DP has doubled, increasing the likelihood of international trade, the local economy has doubled, increasing the likelihood of domestic trade. The gravity equation still holds. If you fill in the entire table, you will see that where before the equation was 0.1 ⨯ GDP i⨯ GDP j, it now is 0.05 ⨯ GDP i⨯ GDP j. The coefficient on each GDP is still one, but the overall constant has changed.4. As the share of world GDP which belongs to East Asian economies grows, then in every traderelationship which involves an East Asian economy, the size of the East Asian economy has grown.This makes the trade relationships with East Asian countries larger over time. The logic is similar for why the countries trade more with one another. Previously, they were quite small economies, meaning that their markets were too small to import a substantial amount. As they became morewealthy and the consumption demands of their populace rose, they were each able to importmore. Thus, while they previously had focused their exports to other rich nations, over time, they became part of the rich nation club and thus were targets for one another’s exports. Again, using the gravity model, when South Korea and Taiwan were both small, the product of their GDPs was quite small, meaning despite their proximity, there was little trade between them. Now that they have both grown considerably, their GDPs predict a considerable amount of trade.5. As the chapter discusses, a century ago, much of world trade was in commodities that in many wayswere climate or geography determined. Thus, the UK imported goods that it could not make itself.This meant importing things like cotton or rubber from countries in the Western Hemisphere or Asia.As the UK’s climate and natural resource endowments were fairly similar to those in the rest of Europe, it had less of a need to import from other European countries. In the aftermath of the IndustrialRevolution, where manufacturing trade accelerated and has continued to expand with improvements in transportation and communications, it is not surprising that the UK would turn more to the nearby and large economies in Europe for much of its trade. This is a direct prediction of the gravity model.。
国际经济学克鲁格曼课后习题答案章完整版

国际经济学克鲁格曼课后习题答案章集团标准化办公室:[VV986T-J682P28-JP266L8-68PNN]第一章练习与答案1.为什么说在决定生产和消费时,相对价格比绝对价格更重要?答案提示:当生产处于生产边界线上,资源则得到了充分利用,这时,要想增加某一产品的生产,必须降低另一产品的生产,也就是说,增加某一产品的生产是有机会机本(或社会成本)的。
生产可能性边界上任何一点都表示生产效率和充分就业得以实现,但究竟选择哪一点,则还要看两个商品的相对价格,即它们在市场上的交换比率。
相对价格等于机会成本时,生产点在生产可能性边界上的位置也就确定了。
所以,在决定生产和消费时,相对价格比绝对价格更重要。
2.仿效图1—6和图1—7,试推导出Y商品的国民供给曲线和国民需求曲线。
答案提示:3.在只有两种商品的情况下,当一个商品达到均衡时,另外一个商品是否也同时达到均衡?试解释原因。
答案提示:4.如果生产可能性边界是一条直线,试确定过剩供给(或需求)曲线。
答案提示:5.如果改用Y商品的过剩供给曲线(B国)和过剩需求曲线(A国)来确定国际均衡价格,那么所得出的结果与图1—13中的结果是否一致?6.答案提示:国际均衡价格将依旧处于贸易前两国相对价格的中间某点。
7.说明贸易条件变化如何影响国际贸易利益在两国间的分配。
答案提示:一国出口产品价格的相对上升意味着此国可以用较少的出口换得较多的进口产品,有利于此国贸易利益的获得,不过,出口价格上升将不利于出口数量的增加,有损于出口国的贸易利益;与此类似,出口商品价格的下降有利于出口商品数量的增加,但是这意味着此国用较多的出口换得较少的进口产品。
对于进口国来讲,贸易条件变化对国际贸易利益的影响是相反的。
8.如果国际贸易发生在一个大国和一个小国之间,那么贸易后,国际相对价格更接近于哪一个国家在封闭下的相对价格水平?答案提示:贸易后,国际相对价格将更接近于大国在封闭下的相对价格水平。
克鲁格曼《国际经济学》(国际金融)习题标准答案要点

克鲁格曼《国际经济学》(国际金融)习题答案要点————————————————————————————————作者:————————————————————————————————日期:23 《国际经济学》(国际金融)习题答案要点第12章 国民收入核算与国际收支1、如问题所述,GNP 仅仅包括最终产品和服务的价值是为了避免重复计算的问题。
在国民收入账户中,如果进口的中间品价值从GNP 中减去,出口的中间品价值加到GNP 中,重复计算的问题将不会发生。
例如:美国分别销售钢材给日本的丰田公司和美国的通用汽车公司。
其中出售给通用公司的钢材,作为中间品其价值不被计算到美国的GNP 中。
出售给日本丰田公司的钢材,钢材价值通过丰田公司进入日本的GNP ,而最终没有进入美国的国民收入账户。
所以这部分由美国生产要素创造的中间品价值应该从日本的GNP 中减去,并加入美国的GNP 。
2、(1)等式12-2可以写成()()p CA S I T G =-+-。
美国更高的进口壁垒对私人储蓄、投资和政府赤字有比较小或没有影响。
(2)既然强制性的关税和配额对这些变量没有影响,所以贸易壁垒不能减少经常账户赤字。
不同情况对经常账户产生不同的影响。
例如,关税保护能提高被保护行业的投资,从而使经常账户恶化。
(当然,使幼稚产业有一个设备现代化机会的关税保护是合理的。
)同时,当对投资中间品实行关税保护时,由于受保护行业成本的提高可能使该行业投资下降,从而改善经常项目。
一般地,永久性和临时性的关税保护有不同的效果。
这个问题的要点是:政策影响经常账户方式需要进行一般均衡、宏观分析。
3、(1)、购买德国股票反映在美国金融项目的借方。
相应地,当美国人通过他的瑞士银行账户用支票支付时,因为他对瑞士请求权减少,故记入美国金融项目的贷方。
这是美国用一个外国资产交易另外一种外国资产的案例。
(2)、同样,购买德国股票反映在美国金融项目的借方。
当德国销售商将美国支票存入德国银行并且银行将这笔资金贷给德国进口商(此时,记入美国经常项目的贷方)或贷给个人或公司购买美国资产(此时,记入美国金融项目的贷方)。
克鲁格曼 教材《国际经济学》(国际金融)习题答案要点2

《国际经济学》(国际金融)习题答案要点第12章 国民收入核算与国际收支1、如问题所述,GNP 仅仅包括最终产品和服务的价值是为了避免重复计算的问题。
在国民收入账户中,如果进口的中间品价值从GNP 中减去,出口的中间品价值加到GNP 中,重复计算的问题将不会发生。
例如:美国分别销售钢材给日本的丰田公司和美国的通用汽车公司。
其中出售给通用公司的钢材,作为中间品其价值不被计算到美国的GNP 中。
出售给日本丰田公司的钢材,钢材价值通过丰田公司进入日本的GNP ,而最终没有进入美国的国民收入账户。
所以这部分由美国生产要素创造的中间品价值应该从日本的GNP 中减去,并加入美国的GNP 。
2、(1)等式12-2可以写成()()p CA S I T G =-+-。
美国更高的进口壁垒对私人储蓄、投资和政府赤字有比较小或没有影响。
(2)既然强制性的关税和配额对这些变量没有影响,所以贸易壁垒不能减少经常账户赤字。
不同情况对经常账户产生不同的影响。
例如,关税保护能提高被保护行业的投资,从而使经常账户恶化。
(当然,使幼稚产业有一个设备现代化机会的关税保护是合理的。
)同时,当对投资中间品实行关税保护时,由于受保护行业成本的提高可能使该行业投资下降,从而改善经常项目。
一般地,永久性和临时性的关税保护有不同的效果。
这个问题的要点是:政策影响经常账户方式需要进行一般均衡、宏观分析。
3、(1)、购买德国股票反映在美国金融项目的借方。
相应地,当美国人通过他的瑞士银行账户用支票支付时,因为他对瑞士请求权减少,故记入美国金融项目的贷方。
这是美国用一个外国资产交易另外一种外国资产的案例。
(2)、同样,购买德国股票反映在美国金融项目的借方。
当德国销售商将美国支票存入德国银行并且银行将这笔资金贷给德国进口商(此时,记入美国经常项目的贷方)或贷给个人或公司购买美国资产(此时,记入美国金融项目的贷方)。
最后,银行采取的各项行为将导致记入美国国际收支表的贷方。
克鲁格曼国际经济学答案.pdf
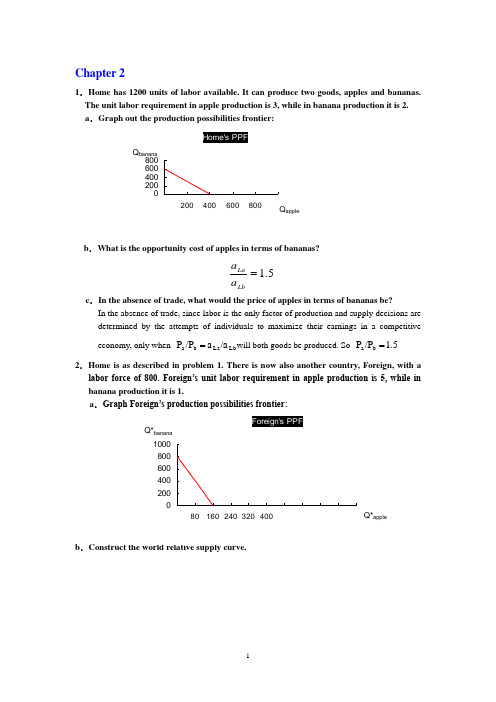
Chapter 21.Home has 1200 units of labor available. It can produce two goods, apples and bananas. The unit labor requirement in apple production is 3, while in banana production it is 2. a .Graph out the production possibilities frontier:b .What is the opportunity cost of apples in terms of bananas?5.1=LbLa a a c .In the absence of trade, what would the price of apples in terms of bananas be?In the absence of trade, since labor is the only factor of production and supply decisions aredetermined by the attempts of individuals to maximize their earnings in a competitive economy, only when Lb La b a /a a /P P =will both goods be produced. So 1.5 /P P b a =2.Home is as described in problem 1. There is now also another country, Foreign, with alabor force of 800. Foreign’s unit labor requirement in apple production is 5, while in banana production it is 1.a .Graph Foreign’s production possibilities frontier:b .3.Now suppose world relative demand takes the following form: Demand for apples/demandfor bananas = price of bananas/price of apples.a .Graph the relative demand curve along with the relative supply curve:a b b a /P P /D D =∵When the market achieves its equilibrium, we have 1b a )(D D −**=++=ba b b a a P P Q Q Q Q ∴RD is a hyperbola xy 1=b .What is the equilibrium relative price of apples?The equilibrium relative price of apples is determined by the intersection of the RD and RScurves.RD: yx 1= RS: 5]5,5.1[5.1],5.0(5.0)5.0,0[=∈=⎪⎩⎪⎨⎧+∞∈=∈y y y x x x ∴25.0==y x∴2/=b P a P e ec .Describe the pattern of trade.∵b a b e a e b a P P P P P P ///>>**∴In this two-country world, Home will specialize in the apple production, export applesand import bananas. Foreign will specialize in the banana production, export bananas and import apples.d .Show that both Home and Foreign gain from trade.International trade allows Home and Foreign to consume anywhere within the coloredlines, which lie outside the countries’ production possibility frontiers. And the indirect method, specializing in producing only one production then trade with other country, is a more efficient method than direct production. In the absence of trade, Home could gain three bananas by foregoing two apples, and Foreign could gain by one foregoing five bananas. Trade allows each country to trade two bananas for one apple. Home could then gain four bananas by foregoing two apples while Foreign could gain one apple by foregoing only two bananas. So both Home and Foreign gain from trade.4.Suppose that instead of 1200 workers, Home had 2400. Find the equilibrium relative price. What can you say about the efficiency of world production and the division of the gains from trade between Home and Foreign in this case? RD: yx 1= RS: 5]5,5.1[5.1],1(1)1,0[=∈=⎪⎩⎪⎨⎧+∞∈=∈y y y x x x ∴5.132==y x∴5.1/=b P a P e eIn this case, Foreign will specialize in the banana production, export bananas and import apples. But Home will produce bananas and apples at the same time. And the opportunity cost of bananas in terms of apples for Home remains the same. So Home neither gains nor loses but Foreign gains from trade.5.Suppose that Home has 2400 workers, but they are only half as production in both industries as we have been assuming, Construct the world relative supply curve and determine the equilibrium relative price. How do the gains from trade compare with those in the case described in problem 4?In this case, the labor is doubled while the productivity of labor is halved, so the "effective labor"remains the same. So the answer is similar to that in 3. And both Home and Foreign can gain from trade. But Foreign gains lesser compare with that in the case 4.6.”Korean workers earn only $2.50 an hour; if we allow Korea to export as m uch as it likes to the United States, our workers will be forced down to the same level. You can’t import a $5 shirt without importing the $2.50 wage that goes with it.” Discuss.In fact, relative wage rate is determined by comparative productivity and the relative demand for goods. Korea’s low wage reflects the fact that Korea is less productive than the United States in most industries. Actually, trade with a less productive, low wage country can raise the welfare and standard of living of countries with high productivity, such as United States. Sothis pauper labor argument is wrong.7.Japanese labor productivity is roughly the same as that of the United States in the manufacturing sector (higher in some industries, lower in others), while the United States, is still considerably more productive in the service sector. But most services are non-traded. Some analysts have argued that this poses a problem for the United States, because our comparative advantage lies in things we cannot sell on world markets. What is wrong with this argument?The competitive advantage of any industry depends on both the relative productivities of the industries and the relative wages across industries. So there are four aspects should be taken into account before we reach conclusion: both the industries and service sectors of Japan and U.S., not just the two service sectors. So this statement does not bade on the reasonable logic. 8.Anyone who has visited Japan knows it is an incredibly expensive place; although Japanese workers earn about the same as their U.S. counterparts, the purchasing power of their incomes is about one-third less. Extend your discussing from question 7 to explain this observation. (Hint: Think about wages and the implied prices of non-trade goods.) The relative higher purchasing power of U.S. is sustained and maintained by its considerably higher productivity in services. Because most of those services are non-traded, Japanese could not benefit from those lower service costs. And U.S. does not have to face a lower international price of services. So the purchasing power of Japanese is just one-third of their U.S. counterparts.9.How does the fact that many goods are non-traded affect the extent of possible gains from trade?Actually the gains from trade depended on the proportion of non-traded goods. The gains will increase as the proportion of non-traded goods decrease.10.We have focused on the case of trade involving only two countries. Suppose that there are many countries capable of producing two goods, and that each country has only one factor of production, labor. What could we say about the pattern of production and in this case? (Hint: Try constructing the world relative supply curve.)Any countries to the left of the intersection of the relative demand and relative supply curves export the good in which they have a comparative advantage relative to any country to the right of the intersection. If the intersection occurs in a horizontal portion then the country with that price ratio produces both goods.。
克鲁格曼国际经济学

Chapter3In1986,thepriceofoilonworldmarketsdroppedsharply.SincetheUnitedStatesisan oil-importingcountry,thiswaswidelyregardedasgoodfortheU.S.economy.YetinTexasandLou isiana1986wasayearofeconomicdecline.Why?ItcandeducethatTexasandLouisianaareoil-producingstatesofUnitedStates.Sowhenthepriceofoilonworldmarketsdeclined,therealwageofthisindustryfellintermsofothergoods.Thismightbether easonofeconomicdeclineinthesetwostatesin1986.2。
Aneconomycanproducegood1usinglaborandcapitalandgood2usinglaborandland.Thetotalsupplyoflaboris100unit s.Giventhesupplyofcapital,theoutputsofthetwogoodsdependsonlaborinputasfollows:Toanalyzetheeconomy’sproductionpossibilityfrontier,considerhowtheoutputmixchangesaslaborisshifte dbetweenthetwosectors.Graphtheproductionfunctionsforgood1andgood2.Q1Q 1(K 1,L 1)Q2Q 2(K 2,L 2)ProductionFunctionforGood1Output10093.9 1009080.7 87.48073.670666057.55038.148.6403025.12010 010 20 30 40 50607080 90100ProductionFunctionforGood2 LaborInputforGood1Output10091.495.51009081.586.78075.87069.360 52.561.850 40 39.830 2010 0110 20 30 40 50607080 90 100LaborInputforGood2Graphtheproductionpossibilityfrontier.Whyisitcurved?Q2Q2(K2,L2)Q2100PPFL2Q1100L1Q1Q1(K1,L1)a.ThePPFiscurvedduetodecliningmarginalproductoflaborineachgood.Thetotallaborsupplyisfixed.SoasL1rises,MPL1falls;correspondingly,asL2falls,MPL2rises.SoPPgetssteeperaswemovedownittotheright.b.Themarginalproductoflaborcurvescorrespondingtotheproductionfunctionsinproblem2areasfollows:c.d.e.f.g.h.i.j.k.l.m.Supposethatthepriceofgood2relativetothatofgood1is2.Determinegraphicallythewage rateandtheallocationoflaborbetweenthetwosectors. Withtheassumptionthatlaborisfreelymobilebetweensectors,itwillmovefromthelow-wagesectortothehigh-wagesectoruntilwagesareequalized.Soinequilibrium,thewagerateisequaltothevalueoflabor’smarginalproduct.MPL1P1MPL2P2P2/P122b.Theabscissaofpointofintersectionillustratedaboveshouldbebetween(20,30).Sinceweonlyhavetofindouttheapproximateanswer,linearfunctioncouldbeemployed.c.ThelaborallocationbetweenthesectorsisapproximatelyL1=27andL2=73.Thewagerateisapproximately0.98.ingthegraphdrawnforproblem2,determinetheoutputofeachsector.Thenconfirmgraphicallythattheslopoftheproductionpossibilityfrontieratthatpointequalstherelativepri ce.Q2Q2(K2,L2)Q2slope11002 PPFL2Q1c.100d.L1Q1Q1(K1,L1)e.TherelativepriceisP2/P1=2andwehavegottheapproximatelaborallocation,sowecanemploythelinearfunctionagaintocalculatetheapproximateoutputofeachsector:Q1=44andQ2=90.f.Supposethattherelativepriceofgood2fallsto1.Repeat(a)and(b).3Therelativedeclineinthepriceofgood2causedlabortobereallocated:laborisdrawnoutofproductionofgood2andentersproduction ofgood1(L1=62,L2=38).Thisalsoleadstoanoutputadjustment,thatis,productionofgood2fallsto68unitsandproductionofgood1risesto76unit s.Andthewagerateisapproximatelyequalto0.74.Q2Q2(K2,L2)Q2slope12 slope1100PPFL2Q1d.100e.L1Q1Q1(K1,L1)f.Calculatetheeffectsofthepricechangeontheincomeofthespecificfactorsinsectors1and2.3.WiththerelativepricechangefromP2/P1=2toP2/P1=1,thepriceofgood2hasfallenby50percent,whilethepriceofgood1hasstayedthesame.Wageshavefallentoo,butbylessthanthefallinP2(wagesfell approximately25percent).Thus,therealwagerelative4.toP2actuallyriseswhilerealwagerelativetoP1falls.Hence,todeterminethewelfareconsequenceforworkers,theinformationabouttheirconsumptionsharesofgood1andgood2isneeded.5.Inthetextweexaminedtheimpactsofincreasesinthesupplyofcapitalandland.Butwhatifthemobilefactor,labor,increasesinsupply?4a.Analyzethequalitativeeffectsofanincreaseinthesupplyoflaborinthespecificfactorsmodel,holdingthepriceofbothgoodsconstant.Foraneconomyproducingtwogoods,XanY,withlabordemandsreflectedbytheirmarginalrevenueproductcurves,thereisaninitial wageofw1andaninitiallaborallocationofL x=O x AandL y=O y A.Whenthesupplyoflaborincreases,therightboundaryofthediagramill ustratedbelowpushedouttoO y’.ThedemandforlaborinsectorYispulledrightwardwiththeboundary.Thenewintersectionofthela bordemandcurvesshowsthatlaborexpandsinbothsectors,andthereforeoutputofbothXandYalsoexpand.Therelativeexpansion ofoutputisambiguous.Wagespaidtoworkersfall.W MPLy P yMPL x P xw1w2A BO y O yb.Graphtheeffectontheequilibriumforthenumericalexampleinproblems2and3,givenarelativepriceof1,whenthelaborforceexpandsfrom100to140.Withthelawofdiminishing returns,thenewproductionpossibility frontier ismoreconcaveandsteeper(flatter)attheendswhentotallaborsupplyincreases.L1increaseto90from62andL2increasesto50from38.Wagesdeclinefrom0.74to0.60.ThisnewallocationoflaborleadstoanewoutputmixofapproximatelyQ1=85andQ2=77.5Q2Q2(K2,L2)Q2140100PPFL2Q1100140L1Q1Q1(K1,L1)Chapter41.IntheUnitedStateswherelandischeap,theratiooflandtolaborusedincattlerisingishigherthanthatoflandusedinwhe atgrowing.Butinmorecrowdedcountries,wherelandisexpensiveandlaborischeap,itiscommontoraisecowsbyusingle sslandandmorelaborthanAmericansusetogrowwheat.Canwestillsaythatraisingcattleislandintensivecomparedwithf armingwheat?Whyorwhynot? Thedefinitionofcattlegrowingaslandintensivedependsontheratiooflandtolaborusedinproduction,notontheratiooflandorlaborto output.TheratiooflandtolaborincattleexceedstheratioinwheatintheUnitedStates,implyingcattleislandintensiveintheUnitedStat es.Cattleislandintensiveinothercountriestooiftheratiooflandtolaborincattleproductionexceedstheratioinwheatproductioninthat country.ThecomparisonbetweenanothercountryandtheUnitedStatesislessrelevantforansweringthequestion.2.Supposethatatcurrentfactorpricesclothisproducedusing20hoursoflaborforeachacreofland,andfoodisproducedusingonly5hoursoflaborperacreofland.Supposethattheeconomy’ingadiagramdeterminetheallocationofresources.aLC/aTC (LC/QC)/(TC/QC) LC/TC LC 20TCaLF/aTF (LF/QF)/(TF/QF) LF/TF LF 5TFWecansolvethisalgebraicallysinceL=LC+LF=600andT=TC+TF=60.ThesolutionisLC=400,TC=20,LF=200andTF=40.6LandTCCloth Labor LF Food TFLCN owsupposethatthelaborsupplyincreasefirstto800,then1000,ingadiagramlikeFigure4-6,traceoutthechangingallocationofresources.L800:TC33.33,LC666.67,TF26.67,LF133.33L1000:TC46.67,LC933.33,TF13.33,LF66.67L1200:TC60,LC1200,TF0,LF0.(complspeteeciatlizoan) FoodLand12001000800Cloth0l0l0lbor4.Whatwouldhappenifthelaborsupplyweretoincreaseevenfurther?5.Atconstantfactorprices,somelaborwouldbeunused,sofactorpriceswouldhavetochange,ortherewouldbeunemployment.6.“Theworld’spoorestcountriescannotfindanythingtoexport.Thereisnoresourcethatisabundant—certainlynotcapitalorland,andinsmallpoornationsnotevenlaboris76.abundant.”Discuss.7.Thegainsfromtradedependoncomparativeratherthanabsoluteadvantage.Astopoorcountries,whatmattersisnottheabsoluteabundanceoffactors,buttheirrelativeabundance.Poorcountrieshaveanab undanceoflaborrelativetocapitalwhencomparedtomoredevelopedcountries.bormovement—whichmostlyrepresentsblue-collarworkersratherthanprofessionalsandhighlyeducatedworkers—hastraditionallyfavoredlimitsonimportsformless-affluentcountries.Isthisashortsightedpolicyofarationaloneinviewoftheinterestsofunionme mbers?Howdoestheanswerdependonthemodeloftrade?9.IntheRicardo’smodel,laborgainsfromtradethroughanincreaseinitspurchasingpower.Thisresultdoesnotsupportlaboruniondemandsforlimitsonimportsfromlessaffluentcountries.10.IntheImmobileFactorsmodellabormaygainorlosefromtrade.Purchasingpowerintermsofonegoodwillrise,butintermsoftheothergooditwilldecline.11.TheHeckscher-Ohlinmodeldirectlydiscussesdistributionbyconsideringtheeffectsoftradeontheownersoffactorsofpr oduction.Inthecontextofthismodel,borlosesfromtradesincethisgrouprepresentsthe relativelyscarcefactorsinthiscountry.TheresultsfromtheHeckscher-Ohlinmodelsupportlaboruniondemandsforimportlimits.12.ThereissubstantialinequalityofwagelevelsbetweenregionswithintheUnitedStates.Forexample,wagesofmanufacturingworkersinequivalentjobsareabout20percentlowerintheSouthea stthantheyareintheFarWest.Whichoftheexplanationsoffailureoffactorpriceequalizationmig htaccountforthis?HowisthiscasedifferentfromthedivergenceofwagesbetweentheUnitedSt atesandMexico(whichisgeographicallyclosertoboththeU.S.SoutheastandtheFarWestthant heSoutheastandFarWestaretoeachother)?13.Whenweemployfactorpriceequalization,weshouldpayattentiontoitsconditions:bothcountries/regionsproducebothgoods;bothcountrieshavethesametechnologyofproduction,andtheabsenceofbarri erstotrade.InequalityofwagelevelsbetweenregionswithintheUnitedStatesmaycausedbysomeorall ofthesereasons.14.Actually,thebarrierstotradealwaysexistintherealworldduetotransportationcosts.AndthetradebetweenU.S.andMexico,bycontrast,issubjecttolegallimits;togetherwithculturaldifferencesthatinhibitthe flowoftechnology,thismayexplainwhythedifferenceinwageratesissomuchlarger.15.ExplainwhytheLeontiefparadoxandthemorerecentBowen,Leamer,andSveikauskasresultsreportedinthetextcontradictthefactor-proportionstheory.Thefactorproportionstheorystatesthatcountriesexportthosegoodswhoseproductionisintensiveinfa ctorswithwhichtheyareabundantlyendowed.OnewouldexpecttheUnitedStates,whichhasahighcap ital/laborratiorelativetotherestoftheworld,toexportcapital-intensivegoodsiftheHeckscher-Ohlintheoryholds.LeontieffoundthattheUnitedStatesexportedlabor-intensivegoods.Bowen,LeamerandSveikauskasfoundthatthecorrelationbetweenfactorendowme ntandtradepatternsisweakfortheworldasawhole.Thedatadonotsupportthepredictionsofthetheoryt hatcountries'exportsandimportsreflecttherelativeendowmentsoffactors.89.InthediscussionofempiricalresultsontheHeckscher-Ohlinmodel,wenotedthatrecentworksuggeststhattheefficiencyoffactorsofproductionseemstodifferinternationally.Explainhowthiswouldaffecttheconceptoffactorpriceequalization. Iftheefficiencyofthefactorsofproductiondiffersinternationally,thelessonsoftheHeckscher-Ohlintheorywouldbeappliedto“effectivefactors”whichadjustforthedifferencesintechnologyorworkerskillsorlandquality(forexa mple).Theadjustedmodelhasbeenfoundtobemoresuccessfulthantheunadjustedmodelatexplainingthepatternoftradebetween countries.Factor-priceequalizationconceptswouldapplytotheeffectivefactors.Aworkerwithmoreskillsorinacountrywithbettertechnologycouldbe consideredtobeequaltotwoworkersinanothercountry.Thus,thesinglepersonwouldbetwoeffectiveunitsoflabor.Thus,theonehigh-skilledworkercouldearntwicewhatlowerskilledworkersdoandthepriceofoneeffectiveunitoflaborwouldstillbeequalized.3、经过活动,使学生养成博学多才的好习惯。
克鲁格曼国际经济学答案(英文)
Overview of Section IInternational Trade TheorySection I of the text is comprised of six chapters: Chapter 2 Labor Productivity and Comparative Advantage: The Ricardian Model Chapter 3 Specific Factors and Income Distribution Chapter 4 Resources and Trade: The Heckscher-Ohlin Model Chapter 5 The Standard Trade Model Chapter 6 Economies of Scale, Imperfect Competition, and International Trade Chapter 7 International Factor Movements T Section I Overview Section I of the text presents the theory of international trade. The intent of this section is to explore the motives for and implications of patterns of trade between countries. The presentation proceeds by introducing successively more general models of trade, where the generality is provided by increasing the number of factors used in production, by increasing the mobility of factors of production across sectors of the economy, by introducing more general technologies applied to production, and by examining different types of market structure. Throughout Section I, policy concerns and current issues are used to emphasize the relevance of the theory of international trade for interpreting and understanding our economy. Chapter 2 gives a brief overview of world trade. In particular, it discusses what we know about the quantities and pattern of world trade today. The chapter uses the empirical relationship known as the gravity model as a framework to describe trade. This framework describes trade as a function of the size of the economies involved and their distance. It can then be used to see where countries are trading more or less than expected. The chapter also notes the growth in world trade over the previous decades and uses the previous era of globalization (pre-WWI) as context for today’s experience. Chapter 3 introduces you to international trade theory through a framework known as the Ricardian model of trade. This model addresses the issue of why two countries would want to trade with each other. This model shows how mutually-beneficial trade arises when there are two countries, each with one factor of production which can be applied toward producing each of two goods. Key concepts are introduced, such as the production possibilities frontier, comparative advantage versus absolute advantage, gains from trade, relative prices, and relative wages across countries. 4 Krugman/Obstfeld • International Economics: Theory and Policy, Seventh Edition Chapter 4 introduces what is known as the classic Heckscher-Ohlin model of international trade. Using this framework, you can work through the effects of trade on wages, prices and output. Many important and intuitive results are derived in this chapter including: the Rybczynski Theorem, the Stolper-Samuelson Theorem, and the Factor Price Equalization Theorem. Implications of the Heckscher-Ohlin model for the pattern of trade among countries are discussed, as are the failures of empirical evidence to confirm the predictions of the theory. The chapter also introduces questions of political economy in trade. One important reason for this addition to the model is to consider the effects of trade on income distribution. This approach shows that while nations generally gain from international trade, it is quite possible that specific groups within these nations could be harmed by this trade. This discussion, and related questions about protectionism versus globalization, becomes broader and even more interesting as you work through the models and different assumptions of subsequent chapters. Chapter 5 presents a general model of international trade which admits the models of the previous chapters as special cases. This “standard trade model” is depicted graphically by a general equilibrium trade model as applied to a small open economy. Relative demand and relative supply curves are used to analyze a variety of policy issues, such as the effects of economic growth, the transfer problem, and the effects of trade tariffs and production subsidies. The appendix to the chapter develops offer curve analysis. While an extremely useful tool, the standard model of trade fails to account for some important aspects of international trade. Specifically, while the factor proportions Heckscher-Ohlin theories explain some trade flows between countries, recent research in international economics has placed an increasing emphasis on economies of scale in production and imperfect competition among firms. Chapter 6 presents models of international trade that reflect these developments. The chapter begins by reviewing the concept of monopolistic competition among firms, and then showing the gains from trade which arise in such imperfectly competitive markets. Next, internal and external economies of scale in production and comparative advantage are discussed. The chapter continues with a discussion of the importance of intra-industry trade, dumping, and external economies of production. The subject matter of this chapter is important since it shows how gains from trade arise in ways that are not suggested by the standard, more traditional models of international trade. The subject matter also is enlightening given the increased emphasis on intra-industry trade in industrialized countries. Chapter 7 focuses on international factor mobility. This departs from previous chapters which assumed that the factors of production available for production within a country could not leave a country’s borders. Reasons for and the effects of international factor mobility are discussed in the context of a one-factor (labor) production and trade model. The analysis of the international mobility of labor motivates a further discussion of international mobility of capital. The international mobility of capital takes the form of international borrowing and lending. This facilitates the discussion of inter-temporal production choices and foreign direct investment behavior. 。
保罗克鲁格曼版国际经济学国际贸易部分同步单项选择题
保罗克鲁格曼版国际经济学国际贸易部分同步单项选择题本文为保罗克鲁格曼版国际经济学国际贸易部分同步单项选择题文档。
以下将按照题目进行一一列出,供读者参考。
一、基本概念题1.下列哪个选项能够最恰当地描述国际贸易?–[ ] A. 同一国家内部的商品交换–[ ] B. 不同国家的货物和服务交易–[ ] C. 不同国家之间的货币交换–[ ] D. 不同国家之间的资本流动正确答案:B2.国际贸易的主要动力是什么?–[ ] A. 原材料和资源的需求差异–[ ] B. 不同国家的比较优势–[ ] C. 政府政策的干预–[ ] D. 货币汇率的波动正确答案:B3.以下哪个选项说明了比较优势的概念?–[ ] A. 一个国家在生产某种商品时,所需的机会成本较低–[ ] B. 一个国家的货币汇率较强势–[ ] C. 一个国家具有先进的技术和设备–[ ] D. 一个国家的人均收入较高正确答案:A4.以下哪个选项最能说明国际贸易对经济福利的贡献?–[ ] A. 国内生产总值的增长–[ ] B. 减少失业率–[ ] C. 降低商品价格–[ ] D. 增加政府税收正确答案:C二、模型和理论题5.下列哪个选项是描述绝对优势理论?–[ ] A. 一个国家在所有商品生产上都比其他国家高效–[ ] B. 一个国家在某些商品生产上具有相对优势–[ ] C. 一个国家的生产成本低于其他国家–[ ] D. 一个国家在国际市场上占据主导地位正确答案:A6.以下哪个选项最能说明比较优势理论?–[ ] A. 两个国家在生产两种商品上的机会成本比较–[ ] B. 两个国家的货币汇率比较–[ ] C. 两个国家的外贸政策比较–[ ] D. 两个国家的人口规模比较正确答案:A7.哪个选项最适合描述Ricardo的比较优势理论?–[ ] A. 国际贸易理论中的一个经验定理–[ ] B. 国际贸易中不存在比较优势–[ ] C. 国际贸易中只有绝对优势–[ ] D. 国际贸易只受限于贸易壁垒正确答案:A8.下列哪种情况下,两个国家能通过贸易获得互利?–[ ] A. 两个国家的机会成本相同–[ ] B. 两个国家的物价水平相同–[ ] C. 两个国家生产各种商品的成本相同–[ ] D. 两个国家各自具有相对优势正确答案:D三、政策和实践题9.下列哪个政策措施是促进国际贸易的常规手段?–[ ] A. 关税和配额的限制–[ ] B. 货币贬值措施–[ ] C. 出口补贴政策–[ ] D. 消费者补贴政策正确答案:C10.慢速增长型发展中国家常采取哪些贸易政策?–[ ] A. 出口导向型政策–[ ] B. 进口替代型政策–[ ] C. 自由贸易政策–[ ] D. 保护主义政策正确答案:B11.世界贸易组织(WTO)的主要目标是什么?–[ ] A. 促进自由贸易–[ ] B. 限制贸易壁垒–[ ] C. 改善贸易平衡–[ ] D. 保护发展中国家正确答案:A12.下列哪个选项是并非有效的贸易争端解决机制?–[ ] A. 调解机构–[ ] B. 防卫性贸易措施–[ ] C. 争端解决机构–[ ] D. 公关机构正确答案:B以上为保罗克鲁格曼版国际经济学国际贸易部分同步单项选择题文档。
(英文版)保罗。克鲁格曼《国际经济学》题库2
练习题二:Part A: Multiple Choice1. In the 2-factor, 2 good Heckscher-Ohlin model, the two countries differ inA) tastes.B) military capabilities.C) size.D) relative availabilities of factors of production.E) labor productivities.2.The slope of a countryʹs PPF reflectsA) the opportunity cost of product S in terms of product T.B) the opportunity cost of T in terms of money prices.C) the opportunity cost of S or T in terms of S.D) Both A and B.E) Both A and C.3. According to the Heckscher-Ohlin model, the source of comparative advantage is a countryʹsA) technology.B) advertising.C) human capital.D) factor endowments.E) Both A and B.4. If Australia has relatively more land per worker, and Belgium has relatively more capital per worker, then if trade were to open up between these two countries,A) the relative price of the capital-intensive product would rise in Australia.B) the world price of the land-intensive product would be higher than it had been in Belgium.C) the world price of the land intensive product would be higher than it had been in Australia.D) the relative price of the land intensive product would rise in Belgium.E) None of the above.5. The Heckscher-Ohlin model predicts all of the following exceptA) which country will export which product.B) which factor of production within each country will gain from trade.C) the volume of trade.D) that wages will tend to become equal in both trading countries.E) None of the above.6. External economies of scale arise when the cost per unitA) rises as the industry grows larger.B) falls as the industry grows larger rises as the average firm grows larger.C) falls as the average firm grows larger.D) remains constant.E) None of the above.7. External economies of scaleA) may be associated with a perfectly competitive industry.B) cannot be associated with a perfectly competitive industry.C) tends to result in one huge monopoly.D) tends to result in large profits for each firm.E) None of the above.8. The simultaneous export and import of widgets by the United States is an example ofA) increasing returns to scale.B) imperfect competition.C) intra-industry trade.D) inter-industry trade.E) None of the above.9. Intra-industry trade can be explained in part byA) transportation costs within and between countries.B) problems of data aggregation and categorization.C) increasing returns to scale.D) A ll of the above.E) None of the above.10. Intra-industry trade will tend to dominate trade flows when which of the following exist s?A) large differences between relative country factor availabilitiesB) small differences between relative country factor availabilitiesC) homogeneous products that cannot be differentiatedD) constant cost industriesE) None of the above.11. The larger the number of firms in a monopolistic competition situation,A) the larger are that countryʹs exports.B) the higher is the price charged.C) the fewer varieties are sold.D) the lower is the price charged.E) None of the above.12. The larger the number of firms in a monopolistic competition situation,A) the larger are that countryʹs exports.B) the higher is the price charged.C) the fewer varieties are sold.D) the lower is the price charged.E) None of the above.DADCC BACDB DDPart B:Short Questions1.ʹThe H.O. model remains useful as a way to predict the income distribution effects of trade.ʹDiscuss.Answer: T he Stolper-Samuelson theorem, one of the basic theorems arising from theHeckscher-Ohlin model yields an elegant demonstration of the fact that changes in product prices (such as will occur when trade is expanded or curtailed) telescopes its effects onto factor prices, so that not only do relative factor returns mirror product prices, but that actual returns to factors may either rise or fall in real terms. Hence, as a policy framework, the disproportionate effect trade may have on real incomes of sectors, such as skilled-labor is quite useful both theoretically and practically (or polemically)2.International trade leads to complete equalization of factor prices. Discuss.T his statement is typically ʹtrue . . . but.ʹ Under a strict and limited set of assumptions, such as the original Heckscher-Ohlin model which excludes country specific technologies; non- homothetic tastes; factor intensity reversals; large country differences in (relative) factor abundances, more factors than goods, and an equilibrium solution within the ʹcone of specializationʹ; then it may be demonstrated that internal consistency demands that the above stated sentence is ʹtrue.ʹ However, the minute one relaxes any of the above listed assumptions one may easily identify solutions, which contradict the factor price equalization theorem.3.If a scale economy is the dominant technological factor defining or establishing comparativeadvantage, then the underlying facts explaining why a particular country dominates world markets in some product may be pure chance, or historical accident. Explain, and compare this with the answer you would give for the Heckscher-Ohlin model of comparative advantage.T his statement is true, since the reason the seller is a monopolist may be that it happened to have been the first to produce this product in this country. It may have no connection to any supply or demand related factors; nor to any natural or man-made availability. This is all exactly the opposite of the Heckscher-Ohlin Neo-Classical modelʹs explanation of the determinants of comparative advantage.。
国际经济学题库(克鲁格曼版)
国际经济学题库(克鲁格曼版)《国际贸易》习题库——克鲁格曼版⼀、名词解释1、绝对优势2、⽐较优势3、机会成本4、贸易条件5、要素禀赋6、劳动密集型产品7、资本密集型产品8、技术密集型产品9、规模经济 10、产业内贸易 11、代表性需求12、边际物质产品与边际价值产品13、专门⽣产要素与共同⽣产要素14产品⽣命周期理论15、外汇 16、汇率 17、汇率制度 18、即期外汇业务19、远期外汇业务 20、套利业务 21、⼀价定律22、国际收⽀ 23、马歇尔⼀勒纳条件 24、货币贬值的J型曲线效应⼆、判断以下各题的对错,并说明理由。
1、当开放贸易时,所有消费者的境况都会得到改善。
2、根据简单贸易模型,在贸易发⽣之前,如果各国的某种商品价格相同,这些国家之间就不会有交换该种商品的动机。
·3、如果⼀国中某⽣产者通过贸易能使⾃⼰的境况得到改善,那么,该国中所有的⽣产者都会通过贸易来改善⾃⼰的境况。
4、在两国间均衡贸易价格条件下,⼀国对某种商品的过度供给必然与另⼀国对该商品的过度需求相等。
5、不存在free lunch,但却存在free trade。
6、⼀国即便在某种商品的⽣产上具有绝对劣势,它也可以在该商品的⽣产上具有相对优势。
7、根据H—O理论,⼀国如果⽐他国拥有更多英亩的⼟地,该国便是“⼟地丰富”的国家。
8、在成本递增的条件下,各国并不⼀定要完全专业化于⼀种商品的⽣产。
9、H—O理论假设各国拥有相同的商品偏好。
10、我们或许可以通过更为细分化的⽣产要素定义⽽解决Leontief Paradox。
11、Stolper-Samuelson定理认为,贸易将使丰富要素的所有者得到更低的实际收⼊,同时使稀缺要素的所有者得到更⾼的实际收⼊。
12、如果各国的⽣产技术相同,贸易便不会使⽣产要素价格均等化。
13、⼀国的⾮技术性⼯⼈会⽐技术性⼯⼈更加反对贸易⾃由化。
14、“⼤”国可投资发展进⼝替代产业⽽不是出⼝产业,进⽽改善本国的贸易条件。
- 1、下载文档前请自行甄别文档内容的完整性,平台不提供额外的编辑、内容补充、找答案等附加服务。
- 2、"仅部分预览"的文档,不可在线预览部分如存在完整性等问题,可反馈申请退款(可完整预览的文档不适用该条件!)。
- 3、如文档侵犯您的权益,请联系客服反馈,我们会尽快为您处理(人工客服工作时间:9:00-18:30)。
第二章1.引力模型P13:在其他条件不变的情况下(假设任何影响两国之间的贸易的因素不变),两国间的贸易规模和两国的GDP成正比,与两国间的距离成反比。
2.行业贸易P141:指某一行业差异产品之间的双向贸易,它反映出规模经济。
3.行业间贸易P141:指的是一个行业的产品与另一个行业产品的交换,它反映出比较优势。
4.配额租金P184:许可证持有者能够从外国购买进口品并在国以高价出售,他们获取的利润就是配额租金。
第三章结合第四章看(着重看理论推理)论述:课本知识+自己观点嘉图模型比较优势认为国际贸易产生的原因嘉图的比较优势嘉图模型的假设是:假设劳动是唯一的生产要素嘉图模型认为国际间的劳动生产率的不同是国际贸易的唯一决定因素生产效率的不同导致了比较优势的不同结论:一个国家应该出口有比较优势的产品,进口有国优势的产品,有这样的一个原理去支撑国际贸易产生,也就是说嘉图模型也是在探讨国际贸易产生的原因要素禀赋模型与嘉图模型的区别和原因是:区分两者共同的基础:(1)、嘉图(第三章)(2)、要素禀赋,原则:国际顺序:?首先,说说要素禀赋理论的结论:认为一个国家应该如何参与国际贸易,认为各国间的资源差异(各国要素差异度,差异水平)是产生(国际)贸易的唯一原因(嘉图模型)生产效率不同比较优势不同国际贸易(要素禀赋理论)要素禀赋的差异(不一样)要素价格(不一样)相对价格(不一样)认为现在中国也还在参与国际贸易,那么她的比较优势和要素禀赋理论哪一个理论更贴近第三章1.单一要素P27:衡量生产效益:单位产品所需要的投入要素A本国生产每单位产品所需要的劳动为5单位,B外国需要3单位,同种产品相对而言外国更有效率,具有比较优势(嘉图模型不可单独写这个)2.比较优势P30(通过这种形式分析本国该进口或出口什么)假设:a LC/a LW<a*LC/a*LW 或a LC/a*LC<a LW/a*LW也就是说,我们假定本国生产1磅奶酪所需的劳动投入与生产1加仑葡萄酒所需的劳动投入之比小于外国的该比值。
更简单地说,也就是本国奶酪部门的相对劳动生产率高于葡萄酒部门的相对劳动生产率。
3.国际贸易发生活化相对价格的确定P32-33:首先,总供给曲线显示如果世界价格低于aLC/aLW 则没有人会供应奶酪.-假定aLC/aLW<a*LC/a*LW,, 本国将会只生奶酪.-只要PC/PW<aLC/aLW ,或者PC/aLC<PW/aLW ,本国将会只生产葡萄酒.-类似地,只要PC/PW<a*LC/a*LW 外国将会只生产葡萄酒.第二,当奶酪的相对价格, PC/PW=aLC/aLW, 本国工人无所谓生产奶酪和葡萄酒上。
供给曲线出现了一个水平阶段。
第三, 因为PC/PW>a*LC/a*LW, 本国和外国都专业化生产奶酪。
将不会有葡萄酒的生产, 这样奶酪的相对供给将会趋向无穷大。
第四, 如果PC/PW=a*LC/a*LW, 外国工人无所谓生产奶酪和葡萄酒。
供给曲线又一次出现了一个水平阶段第五, aLC/aLW< PC/PW< a*LC/a*LW, 奶酪的相对供给是(L/aLC)/(L*/a*LW).第四章要素禀赋:假设:各国间的资源差异是产生贸易的唯一原因第五章(考试容最多)1.(P89)贸易条件:一个国家出口产品的价格除以进口产品的价格结论:一个国家的福利会随着贸易条件的改善而上升,随着贸易条件的恶化而下降。
贸易条件为什么会影响国福利水平?(用图说话)答:(1)贸易条件定义为一国出口产品的价格除以进口产品的价格。
(2)()我们根据图1-1来进行分析:等价值线的斜率等于棉布相对价格的负数,因此,当相对价格Pc/P F上升时,所有的等价值线变得更陡了,尤其是,最大价值线会从VV1移到VV2,生产点会从点Q1移动到点Q2,消费点从点D1到点D2。
从点D1到点D2的移动反应了Pc/P F上升所产生的两个影响,第一,消费移动到了一条更高的无差异曲线上,社会福利改善了;第二,相对价格的变动会使得消费点随无差异曲线向靠近粮食远离棉布的方向移动。
福利的增加是收入效应,在给定的福利水平下消费点的移动称为替代效应。
收入效应会使得两种产品的消费量都增加,而替代效应的作用是使社会减少棉布的消费,增加粮食的消费。
(3)因此我们可以得出一个结论:一个国家的福利会随着贸易条件的改善而上升,随着贸易条件的恶化而下降。
2.(P90-92)经济增长怎样影响金融贸易福利水平?(经济增长怎样影响贸易水平??)经济增长使RS曲线移动,改变供给均衡状态,相对价格Pc/P F改变,贸易条件改变,影响社会福利。
答:我们画图分析:(1)假设本国出现了偏向于棉布的经济增长,而且偏向的幅度很大,则世界棉布的相对供给曲线就会从RS1向右移动到RS2,这一移动会使得棉布的相对价格从(PC/PF)1下降到(PC/PF)2,意味着本国贸易条件恶化,社会福利减少,外国贸易条件改善,社会福利增加。
(2)本国发生了偏向于粮食的增长,都会使RS曲线从RS1向左移动到RS2,并因此使得棉布的相对价格从(PC/PF)1提高到(PC/PF)2,本国的贸易条件会随之改善,社会福利增加,外国的贸易条件会恶化,社会福利减少。
(3)由此我们得出一个结论:出口偏向型增长会使得本国的贸易条件恶化,但对世界其他国家有利;进口偏向型增长有利于改善本国的贸易条件,但世界其他国家则会为此付出代价.3.(P94)国际收入转移:RD曲线的移动,(也即世界的相对需求曲线的移动,会影响世界市场相对需求价格)边际支持倾向(如果收入转出国对出口产品的边际支出倾向比转入国高,那么收入转移会使得转出国的贸易条件恶化。
当然,如果转出国对出口产品的边际支出倾向比转入国低,那么转出国的贸易条件就会改善。
P96)争论双方各持观点意见,从而提出了收入转移问题,分情况讨论,两者都对。
第六章1.规模经济影响国际贸易规模经济是指企业可以以低于双倍的成本获得双倍的产出的情形,它可以分为外部规模经济和部规模经济。
运用不完全竞争模型来分析存在规模经济的贸易,我们知道,市场规模影响着市场均衡:市场越大,容纳的厂商越多,各厂商的生产规模也越大,平均成本因而也越低。
外部的和部的规模经济对市场结构具有不同的影响。
一个只存在外部规模经济的行业(即大厂商没有优势)一般有许多相对较小的厂商构成,且处于完全竞争的状态;相反,存在部规模经济的行业中,大厂商比小厂商更具有成本优势,就形成了不完全竞争的市场结构。
2.垄断(P116两条线:CC成本线和PP价格线)P119CC曲线:AC=F/Q+c=n * F/S+cPP曲线:P=c+1/(b * n) , n为该行业的厂商数,S为行业的总销售量,Q为某厂商的销售量,b为常数项,P为该厂商产品的价格,c为边际成本,E处垄断市场实现均衡垄断竞争市场中的厂商数及各厂商的定价有两个关系所决定:一方面,市场中的厂商数越多,则它们的竞争越激烈,相应地行业定价也较低。
这一关系由PP曲线反映。
另一方面,厂商数越多,各厂商的销售量就越少,因而平均成本较高。
这一关系由CC曲线表示。
如果价格超过平均成本(即如果PP曲线位于CC曲线之上),该行业就会盈利,更多的厂商就会进入该行业;反之,若价格低于平均成本,该行业就会亏损,一些厂商自然就会退出该行业。
当平均成本与价格相等时,即在PP曲线与CC曲线的交点E会形成均衡的价格与厂商数。
第八章贸易的政策工具:关税,配额,出口补贴,自由限制1.关税(影响、成本、收益分析)(1)P174征收关税会引起本国价格上升,外国价格下跌,总贸易量减少。
假定两个大国之间相互贸易,在没有关税的情况下,小麦的国际价格(Pw)将等于两国的国价格;在有关税的情况下, 本国的小麦价格将升至PT ,外国将降至P*T (= PT –t) ,直到两者的差价为t美元。
本国由于价格上升,生产商供给增加而消费者需求减少,所以进口需求减少;外国由于价格下降,生产商供给减少而消费者需求增加,所以出口减少。
因此,由于课以关税,小麦的贸易总量下降(2)P177关税会提高进口国的商品价格,降低出口国的价格。
这些价格变化导致如下后果:进口国的消费者受损,出口国的消费者受益;进口国的生产商收益,出口国的生产商受损。
此外,政府通过征收关税可以获得收入。
为确定和比较这些成本和收益,需要界定消费者剩余和生产者剩余。
2.出口补贴与关税的联系(相通,区别)计算题:1.假设生产以蒲式耳小麦需要9单位土地和3单位劳动,而生产一码棉布需要6单位劳动和1单位土地。
并假设一国有120单位劳动和180单位土地。
A. 画出这个国家的生产可能性边界。
B.如果土地供给增加了90单位,生产可能性边界将如何变化?这个结果有什么含义?2.(P83)假设生产1加仑葡萄酒需要10单位劳动和5单位土地,而生产1磅奶酪需要4单位劳动和8单位土地。
A.如果葡萄酒与奶酪的单位价格分别是30美元和16美元,证明在一个竞争性经济中,单位工资和租金不可能是2和3;画出对两种产品而言价格等于边际成本的直线,并确定土地和劳动的要素价格。
B.如果奶酪的价格上升到每磅24美元,要素价格会如何变化?C.奶酪价格的上升将怎样影响工人和土地所有者的购买力?证明:A.单位工资和租金不可能是2和3,因为设单位工资为,2,土地租金为3,生产1加仑葡萄酒的成本为2 * 10 +3 * 5 = 35 > 30 , 因此成本大于价格,则不生产由图可知点A 10w+5r=30 解得w=8/34w+8r=16 r=2/3B. 10w+5r=30 解得w=24w+8r=24 r=23.假设本国进口葡萄酒,出口奶酪,且本国政府对酒类进口征收25%的关税。
A.这个关税将如何影响本国葡萄酒的相对价格(相对于国际市场上葡萄酒的相对价格而言)?B.关税将如何影响葡萄酒的世界相对需求和相对供给?C.关税对本国的贸易条件会产生什么影响?D.讨论那些前提假设对于你会问题6c是至关重要的。
4.(P142)假设的单个汽车生产商的固定成本是50亿美元,而每辆车的可变成本是17000美元。
厂商越多,竞争越激烈,价格就下降。
具体说P=17000+150/n , n 为市场上厂商的数量。
设美国和欧洲市场上分别有3亿和5.33亿人口。
A.在没有对外贸易时,美国和欧洲汽车市场上均衡的厂商数量是多少?B.在没有对外贸易时,美国和欧洲汽车市场上均衡的价格是多少?C.现在假设美欧之间进行自由贸易,美国市场上除了原有的3亿人口外,将增加5.33亿人 口。
在美国和欧洲汽车市场上将有多少汽车厂商?汽车新的均衡价格是多少?D.美国市场上汽车的价格在b 和c 中为何不同?自由贸易改善了消费者的福利吗?是怎样改 善的? 解:P=17000+150/nAC=(n*50亿)/S+17000 因为 P=AC所以 17000+150/n=(n*50亿)/S+17000亿亿50150n 501502SS n =⇒=美元美元欧美5.170374/15017000170503/15017000.=+==+=PP B170305150170005n 1700033.53n50/15017000.=+=≈=++=+=P AC P AC nP C 则得使D. 在欧洲市场和美国市场上,价格都下降到17030美元。