超声发生器5072PR-73PR-77PR-(EN)中文说明书
六通道超声波发生器使用说明书

六通道超声波发生器使用说明书深圳己道科技有限公司目录1概述 (3)2功能部件 (3)2.1前面板 (3)2.2后面板 (4)3接口、功能及技术指标 (4)3.1环境接口 (4)3.2电气接口 (4)3.3结构尺寸 (6)4功能及技术指标 (6)4.1主要功能 (6)4.2技术指标 (6)5基本操作 (7)5.1显示 (7)5.2操作 (9)5.3开机、关机 (11)5.4外部急停使能 (11)5.5总启动、停止 (12)6使用规范 (12)7异常情况处理 (12)8技术支持 (12)1概述六通道超声波发生器(以下简称发生器)可同时输出6通道同频、不同相的超声波信号,具备自动扫频和频率追踪功能,在不同负载状态下6个换能器同时有效谐振,并且1组3个换能器之间相位可调。
发生器可以独立使用,通过面板元件来设置各项功能和参数。
本文介绍了发生器的功能部件,描述了发生器的使用方法。
2功能部件2.1前面板a.液晶显示器,数字化显示所有状态及参数;b.选择按钮,选中需要设置的参数;c.手轮,配合选择按钮设置参数;d.启动/停止按钮,启动或关闭超声信号输出;e.急停使能开关,使能或禁能外部急停信号;f.RS-485通信插座,连接上位机通信线;g.外控IO插座,连接防爆柜IO插头,内含振子类型选择和急停信号。
2.2后面板a.电源开关,接通或关断发生器总电源;b.电源插座,连接电源线;c.散热风扇1、2,排风口,冷却发生器内部元件;d.超声信号插座,输出A、B、C、D、E、F共六个通道的超声信号;e.超声信号接线柱,也是超声信号输出端,内部与超声信号插座并联,便于连接示波器或U型接线端子,红色接线柱为正极,黑色为负极。
3接口、功能及技术指标3.1环境接口a.供电电源:AC220V,50Hz,3000VA;b.环境温度:0℃-45℃;c.环境湿度:1%-95%,无凝露。
3.2电气接口a.电源插座采用带保险管座的三线品字插座,配2.5方的三芯电源线。
Philips EPIQ 超声仪技术说明说明书
Using anatomical intelligence to assess LV functionPhilips EPIQ ultrasound systemEPIQ is the most intelligent Philips premium ultrasound ever, offering a complete setof easy-to-use quantitative tools to turn reproducible data into information to help guidetreatment. Leading-edge Anatomical Intelligence Ultrasound (AIUS) is the heart of EPIQand is designed to elevate the ultrasound system from a passive to an actively adaptivedevice. Speckle strain echocardiography is a novel technique designed to allow cliniciansto quickly and easily assess myocardial deformation (strain) in day-to-day practice,going beyond ejection fraction in the assessment of left ventricular (LV) function.The ZeroClick technology of the Automated Cardiac Motion Quantification A.I.(aCMQ A.I.)tool drives automation to provide reproducible 2D Global Longitudinal Strain (GLS)speckle measurements.ChallengeIn today’s cardiology practice, assessment of LV function is no longer limited to evaluation of ejection fraction. Speckle strain echocardiography is a novel technique for use in imaging myocardial deformation (strain). Strain imaging has proven to provide important incremental information in various clinical settings. Areas that hold great promise include the detectionof subclinical heart disease (when other systolic functional parameters are normal), the evaluationof myocardial ischemia and viability, and serial assessment of different cardiomyopathies.For cardiologists to incorporate strain results into their clinical decision-making, it is vital that they can have confidence that various echocardiographic systems generate the same values for a given patient. They also want to be sure that results are not operator-dependent, but rather reproducible by different operators and at different times. In addition, for strain analysis to be practical, it cannot be too time-consuming. Currently, the most important practical limitations of routine clinical incorporation of strain imaging include its impact on workflow efficiency, observer variability, and inter-vendor inconsistency, driven by the fact that different manufacturers may use different tracking algorithms.Analysis and case studies provided by Professor Alex Lee, Division of Cardiology and Professor Cheuk-Man YU, Institute of Vascular Medicine,The Chinese University of Hong KongaCMQ A.I. automatically generates GLS measurements from these 2D images obtained from apical 4-, 3-, and 2-chamber views of a normal heart, with no manual marking of anatomic landmarks required to initiate analysis.SolutionAs with many other technologies, automation is the key to achieving workflow efficiency and measurement reproducibility of strain echocardiography in a busy clinical practice. Conventional ways to initiate GLS measurement require manual tracing of the endocardial border or at least manual location of anatomic landmarks such as the mitral annulus and LV apex. This inevitably slows workflow and introduces human error and observer variability, hence limiting practical use of strain imaging. With the aCMQ A.I. tool of Philips EPIQ, GLS can be obtained with ZeroClick technology within a few seconds after acquisition of 2D images from the three routine apical views (4-chamber, 2-chamber, and long-axis).ImpactEnhancement of workflow efficiency, improvement in reproducibility, and resolution of inter-vendor algorithm discrepancy as a result of full automation are expected to help promote widespread adoption of this novel technique in daily practice.Data comparisonWe studied the inter-vendor agreement of GLSmeasurement in 35 patients. Patients had transthoracic echocardiography performed on EPIQ and on anultrasound system of a different vendor within the same day, and the images were analyzed for GLS using aCMQ A.I.and the strain analysis software of the other vendor. We observed excellent inter-vendor agreement(bias = -0.47%, 95% limits of agreement = -4.06% to 3.12%, coefficient of variation = 2.5%; r = 0.92, P<0.0001).aCMQ A.I.AverageD i f f e r e n c eV e n d o r 2-30 -25 -20 -15 -10 -5105-5-10-30 -25 -20 -15 -10 -5 0CorrelationBland-Altman plot:Inter-vendor agreement for GLS measurement2A 59-year-old male was admitted to the coronary care unit for acute chest pain occurring over the preceding 14 hours. ECG showed ST segment elevation over the inferior leads. Echocardiography showed severe hypokinesia over the inferior and inferoseptal segments from basal to mid levels, without obvious regional wall motion abnormality in the rest of the LV segments. Strain analysis with aCMQ A.I. showed not only markedly reduced longitudinal strains in the inferior, inferoseptal, and inferolateral segments, but also mildly impaired longitudinal strains in the anterior, anteroseptal, and anterolateral segments and the apical cap. Coronary angiogram revealed sequential severely stenotic culprit obstructions (70-90%) in the dominant right coronary artery (RCA) and multiple significant stenoses (50-70%) in the proximal and distal left anterior descending artery (LAD), with a non-dominant normal circumflex. This case illustrates how strain echocardiography can help identify infarction (indicated by positive strain, i.e., paradoxical systolic lengthening, in the basal inferior segment), peri-infarct schema in the RCA territory, and remote ischemia in the LAD territory. Percutaneous coronary intervention (PCI) was performed to the RCA and staged PCI was performed to the LAD.Case study one Inferior myocardialinfarctionCase study one illustrates how strain echocardiography can help identify infarction (coded blue), peri-infarct schema in the RCA territory, and remote ischemia in the LAD territory (salmon pink).3A 60-year-old female with history of well-controlled hypertension presented with recurrent episodes of syncope. Holter study revealed episodes ofnon-sustained ventricular tachycardia. ECG showed low QRS voltage and poor R wave progression in the precordial leads. Echocardiography showed concentric increase in LV wall thickness, ejection fraction = 47%, dilated left atrium, restrictive filling of mitral inflow, and thickened mitral and aortic valves. Bone marrow biopsy showed plasma cell dysplasia and rectal biopsy Case study twoAmyloidosisrevealed amyloid infiltration with positive Congo red stain, confirming the diagnosis of AL amyloidosis. Echocardiographic strain analysis showed markedlyreduced GLS (-6%) despite only mildly impaired ejection fraction. This case illustrates that GLS is more sensitive than ejection fraction to reveal LV systolic dysfunction and a relative “apical sparing” pattern of GLS is an easily recognizable, accurate, and reproducible method of differentiating cardiac amyloidosis from other causes of LV hypertrophy.ConclusionsStrain imaging holds great promise in providing incremental information on cardiac function in many clinical settings. With the advent of AIUS through a computerized automation technique to enhance efficiency and reproducibility, as well as validation of inter-manufacturer agreement in strain measurement algorithms, it is foreseeable that strain echocardiography can become a standard echocardiographic technique to evaluate cardiac function in today’s cardiology practices.Case study two shows GLS to be more sensitive than ejection fraction in revealing LV systolic dysfunction and that the relative “apical sparing” pattern of GLS is easily recognizable.Philips Healthcare is part of Royal Philips /healthcare **********************Printed in The Netherlands 4522 991 02471 * APR 2014© 2014 Koninklijke Philips N.V .All rights are reserved.Philips Healthcare reserves the right to make changes in specifications and/or to discontinue any product at any time without notice or obligation and will not be liable for any consequences resulting from the use of this publication.Please visit /epiq。
超声波清洗机发生器使用说明书
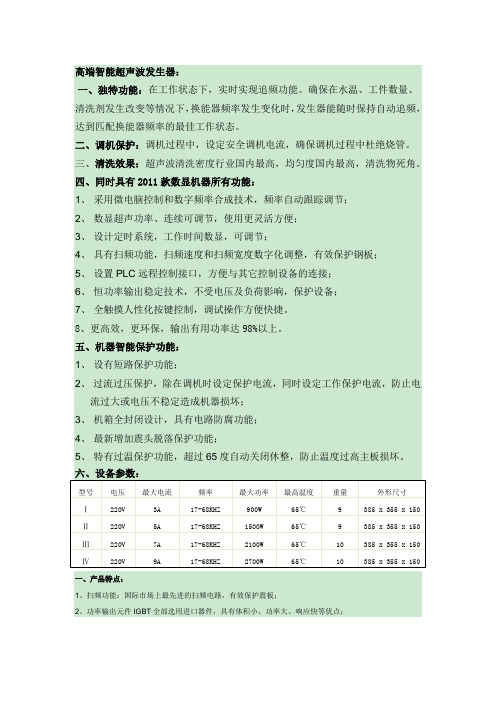
六、设备参数:
型号
电压
最大电流
频率
最大功率
最高温度
重量
外形尺寸
Ⅰ
220V
3A
17-68KHZ
900W
65℃
9
385 x 355 x 150
Ⅱ
220V
5A
17-68KHZ
1500W
65℃
9
385 x 355 x 150
ⅢHale Waihona Puke 220V7A17-68KHZ
高端智能超声波发生器:
一、独特功能:在工作状态下,实时实现追频功能。确保在水温、工件数量、清洗剂发生改变等情况下,换能器频率发生变化时,发生器能随时保持自动追频,达到匹配换能器频率的最佳工作状态。
二、调机保护:调机过程中,设定安全调机电流,确保调机过程中杜绝烧管。
三、清洗效果:超声波清洗密度行业国内最高,均匀度国内最高,清洗物死角。
四、同时具有2011款数显机器所有功能:
1、采用微电脑控制和数字频率合成技术,频率自动跟踪调节;
2、数显超声功率、连续可调节,使用更灵活方便;
3、设计定时系统,工作时间数显,可调节;
4、具有扫频功能,扫频速度和扫频宽度数字化调整,有效保护钢板;
5、设置PLC远程控制接口,方便与其它控制设备的连接;
6、恒功率输出稳定技术,不受电压及负荷影响,保护设备;
2100W
65℃
10
385 x 355 x 150
Ⅳ
220V
9A
17-68KHZ
2700W
65℃
10
385 x 355 x 150
一、产品特点:
超声波发生器使用说明
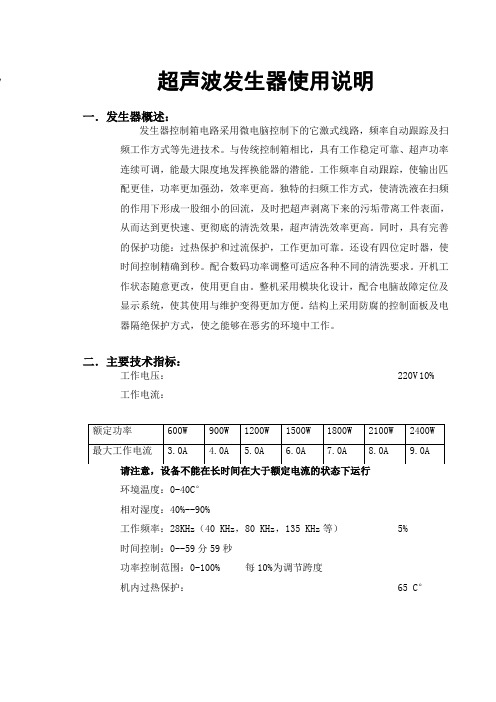
超声波发生器使用说明一.发生器概述:发生器控制箱电路采用微电脑控制下的它激式线路,频率自动跟踪及扫频工作方式等先进技术。
与传统控制箱相比,具有工作稳定可靠、超声功率连续可调,能最大限度地发挥换能器的潜能。
工作频率自动跟踪,使输出匹配更佳,功率更加强劲,效率更高。
独特的扫频工作方式,使清洗液在扫频的作用下形成一股细小的回流,及时把超声剥离下来的污垢带离工件表面,从而达到更快速、更彻底的清洗效果,超声清洗效率更高。
同时,具有完善的保护功能:过热保护和过流保护,工作更加可靠。
还设有四位定时器,使时间控制精确到秒。
配合数码功率调整可适应各种不同的清洗要求。
开机工作状态随意更改,使用更自由。
整机采用模块化设计,配合电脑故障定位及显示系统,使其使用与维护变得更加方便。
结构上采用防腐的控制面板及电器隔绝保护方式,使之能够在恶劣的环境中工作。
二.主要技术指标:工作电压:220V 10%工作电流:环境温度:0-40C°相对湿度:40%--90%工作频率:28KHz(40 KHz,80 KHz,135 KHz等)5%时间控制:0--59分59秒功率控制范围:0-100% 每10%为调节跨度机内过热保护:65 C°三.面板功能说明:分体式机型面板四.使用说明:(以分体式机型为例,整体式机型功能相同)面板功能介绍:LCD 显示屏幕:用于显示定时,功率大小,频率,电流等正常工作状态 ON/OFF 键:用于控制发生器的工作或暂停; SET 键:设定键,用于选择所要调整的功能; +键:在设置参数时增加数值; –键:在设置参数时减少数值6.详细参数:采用他激式电路,先进的单片机控制,高亮度液晶(LCD )屏幕显示,结构小巧,外形美观大方定性高,通用性好,能量转换效率高。
菜单式操作,调整、使用方便简单可显示:功率、清洗时间、频率、电流。
数字式功率调节:10%~100%自由调节 频率自动跟踪、扫频设置定时加 频率加 电源开关增加功率减少功率 功能显示定时减频率减启动/停数字调频功能清洗定时功能低电流报警功能过电流保护功能自动开关机功能频率范围宽:20KHZ~40KHZ通用功率范围宽:600~1500W通用外形尺寸:(LXWXH)380X300X150mm若选用高频(60KHZ以上频率)或大功率请致电本公司操作说明将机器安放在通风干燥处,接好电源和输出接头,打开电源,显示工作状态;1.功率设定:按一下“SET”键,屏幕显示“POWER SET(功率设定)”按“+、-”键调整功率大小;设定完成后约5秒自动返回工作模式;Power SetP=100%2.定时模式:按两下“SET”键,屏幕显示“TIMER SET(定时设定)”,此时按“+、-”键调整到所需时间,设定好后约5秒自动记忆。
多频超声波发生器使用说明书
多频超声波发生器HM-1000操作说明书(版本)一、性能简介1、国际领先的IGBT驱动模式,保证功率的均衡及稳定。
2、具有软性启动功能,可防止主机瞬间启动电流过大。
3、具有外部驱动(Remote Control)功能,方便远程操控。
4、具扫频功能(约±1KHz)。
5、三种频率自动或手动变频交换输出(爆洗功能),清洗效果更佳。
6、通过频率的数字生成和调节,在10%到100%的范围内可调的输出功率始终可用,恒定的输出功率和间隔功能有效确保清洗物精确的超声波辐射。
7、LED功率和状态指示灯以及显示详细数字的LCD数码屏,确保操作方便安全。
8、发生器系列配有不同的防护功能,例如智能冷却系统以及短路,空转和过载保护功能,以确保最高的工作安全性。
9、绝佳散热设计,可适应于长时间清洗运行。
10、防腐蚀机箱设计,运行不受使用环境的制约。
二、主要技术参数工作电压:AC220V 50/60Hz ±10%工作电流:请注意,设备不能在长时间在大于额定电流的状态下运行。
工作电流工作环境:0-40℃相对湿度:40%-90%工作频率:40/80/120KHz ±10%时间控制:0--59分59秒功率控制范围:占空比调节1-99%外型尺寸:H X W X L=138X308X428二、面板功能说明电源开关:电源开关为整机的总电源开关,往上拨为开,往下拨为关。
频率切换:频率切换多档开关为控制超声波工作频率的开关,AT为自动频率切换(40/80/120KHz),MT为手动频率切换分为三种工作频率段F1-40KHz、F2-80KHz、F3-120KHz。
功率调节:功率调节电位器为控制超声波输出功率大小的电位器,顺时针调节为从小到大,逆时针调节为从大到小,可调整超声功率范围为10—100%。
功率调节指示:功率调节指示分为10个LED指示档位,根据功率调节电位器调整功率的大小亮LED,当全部都灭时,超声波输出功率为0;当全部都亮时,超声波输出功率为100%。
超声发生器5072PR-73PR-77PR-(EN)中文说明书
型号5072PR,5073PR,5077PR超声波发生器/接收器用户手册根据欧洲废电子电气指令2002/96 / EC设备,此符号表示产品不得作为未分类处理市政废物,但应单独收取。
请参考您当地的奥林巴斯NDT您所在国家/地区的退货和/或收款系统的经销商。
所有©2008 Olympus NDT。
所有。
本手册的任何部分不得以任何形式或方式复制或传播,电子或机械,包括复印,录音或任何信息存储和检索系统,未经奥林巴斯NDT书面许可,除非允许依法。
有关信息,请联系:infoOlympusNDT.。
Panametrics,Panametrics-NDT和Panametrics-NDT标志是Panametrics的商标公司本文档中提及的其他产品名称可能是其各自的商标公司,仅供鉴定。
印在美利坚合众国。
保修5072PR,5073PR和5077PR超声波脉冲发生器接收机已经设计和制造为优质产品。
收到证件后,仔细检查资料运输期间可能发生的外部或部损坏。
通知承运人由于承运人通常承担损害赔偿责任,因此立即交付任何损失装船。
保存包装材料,运单和其他运输单据建立损害索赔。
通知运营商后,请联系奥林巴斯NDTTM,以便我们可以协助损坏索赔,并在必要时提供更换设备。
奥林巴斯NDT保证5072PR,5073PR和5077PR超声波脉冲发生器接收器在材料和工艺上没有缺陷,为期一年(十二个月)从装运之日起。
本保修仅适用于已使用的设备方式如本说明书所述,并没有遭受过度滥用,尝试未经授权的修复或修改。
在本保修期,奥林巴斯无损检测责任仅限于修理或更换一个有缺陷的单位。
奥林巴斯NDT 不保证5072PR,5073PR和5077PR超声波脉冲发生器接收器适合使用或适用任何特定的应用或目的。
奥林巴斯NDT不对后果或不承担任何责任偶然的损害,包括财产损失和/或人身伤害。
除了我们标准一年保修,奥林巴斯NDT还提供可选的两年保修(略)。
目录保修................................................. .................................................. . (iii)目录 ............................................... .. (v)一般说明.............................................. .. (1)1.1特别声明和印刷公约............................................ (2)1.2如果您有文档评论............................................ . (3)史............................................... .................................................. (3)1.4技术帮助............................................... .................................................. (4)1.5产品使用............................................... .................................................. (4)开箱检查............................................. .. (5)仪器控制和I / O连接器......................................... ...........3.1前面板3.1.1电源开关............................................. .................................................. .. (9)3.1.2脉冲重复频率控制(PRF)....................................... .. (9)3.1.3脉冲电压(5077PR)......................................... ............................................103.1.4传感器频率选择控制(5077PR)....................................... (11)3.1.5能量(5072PR,5073PR)......................................... (11)3.1.6阻尼(5072PR,5073PR)......................................... (12)3.1.7增益/衰减(dB)......................................... .................................................143.1.8低通滤波器............................................ .................................................. . (14)3.1.9高通滤波器............................................ .................................................. (14)3.1.10模式切换............................................. .................................................. (15)3.1.11 T / R连接器........................................... .................................................. (15)器............................................. .................................................. .. (15)3.2后面板............................................... .................................................. .....................153.2.1 RFOUT ............................................. .................................................. .................163.2.2 EXT TRIGIN ............................................ .................................................. (16)3.2.3 + SYNCOUT ............................................ .................................................. . (17)4.规格............................................... . (19)5.操作............................................... .................................................. (23)5.1示波器要求............................................... . (23)5.2初始设置............................................. .................................................. .....................235.3通过传输............................................. .................................................. .....295.4调谐峰波幅方波脉冲(仅限5077PR) (34)5.5传感器的电压和功率限制......................................... (34)6.故障排除与维护............................................. . (37)6.1基本故障排除............................................... .................................................. (37)6.2克服电噪声干扰............................................. . (37)6.3申请协助............................................... .................................................. ...38文件评论................................................ .. (39)1.一般说明型号5072PR,5073PR和5077PR手动控制超声波脉冲发生器 - 接收器为常规和高频应用提供构建模块。
超声波发生器调试说明书
超声波发生器调试说明书一.产品外型图示使用本产品前请参照本说明书调试请保存好此说明书二.技术参数1.输出功率:0---3000W可选2.输入电压:180---265V AC. 50/60Hz3.工作温度:30---55度4.环境温度:10---35度(不结露)5.输出谐波参数:97%(Min)6.启动峰值电流(3000W负载):小于等于20A7.工作频率:20K---250KHz(高于250K需要订做)8.远程控制电压:0V低电平控制,低电压关闭,恢复后软启动。
9.MOS/IGBT最高温度:50度(3000W负载,环境温度为25度时测试)。
三.功能说明:1.功率调节:调节功率电位器,功率可以从零到额定功率可调。
2.电源开关:1为开启,O为关断。
3.显示窗:显示发生器工作时的电流。
4.电源线:连接机器与市电的连接器件。
注意接地要良好。
5.输出接线口:超声清洗机与发生器的连接处。
注意正负极性不可接反。
6.远程控制:为发生器的软启动接口,不断电源来控制超声波的启停。
使用时只需把插头内的短接线拆除外接一个开关或继电器就行。
给它一个开关信号。
7.散热风扇:为主功率器件散热。
四.机器显示及接口图标1.面板图电流显示频率/时间显示时间增加时间减少功能键开关键功率调节电源开关按键说明:电流显示:显示当前工作的电流。
频率/时间、显示:显示当前工作的频率或时间,当KHZ指示灯亮时显示的是频率,当TIME指示灯亮时显示的是时间。
时间为倒计时。
功率调节:工作的时候用来调输出功率的大小。
电源开关:是发生器的总电源开关,向上为开向下为关。
增加键:用来调节设定时间增加的。
减少键:用来调节设定时间减少的。
功能键:切换频率和时间显示的。
如果当前显示的是时间,按一下功能键就显示频率,反之按一下就显示时间。
在切换频率和时间显示的时候超声波会停止工作,所以超声波工作的时候不要操作此按键。
开关键:用来开启或关闭超声波的。
按一下开启,再按一下关闭。
超声波测速仪用户手册说明书
MechanicsAcousticsDebye-Sears EffectDETERMINE THE VELOCITY OF ULTRASONIC WAVES IN LIQUIDS.UE1070550 04/16 JSBASIC PRINCIPLESThe diffraction of light by ultrasonic waves in liquids was predicted by Brillouin in 1922, and the effect was con-firmed experimentally in 1932 by Debye and Sears and also by Lucas and Biquard . It is caused by the periodic variations in the refractive index of the liquid that are produced by ultrasonic waves. If a light beam is passed through the liquid perpendicular to the ultrasound direc-tion, the arrangement acts as a phase grating, which moves depending on the velocity of sound. Its grating constant corresponds to the wavelength of the ultra-sound, and thus depends on its frequency and the veloci-ty of sound in the medium. The movement of the phase grating can be neglected if the effect is observed on a screen at a large distance.In the experiment, a vertically orientated generator couples ultrasonic waves at frequencies between 1 MHz and 12 MHz into the test liquid. A monochromatic parallel light beam pass-es through the liquid in the horizontal direction and is diffract-ed by the phase grating (see fig. 1). The diffraction pattern contains several diffraction maxima spaced at regular dis-tances (see fig. 2).The k th-order maximum of the diffraction pattern is found at the diffraction angle αk , defined by(1) SLk tan λλ⋅=αk λL : ight wavelength, λS : ultrasound wavelength.Thus, the ultrasound wavelength λS can be determined from the separation between the diffraction maxima. Furthermore, according to the relationship(2) S λ⋅=f cit is possible to calculate the velocity of sound c in the liquid, since the frequency f of the ultrasonic waves is also known.Fig. 1: D iagram showing the diffraction of light by a phasegrating that is produced in a liquid by ultrasonic wavesFig. 2: D iffraction pattern caused by the diffraction of light at aphase grating produced in a liquid by ultrasonic wavesLIST OF APPARATUS1 Ultrasonic cw Generator with Probe 1002576 (U100061) 1 Test Vessel, Complete 1002578 (U10008)1 Laser Diode for D-S Effect, Red 1002577 (U10007)1 Laser Diode for D-S Effect, Green 1002579 (U10009)1 Pocket Measuring Tape,2 m 1002603 (U10073)1 Ultrasonic Coupling Gel 1008575 (XP999)SET-UP∙Fill the test vessel with distilled water and place it about3 m from the projection screen.∙Mount the multi-frequency probe vertically in the holder of the test vessel and connect it to the PROBE output of the ultrasonic generator (see Fig. 3).∙Mount the red laser diode in the laser holder of the test vessel and connect it to the LASER output of the ultra-sonic generator.Fig. 3: Experiment set-up for the diffraction of light at a phase grating produced in a liquid by ultrasonic waves EXPERIMENT PROCEDURE∙Measure the distance s between the multi-frequency probe and the screen.∙Switch on the ultrasonic cw generator.∙Switch on the laser and the multi-frequency probe.∙Set the frequency to 1 MHz.∙Adjust the amplitude of the transducer signal, and by means of the three adjusting screws of the transducer holder adjust the orientation of the multi-frequency probe so that standing waves are generated.∙On the screen measure the distance x2k between the –k th order and the +k th order diffraction maxima.∙Increase the frequency in steps of 1 MHz up to 12 MHz, and for each frequency measure the distance x2k and de-termine the diffraction order k.∙Replace the red laser diode with a green one and make a similar set of measurements. SAMPLE MEASUREMENTS AND EVALUA-TIONs =325 cmTable 1: Experiment data with light of wavelength λL = 652 nm (red laser)Table 2: Experiment data with light of wavelength λL = 532 nm (green laser)It is necessary to measure the distance s between the ultra-sound generator and the screen used to observe the diffrac-tion pattern, and the distance x2k between the -k th and the +k th diffraction maxima. From these two distances, it is possi-ble to calculate the diffraction angle αk for the k th-order maxi-mum, given by:sx⋅=α2tan2kk.This leads to the following equation for determining the ultra-sound wavelength λS:L2kS2λ⋅⋅⋅=λxsk.This is the equation by which the sound wavelengths in the right-hand column of both tables were calculated.3B Scientific GmbH, Rudorffweg 8, 21031 Hamburg, Germany, Figure 4 shows the calculated sound wavelength as a function of the frequency of the ultrasonic waves. The hyperbola curve was calculated according to Equation (2) as:fc =λS with s m 1482=cThe velocity of sound c determined by this curve-fitting proce-dure is in excellent agreement with the literature value.510f / M H zλ μ/ mFig. 4: S ound wavelength λS in water as a function of the fre-quency f。
医疗超声仪使用方法说明书
医疗超声仪使用方法说明书一、产品概述医疗超声仪(以下简称“仪器”)是一种用于医学影像采集和分析的专业设备。
本使用说明书将详细介绍仪器的使用方法和注意事项,以帮助用户正确、安全地操作仪器。
二、仪器结构和功能1. 仪器结构仪器由以下部分组成:- 主机:包含仪器的核心控制和处理模块;- 显示屏:用于显示采集的超声影像和相关数据;- 手持探头:用于接触患者的皮肤,采集超声信号;- 操作面板:用于用户选择操作模式、调节参数等。
2. 仪器功能仪器具备以下功能:- 采集超声影像:通过手持探头接触患者体表,采集超声信号并生成图像;- 影像调节:用户可以调节影像的亮度、对比度等参数,优化显示效果;- 数据分析:仪器可对采集的数据进行实时分析和计算,提供相关测量结果;- 存储和传输:仪器支持影像和数据的存储,并可通过接口进行传输和共享。
三、使用准备1. 环境要求在使用仪器之前,请确保以下环境满足要求:- 温度:仪器应在15-30摄氏度的环境中使用;- 湿度:相对湿度应在30%-75%范围内;- 电源:仅使用额定电压和频率的电源供电,确保电源稳定。
2. 前期准备在使用仪器之前,请完成以下准备工作:- 检查仪器外观,确保无异常;- 打开仪器电源,并等待系统启动完成;- 连接手持探头,并确认连接稳固。
四、操作流程1. 操作界面仪器启动后,将显示操作界面。
界面包括图像显示区、参数调节区等。
用户可根据需要,调整操作界面和显示设置。
2. 采集超声影像(1)选择采集模式:根据具体需要,选择超声模式、扫描模式等;(2)定位手持探头:将手持探头移到待检部位,并确保与皮肤充分接触;(3)开始采集:点击相应按钮或触摸屏幕,开始采集超声信号;(4)影像调节:根据需要,调节图像亮度、对比度等参数;(5)保存影像:若满意采集结果,可选择保存影像。
3. 数据分析和测量仪器可对采集的数据进行进一步分析和测量,包括但不限于测量距离、测量角度等操作。
等离子发生器_操作说明书.
同样的,本公司也不对焊接缺陷和焊接错误负责。
在指定的温度范围外使用和存储焊接焊接电源将被视为没有遵守“指定使用方 法”。本公司将不对由此导致的任何损害负责。
外部环境温度范围: - 操作时:-10℃ 到 +40℃(14℉ 到 104℉) - 运输和存储时:-25℃ 到 +55℃(-13℉ 到 131℉)
“重要”表示实际的线索和其他有用的特殊信息,并非指示危险情况的标示。
无论你何时看到以上所示的那些符号,都要更加注意手册中的内容。
该焊接电源遵照国家相关法律制造,并且符合各项安全标准的要求。然而不
或者错误的使用仍然会导致以下危险: - 操作者或者他人的生命和健康的危险 - 属于操作者或者拥有者的设备和有形资产的危险 - 设备的工作效率的降低
切勿将电极(焊条、钨极、焊丝)浸入液体中冷却,开机时切勿碰触电极。
两台焊接电源的电极之间有可能产生二次回路的开路电压,同时触摸两根电 极是致命的。
定期派专业电工检查焊接电源的焊接电源和供电线缆,并确保接地保护连接 正常。
仅在焊接电源具有接地保护时使用焊接电源,仅使用具有接地保护插头的插 座。
V
焊接电源和电流 的危害
焊接电源 - 已经阅读和理解了指导手册中的“安全条例”和“警告”部分,并且合乎其
要求 - 并通过了相关的培训 定期检查以确保操作人员小心谨慎。
操作开始前确认每个操作者都能做到: - 遵守最基本的工作地点安全条例和突发事件预防规则 - 阅读指导手册中的“安全条例”和“警告”部分,签字确认他们已经理解并遵
III
个人及他人 防护 (续上页)
有毒气体和 粉尘的危害
“防护服”还应该具备以下特征: - 带有可更换滤光镜的安全面罩,以阻止 UV-射线和
- 1、下载文档前请自行甄别文档内容的完整性,平台不提供额外的编辑、内容补充、找答案等附加服务。
- 2、"仅部分预览"的文档,不可在线预览部分如存在完整性等问题,可反馈申请退款(可完整预览的文档不适用该条件!)。
- 3、如文档侵犯您的权益,请联系客服反馈,我们会尽快为您处理(人工客服工作时间:9:00-18:30)。
型号5072PR,5073PR,5077PR超声波发生器/接收器用户手册根据欧洲废电子电气指令2002/96 / EC设备,此符号表示产品不得作为未分类处理市政废物,但应单独收取。
请参考您当地的奥林巴斯NDT您所在国家/地区的退货和/或收款系统的经销商。
版权所有©2008 Olympus NDT。
版权所有。
本手册的任何部分不得以任何形式或方式复制或传播,电子或机械,包括复印,录音或任何信息存储和检索系统,未经奥林巴斯NDT书面许可,除非允许依法。
有关信息,请联系:*******************。
Panametrics,Panametrics-NDT和Panametrics-NDT标志是Panametrics的商标公司本文档中提及的其他产品名称可能是其各自的商标公司,仅供鉴定。
印在美利坚合众国。
保修5072PR,5073PR和5077PR超声波脉冲发生器接收机已经设计和制造为优质产品。
收到证件后,仔细检查资料运输期间可能发生的外部或内部损坏。
通知承运人由于承运人通常承担损害赔偿责任,因此立即交付任何损失装船。
保存包装材料,运单和其他运输单据建立损害索赔。
通知运营商后,请联系奥林巴斯NDTTM,以便我们可以协助损坏索赔,并在必要时提供更换设备。
奥林巴斯NDT保证5072PR,5073PR和5077PR超声波脉冲发生器接收器在材料和工艺上没有缺陷,为期一年(十二个月)从装运之日起。
本保修仅适用于已使用的设备方式如本说明书所述,并没有遭受过度滥用,尝试未经授权的修复或修改。
在本保修期内,奥林巴斯无损检测责任仅限于修理或更换一个有缺陷的单位。
奥林巴斯NDT不保证5072PR,5073PR和5077PR超声波脉冲发生器接收器适合使用或适用任何特定的应用或目的。
奥林巴斯NDT不对后果或不承担任何责任偶然的损害,包括财产损失和/或人身伤害。
除了我们标准一年保修,奥林巴斯NDT还提供可选的两年保修(略)。
目录保修................................................. .................................................. . (iii)目录 ............................................... .. (v)一般说明.............................................. .. (1)1.1特别声明和印刷公约............................................ (2)1.2如果您有文档评论............................................ . (3)史............................................... .................................................. (3)1.4技术帮助............................................... .................................................. (4)1.5产品使用............................................... .................................................. (4)开箱检查............................................. .. (5)仪器控制和I / O连接器......................................... ...........3.1前面板3.1.1电源开关............................................. .................................................. .. (9)3.1.2脉冲重复频率控制(PRF)....................................... .. (9)3.1.3脉冲电压(5077PR)......................................... ............................................103.1.4传感器频率选择控制(5077PR)....................................... (11)3.1.5能量(5072PR,5073PR)......................................... (11)3.1.6阻尼(5072PR,5073PR)......................................... (12)3.1.7增益/衰减(dB)......................................... .................................................143.1.8低通滤波器............................................ .................................................. . (14)3.1.9高通滤波器............................................ .................................................. (14)3.1.10模式切换............................................. .................................................. (15)3.1.11 T / R连接器........................................... .................................................. (15)器............................................. .................................................. .. (15)3.2后面板............................................... .................................................. .....................153.2.1 RFOUT ............................................. .................................................. .................163.2.2 EXT TRIGIN ............................................ .................................................. (16)3.2.3 + SYNCOUT ............................................ .................................................. . (17)4.规格............................................... . (19)5.操作............................................... .................................................. (23)5.1示波器要求............................................... . (23)5.2初始设置............................................. .................................................. .....................235.3通过传输............................................. .................................................. .....295.4调谐峰波幅方波脉冲(仅限5077PR) (34)5.5传感器的电压和功率限制......................................... (34)6.故障排除与维护............................................. . (37)6.1基本故障排除............................................... .................................................. (37)6.2克服电噪声干扰............................................. . (37)6.3申请协助............................................... .................................................. ...38文件评论................................................ .. (39)1.一般说明型号5072PR,5073PR和5077PR手动控制超声波脉冲发生器 - 接收器为常规和高频应用提供构建模块。
每仪器设计用于优异的低噪声接收器响应和高性能脉冲发生器控制。
当与适当的传感器和模拟或数字示波器一起使用时,这些脉冲发生器有助于超声波探伤,厚度测量,材料表征,和换能器表征。
应用包括:•缺陷检测•厚度测量•声速测量(用于计算弹性常数)•频谱分析•传感器表征•用于监测材料或工艺的其他测量这些仪器的脉冲发生器部分产生短,大振幅或方波电当应用于超声换能器时,可选择宽度的脉冲被转换成短超声波脉冲。