
FVCOM2016_abstracts_7Oct2016
A high resolution hydrodynamic model for the greater Port Hawkesbury areaAdam Drozdowski1, Donghui Jiang1, Edward Horne1, Fred Page2, David Greenburg11 Bedford Institute of Oceanography, Fisheries and Oceans Canada, Dartmouth, NS, B2Y 4A2, Canada.2 St. Andrews Biological Station, St. Andrews, NB, E5B 2L9, CanadaA high resolution regional model for Port Hawkesbury Nova Scotia is being developed in support of the World Class Tanker Safety project with the goal of providing real time hydrographic products relevant to navigation and operational response near Port Hawkesbury and approaches. The modelling work utilizes an unstructured mesh and is based on the FiniteV olume Community Ocean Model (FVCOM). Horizontal resolution varies from 10’s of meters in narrows channels and small bays to hundreds of meters on the shelf. The model is forced with winds and tides. Validations indicate good agreement with observed vertically averaged tidal currents and elevation but mixed results for in-situ currents. The effectiveness of further developments, such as enlarging the model domain and including high resolution HRDPS winds, are explored.Comparison of open boundary condition options for modeling at Shinnecock Bay, Long Island, New YorkJeong Eun Ahn1, Anne Dudek Ronan11Civil and Urban Engineering, NYU Tandon School of Engineering, NY, USAOpen boundary conditions of hydrodynamic models are often specified using global tide models. Although these models agree within 2 to 3 cm in the deep ocean, there are larger differences in shallow waters (Shum et al. 1997). The aims of this study are to (1) compare two ocean tide models (LeProvost and TPXO) and (2) evaluate the differences between two hydrodynamic models (ADCIRC and FVCOM). Each model was forced at the open boundary with five major tidal constituents (M2, N2, S2, O1, K1) in different ways.The study area is Shinnecock Bay on the south shore of Long Island, New York, which is connected to the Atlantic Ocean. This study used the mesh that was developed by the U.S. Army Corps of Engineers (Militello and Kraus, 2001) and distributed at the ADCIRC website (/home/documentation/example-problems/shinnecock-inlet-nywith- tidal-forcing-example/).The tidal forcing at the open boundary was generated using LeProvost and TPXO. The extracted amplitudes and phases of the tidal constituents were compared at the open boundary, which were located in shallow waters. The maximum standard deviation of amplitudes is consistent with prior work of deep waters even though it is in shallow waters.Model surface elevations predicted by both ADCIRC and FVCOM were compared to NOAA-predicted water surface elevation at a tidal station in the model domain. The results were sensitive to the choice of global tide model as well as physical mixing, bottom friction coefficients, and discretization algorithm. FVCOM also was forced at the open boundary by elevation time series and this option produced the best match to the NOAA prediction for this case, which is focusing on tidal circulation rather than other physical processes.ReferencesMilitello, A. and N.C. Kraus. 2001. Shinnecock Inlet, New York, Site Investigation Report 4, Evaluation of Flood and Ebb Shoal Sediment Source Alternatives for the West ofShinnecock Interim Project, New York. Coastal Inlets Research Program, Tech. Rpt.CHL-98-32, U.S. Army Engineer Research and Development Center, Vicksburg, MS. Shum, C.K., P.L. Woodworth, O.B. Andersen, G.D. Egbert, O. Francis, C. King, S.M, Klosko,C. Le Provost, X. Li, J-M. Molines, M.E. Parke, R.D. Ray, M.G. Schlax, D.Stammer, C.C.Temey, P. Vincent , and C.I. Wunsch. 1997. Accuracy assessment of recent ocean tidemodels. J Geophys Res102(C11): 25173–25194.Tidal propagation in Fraser River EstuaryYongsheng Wu1, Mitchell O'Flaherty-Sproul1, Charles Hannah2, Xiaoyi Wang, Zeliang Wang, de Lange Boom Bodo31 Marine Ecosystem Section, Ocean and Ecosystem Sciences Division, Fisheries and Oceans Canada, Bedford Institute of Oceanography, Dartmouth, Nova Scotia, B2Y 4A2, Canada2 Institute of Ocean Sciences, Fisheries and Oceans Canada, Sidney, British Columbia, V8L 4B2, Canada.3. Institute of Ocean Sciences, Fisheries and Oceans Canada, Sidney, British Columbia, V8L4B2, Canada. CHSInformation of tidal propagation in estuaries is of scientific and engineering importance for tidal prediction, offshore engineering design, marine navigation, sediment transport, and estuarine ecosystem. In the present study, propagation of tides in the Fraser River has been investigated with a 3-D hydrodynamics model based on FVCOM, which covers from the estuary to about 100 km upstream of the river with a horizontal resolution as high as 10 m. The model was validated with observational data including the water elevations and currents, and good agreement was obtained. Our results indicate that principal tides attenuate from the estuary to upstream along the river with increasing river discharges. However, over tides and compound tides amplified along the river first and then decreases, the turning location is associated with the relative balance between the nonlinear effect and the attenuation of principal tides. Using model results, change mechanisms of tides are analyzed.On the Momentum Balance of Tampa BayJing Chen1, Robert H. Weisberg1, Lianyuan Zheng2, Yonggang Liu11College of Marine Science, University of South Florida, St. Petersburg, FL2 NOAA-NOS, Silver Spring, MDIn its simplest sense, the momentum balance for the non-tidal, density driven circulation of a partially mixed estuary is generally considered to be between the pressure gradient force and vertical friction, the result being a two layered mean circulation. However, all estuaries tend to have geometric complexities that may alter this simplistic view. Here we apply the FVCOM to diagnose the momentum balance distribution for Tampa Bay, a partially mixed estuary on Florida’s west coast. This is the fourth i n a series of analyses, the three previous ones being on the circulation, the flushing times and the salt balance. With resolution as fine as 20m, the model resolves the channels, inlets, bridge causeways and other geometric complexities. Detailed comparisons between the model simulated circulation and observations over time scales associated with the tidal, wind and density driven modes of circulation provide justification for the other analyses. Point by point, three-dimensional momentum equation balances demonstrate that while the general expectation for non-tidal estuarine flow is met, the actual distributions of terms in the momentum equation are quite complex when real geometries are considered.Evaluating the linkage between circulation and spatial water quality patterns in the nearshore of South-eastern Georgian BayLakshika Girihagama1, Mathew Wells1, Jingzhi Li1, and Todd Howell21 Dept. of Physical & Environmental Sciences, University of Toronto Scarborough, 1265 Military Trail, Toronto, ON M1C 1A4, Canada.2Environmental Monitoring and Reporting Branch, Ontario Ministry of the Environment, 125 Resources Road, Toronto, ON M9P 3V6, Canada.Flushing mechanisms - driven by the natural circulation - play a dominant role in understanding the impact of land-based phosphorus on the nearshore water quality of South-eastern Georgian Bay, Ontario. Georgian Bay is located east of the main body of Lake Huron and has a surface area of 15,000 km², and contains approximately 30,000 islands. Generally the water quality is very good, but there are concerns about the impact of ongoing development upon the many inlets and bays along the eastern shore. Detailed observations of nearshore water quality (e.g. conductivity, phosphorous, chlorophyll) from Shwanaga and Moon River Island regions show pronounced gradients, presumably driven by water circulation patterns. This region experiences seasonal thermal stratification, and observations from the current moorings show a pronounced barotropic variability in currents that is tied to variability in surface water levels. The water level measurements from Shwanaga Islands level loggers show a dominant period of 12.4 h, corresponding to the dominant surface seiche mode of Georgian Bay. The numerous islands on the topographically complex eastern shore of Georgian Bay make it a challenging setting to understand water circulation patterns. In order to obtain a better understanding of the flushing dynamics and the resulting phosphorus-productivity gradient across the South-eastern Georgian Bay, a circulation model will be developed using FVCOM (Finite Volume Coastal Ocean Model) to help interpret and synthesize the field data.West Florida Shelf Upwelling: Origins and PathwaysRobert H. Weisberg1, Lianyuan Zheng2, Yonggang Liu11College of Marine Science, University of South Florida, St. Petersburg, FL2NOAA-NOS, Silver Spring, MDOften described as oligotrophic, the west Florida continental shelf supports abundant fisheries, experiences blooms of the harmful algae, Karenia brevis and exhibits subsurface chlorophyll maxima evident in shipboard and glider surveys. Renewal of inorganic nutrients by the upwelling of deeper ocean water onto the shelf may account for this, but what are the origins and pathways by which such new water may broach the shelf break and advance toward the shoreline? We address these questions via numerical model simulations of water parcel trajectories using the West Florida Coastal Ocean Model (WFCOM) that downscales from the deep ocean, across the continental shelf and into the estuaries by nesting FVCOM in HYCOM. Novel to our approach is the calculation of trajectories that are kinematical consistent with local isopycnic surfaces. Focus is on 2010, when the west Florida shelf was subjected to an anomalously protracted period of upwelling caused by Gulf of Mexico Loop Current interactions with the shelf slope. Origins and pathways are determined by integrating trajectories over successive 45 day intervals, beginning from different locations along the shelf break and at various locations and depths along the shelf slope. Waters upwelling across the shelf break are found to originate from relatively shallow depths along the shelf slope. Even for the anomalous 2010 year, much of this upwelling occurs from about 150 m and above, although waters may broach the shelf break from 300 m depth, particularly in the Florida Panhandle. Such inter-annual renewal of west Florida shelf waters appears to have profound effects on west Florida shelf ecology.VALIDATING FVCOM 30 YEAR HINDCAST WITH SURFACE DRIFTER AND BOTTOM TEMPERATURE AND VELOCITY DATA FOR APPLICATION TO FISH RECRUITMENT AND STOCK MANAGEMENT IN GULF OF MAINEVitalii A. Sheremet1, James P. Manning11NOAA, Northeast Fisheries Science Center, 166 Water Street, Woods Hole, MA 02543We developed programming tools in Python language for accessing FVCOM model data, performing cubic Bezier-Bernstein triangular grid interpolation, drifter tracking, and larvae retention analysis. We created particle trajectory dataset for weekly launches over Georges Bank area for years 1978-2010 pertinent for fisheries recruitment analysis. FVCOM simulation results were validated by comparing with temperature and velocity records derived from lobster traps deployed as a part of the Environmental Monitors on Lobster Trap (eMOLT) program and by comparing with surface drifter deployments. It was found that the FVCOM model is a useful tool for fisheries egg and larvae transport analysis in the upper ocean. Near bottom FVCOM shows somewhat warmer temperatures and less realistic currents compared to observations. It was found that using the depth averaged currents of FVCOM predicts reasonable dispersion characteristics of fish egg and larvae at early stages of evolution, with int erannual variability amplitudes similar to the observed ones. However, direct correlations between particle retention index and recruitment survey data for each year were not found. This suggests that the larvae transport is just one mechanism among many affecting the recruitment.Update and Improvements of FVCOM: A release of FVCOM version 4.0Changsheng Chen1, Robert C. Beardsley2 and Jinhua Qi11School for Marine Science and Technology, University of Massachusetts-Dartmouth, New Bedford, MA 027422Department of Physical Oceanography, Woods Hole Oceanographic Institution, Woods Hole, MA 02543Our team of University of Massachusetts-Dartmouth and Woods Hole Oceanographic Institution researchers has been continuing to develop and improve the prognostic, free-surface, three-dimensional primitive equations-based unstructured-grid, Finite-Volume Community Ocean Model (FVCOM) since 1999. The updated version 4.0 of FVCOM has become a fully ice-current-wave-sediment coupled model system with options for multi-domain nesting, two-way air-sea interactions and offline or online integration of ecosystem and water quality models. Several new modules are implemented, which include: cohesive sediments, ice embedding, and surface waves applicable for global application. As examples, a global-regional-coastal-estuarine-wetland nested FVCOM model system was developed to resolve and examine multi-scale oceanic responses to climate change. The unstructured grid used in the system provides accurate fitting of the complex coastal geometry and steep slope topography with spatial scales up to 2 km in the global ocean to 10 m over wetlands. This nested model system was validated by a 38-year hindcast simulation through comparisons with available observational data. It was served as a framework to establish the Northeast Coastal Ocean Forecast System (NECOFS). The NECOFS is an integrated atmosphere-ocean-wave model system in which the ocean model domain covers the northeast US coastal region with a horizontal resolution of 10-15 km in the open ocean, 1-5 km on the shelf, and down to 20 m in estuaries, inner bays, inlets and harbors. The system produces 3-day forecast fields of surface weather, surface icing, waves, water level, temperature, salinity, currents and storm-induced coastal inundation; with daily updating using data assimilated fields whenever field data are available. It was validated for both hindcast simulation over 1978-2015 and forecast operations for storm-induced inundation. Built on the same framework, we have also established an Arabian Gulf-Sea of Oman atmosphere-ocean forecast system (named AGSO-FVCOM). The AGSO-FVCOM is configured with a horizontal resolution varying from ~100 m to 10 km. This system runs through nesting with Global-FVCOM and has been placed into the 24/7 forecast operations since March 2015.Reconstructing turbulent heat fluxes over Lake Erie during the extreme lake effect snow in November 2014Ayumi Fujisaki-Manome1, Lindsay Fitzpatrick1, Andrew Gronewold2, Eric Anderson2, Chris Spence3, Jiquan Chen4, Changliang Shao41Cooperative Institute for Limnology and Environmental Research2Great Lakes Environmental Research Laboratory3Environment Climate Chance Canada4Michigan State UniversityThis study examined the evaporation from Lake Erie during the record lake effect snowfall event, November 17-20, 2014 by reconstructing heat fluxes and evaporation rates over Lake Erie using the unstructured grid, Finite-Volume Community Ocean Model (FVCOM). Nine different model runs were conducted using combinations of three different flux algorithms; the Met Flux Algorithm (COARE), a method routinely used at NOAA’s Great Lakes Environmental Research Laboratory (SOLAR), and the Los Alamos Sea Ice Model (CICE); and three different meteorological forcings; the Climate Forecast System version 2 Operational Analysis (CFSv2), Interpolated observations (Interp), and the High Resolution Rapid Refresh (HRRR). A few non-FVCOM model outputs were also included in the evaporation analysis from atmospheric reanalyses (CFSv2 and NAM), the large lake thermodynamic model (LLTM). The simulated sensible and latent heat fluxes were validated with the eddy covariance measurements at two offshore sites; Long Point Lighthouse and Toledo Water Crib Intake. The evaluation showed a significant increase in heat fluxes over three days with the peak on the 18th of November. Cumulative lakewide evaporation was comparable with the spatially integrated snow water equivalent data from the National Operational Hydrologic Remote Sensing Center, indicating that lake evaporation should account for the majority of snow precipitation. The ensemble runs presented a variation in spatial pattern of evaporation, lake-wide average evaporation, and resulting cooling of the lake. The variation among the nine FVCOM runs resulted in the variation of 3D mean temperature cooling by 3-5 C O (6-10 EJ loss in heat content), implication for impacts on preconditioning for the upcoming ice season.Simulating hydrodynamics and ice cover in Lake Erie using an unstructured grid modelAyumi Fujisaki-Manome, Jia Wang2, and Eric Anderson21University of Michigan2NOAA Great Lakes Environmental Research LaboratoryAn unstructured grid Finite-Volume Community Ocean Model (FVCOM) is applied to Lake Erie to simulate seasonal ice cover. The model is coupled with an unstructured-grid, finite-volume version of the Los Alamos Sea Ice Model. This model, FVCOM-Ice hereafter, is applied to a shallow freshwater lake for the first time with a comprehensive parameter study of the ice dynamic model. Multi-year simulations results from 2003 to 2014 were compared with the observed ice extent, water surface temperature, ice thickness, and water temperature profiles, as well as with model results from an existing Princeton Ocean Model coupled with an ice model (ICEPOM). Clear improvement in simulating slow decay of ice extent in spring was achieved by FVCOM-Ice from the previous results with ICEPOM. FVCOM-Ice successfully reproduced the deformed ice spectrum in the probability density distribution of ice thickness observed in the in-situ measurements. Interestingly, the classical Hibler’s formula for the ice strength parameterization resulted in better agreement with the observed probability density distribution of ice thickness than the relatively new energy-based ice strength. The latter tended to underestimate in the deformed ice spectrum and to overestimate ice thickness. The winter thermal structure observed in the thermistor measurements in 2005 was reasonably reproduced by FVCOM-Ice with some improvement from the previous ICEPOM results, which was likely from the updated overland/overlake method to create meteorological forcing.Simulating Oceanic Responses of Placentia Bay to Hurricane LeslieZhimin Ma1,2, Guoqi Han1 and Brad de Young21Biological and Physical Oceanography Section, Fisheries and Oceans Canada, Northwest Atlantic Fisheries Centre, St. John’s, Newfoundland, Canada2Department of Physics and Physical Oceanography, Memorial University of Newfoundland, St. John’s, Newfoundland, CanadaWe use a three-dimensional, baroclinic finite-volume ocean model (FVCOM) to examine oceanic responses of Placentia Bay to Hurricane Leslie in September 2012. Hurricane Leslie made landfall at the south coast of Newfoundland on September 11, 2012. The FVCOM model is forced by reconstructed winds during the storm period. The modelled storm surge magnitude and timing agree well with tide-gauge observations. The sea surface cooling in the outer Bay is well reproduced by the model. The model results show strong near-inertial oscillation, consistent with observations.Simulation of upper ocean currents and waves in hurricanes using FVCOM-SWAVEYujuan Sun1, Will Perrie11Bedford Institute of Oceanography, Fisheries and Oceans Canada, Dartmouth, NS, B2Y 4A2, Canada.The capability of FVCOM-SWAVE to simulate the upper ocean currents and waves generated by high-wind speeds in hurricanes is investigated in our study. Effect of wave-current interaction on wave is discussed through the simulation of the process of Hurricane Bill (2009). Furthermore, based on the best track of Hurricane Bill (2009), we generated the idealized wind fields using the Holland symmetric method. The symmetric wind fields are applied in the model to simulate the wave conditions under different translation speeds, intensities of hurricanes. The effect of drag coefficients for wind stress on wave simulation is also discussed in this study.Impact of Sea Level Rise on Future Storm-induced Coastal InundationRobert C. Beardsley1 and Changsheng Chen21Department of Physical Oceanography, Woods Hole Oceanographic Institution, Woods Hole, MA 025432School for Marine Science and Technology, University of Massachusetts-Dartmouth, New Bedford, MA 02742As supported by the NERACOOS Program, the team of University of Massachusetts-Dartmouth and Woods Hole Oceanographic Institution researchers has established the Northeast Coastal Ocean Forecast System (NECOFS). NECOFS is an integrated atmosphere-ocean model system in which the ocean model domain covers the northeast US coastal region (the New England Shelf, Georges Bank, the Gulf of Maine, and the Scotian Shelf) with a horizontal resolution of 10-15 km in the open ocean, 1-5 km on the shelf, and down to 10 m in estuaries, inner bays, inlets and harbors. NECOFS also includes fully coupled current-wave coastal inundation model systems for Scituate ( MA), Mass Bay/Boston Harbor (MA), Hampton River (NH), and Saco Bay (ME). Using this system, we have examined the impact of sea level rise on future storm-induced coastal inundation in Scituate and Mass Bay/Boston Harbor. Experiments were made for a selected hundred-year nor’easter storm (February 1978 storm) and 10-year storm (August 1991 Hurricane Bob). Our experiments show that as a result of the mean sea level rise, for a given same storm as before, the surface wave height could be significantly increased and thus the surge level. We w ill face a greater threat from wave runup inundation during hurricanes and nor’easter storms in the future.Opportunities and Challenges in NOS Operational Forecast SystemsNOAA/NOS/CO-OPS/OD Modeling Team1, presented by Lianyuan Zheng1NOAA-NOS, Silver Spring, MDNOAA’s National Ocean Service (NOS) has been developing and maintaining a national network of hydrodynamic operational oceanographic nowcast and forecast modeling systems to support navigational and environmental applications in U.S. coastal and estuarine waters, and the Great Lakes. These operational forecast systems (OFS) provide the maritime community with nowcast and forecast guidance of water levels, currents, water temperature, and salinity for 48 to 120 hours.NOS has collaborated with NOAA’s National Weather Service (NWS) and Office of Oceanic and Atmospheric Research (OAR) and extramural partners from academia and the local maritime community to develop and implement the current suite of NOS OFS. NOS currently operates and maintains 15 OFS for the U.S. East and West coasts, the Gulf of Mexico, and the Great Lakes, to cover approximately 35% of the CONUS coast. Over the next 8 to 10 years, NOS intends to provide complete coverage of the continental U.S and establish the necessary national infrastructure to enable other types of forecasts. This presentation will provide an overview of FVCOM-based NOS OFS, their performance, and present challenges that the program is facing. We are exploring opportunities to collaborate with the community of FVCOM users to address these challenges and leverage advances in FVCOM development and applications to improve our OFS suite.Storm surge estimation around Japan using Finite Volume Community Ocean Model and Meso-scale model dataTakahiro Kayahara1,Satoshi Iizuka1, Koji Kawasaki2, Masaki Nimura2, Shinya Simokawa1, and Jun Sasaki31National Research Institute for Earth Science and Disaster Resilience2Hydro-soft Technology Institute3University of TokyoTyphoons often hit Japan, sometimes leading to inundation damage due to storm surge. In order to evaluate the possible risk caused by storm surge in Japan, we have implemented a Finite Volume Community Ocean Model (FVCOM). The model was forced by Meso-Scale Model (MSM) Grid Point Value (GPV) data of Japan Meteorological Agency and the Ocean Tidal Model NAO.99Jb, and then the results are validated for Typhoon Jelawat in 2012 and Typhoon Phanfone in 2014. These typhoons caused the relatively large tide level deviation in Tokyo Bay in recent years. The model is successful in simulating the peak time of highest level for both Typhoon cases, although the amplitude is somewhat underestimated compared to observations. In addition, the impact of difference in landfall times of typhoon will be discussed.Tools for Tidal Analysis in the Bay of FundyJeremy Locke1, Dr. Richard Karsten11Acadia University, Wolfville, Nova Scotia, CanadaThe age of nonrenewable dirty energy is coming to an end. Tidal power has global potential to help to begin the new age. The site of the largest tides on Earth, Canada’s own Bay of Fundy, has an assessed capacity to supply in excess of 2 GW – more than three times the power output of Nova Scotia’s largest coal plant and roughly 80% of the province’s present maximum output. Accurate insights on tidal phenomena are of utmost importance for Nova Scotia’s emerging tidal industry to become a feasible energy source to supply the province. In order to make accurate site assessments, Acadia University has developed expertise is in the realm of numerically simulating tides in the Bay of Fundy using the Finite-Volume Community Ocean Model (FVCOM). In a new project starting Fall 2016, Acadia numerical data will be used to help study turbulent behavior at hub height. The Vectron – an instrument that combines several acoustic Dopplers to measure turbulence – will be deployed at four sites in the Minas Passage for two-month intervals throughout 2016-2018 to collect tidal data for the project. The Vectron’s data will be used twofold to study turbulence properties and to validate FVCOM outputs that have been post-processed by the python package ‘PySeidon’. The ability to pr edict tidal behavior and select optimal turbine deployment sites will increase turbine mechanical lifetime and reduce the industry’s investment risk. Data from this project will directly benefit both the local tidal industry with precision measurements of the Minas Passage area and the global tidal industry with research on tidal behavior.。
悍马轿车无线RF密钥板操作指南说明书
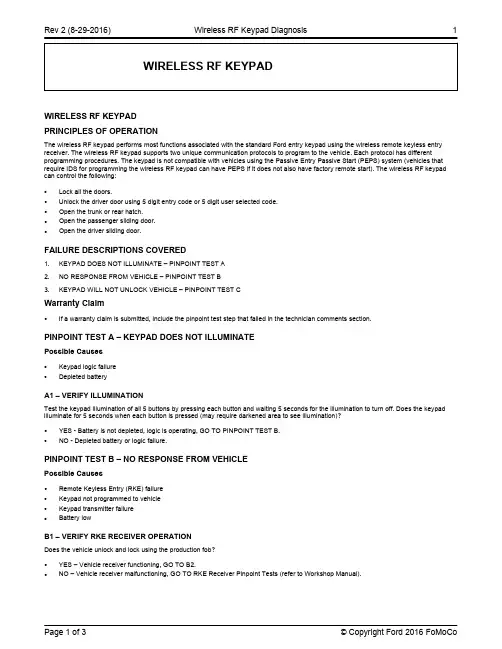
WIRELESS RF KEYPADPRINCIPLES OF OPERATIONThe wireless RF keypad performs most functions associated with the standard Ford entry keypad using the wireless remote keyless entry receiver. The wireless RF keypad supports two unique communication protocols to program to the vehicle. Each protocol has different programming procedures. The keypad is not compatible with vehicles using the Passive Entry Passive Start (PEPS) system (vehicles that require IDS for programming the wireless RF keypad can have PEPS if it does not also have factory remote start). The wireless RF keypad can control the following:•Lock all the doors.•Unlock the driver door using 5 digit entry code or 5 digit user selected code.•Open the trunk or rear hatch.•Open the passenger sliding door.•Open the driver sliding door.FAILURE DESCRIPTIONS COVERED1.KEYPAD DOES NOT ILLUMINATE – PINPOINT TEST A2.NO RESPONSE FROM VEHICLE – PINPOINT TEST B3.KEYPAD WILL NOT UNLOCK VEHICLE – PINPOINT TEST CWarranty Claim•If a warranty claim is submitted, include the pinpoint test step that failed in the technician comments section.PINPOINT TEST A – KEYPAD DOES NOT ILLUMINATEPossible Causes•Keypad logic failure•Depleted batteryA1 – VERIFY ILLUMINATIONTest the keypad illumination of all 5 buttons by pressing each button and waiting 5 seconds for the illumination to turn off. Does the keypad illuminate for 5 seconds when each button is pressed (may require darkened area to see illumination)?•YES - Battery is not depleted, logic is operating, GO TO PINPOINT TEST B.•NO - Depleted battery or logic failure.PINPOINT TEST B – NO RESPONSE FROM VEHICLEPossible Causes•Remote Keyless Entry (RKE) failure•Keypad not programmed to vehicle•Keypad transmitter failure•Battery lowB1 – VERIFY RKE RECEIVER OPERATIONDoes the vehicle unlock and lock using the production fob?•YES – Vehicle receiver functioning, GO TO B2.•NO – Vehicle receiver malfunctioning, GO TO RKE Receiver Pinpoint Tests (refer to Workshop Manual).B2 – VERIFY WIRELESS RF KEYPAD COMMUNICATIONDoes the vehicle lock when the 7/8 and 9/0 buttons are pressed at the same time?•YES – Wireless RF keypad transmitter functioning and programmed to vehicle, GO TO C1.•NO – Keypad transmitter failure or keypad not programmed, GO TO B3.B3 – CHECK FOR KEYPAD OUT OF SYNC–1Does vehicle lock when the 7/8 and 9/0 buttons are pressed at the same time 3 times within 5 seconds?•YES – Passive re-sync done, GO TO C1.•NO – Passive re-sync failed, GO TO B4.B4 – CHECK FOR KEYPAD OUT OF SYNC–2Using a programmed fob, lock the vehicle and then press the 7/8 and 9/0 buttons at the same time within 5 seconds. Does the vehicle lock?•YES – Active re-sync done, GO TO C1.•NO – Active re-sync failed, GO TO B5.B5 – CHECK FOR KEYPAD NOT PROGRAMMEDFollow the installation instructions for the vehicle the wireless RF keypad is being installed.Does the vehicle lock when pressing the 7/8 and 9/0 buttons at the same time?•YES – Wireless RF keypad transmitter functioning and programmed to vehicle, GO TO C1.•NO – Keypad programming failed, GO TO B6.B6 – CHECK FOR KEYPAD ATTACHED TO DOOR EXTERIORThe process of programming the keypad to the vehicle requires additional transmissions from the keypad to make sure the process completes successfully. Do not attach the keypad to the door's exterior until after it has been programmed to the vehicle. If the keypad is attached to the door, remove it and follow installation instructions for the vehicle the wireless RF keypad is being installed.Does the vehicle lock when pressing the 7/8 and 9/0 button at the same time?•YES – Wireless RF keypad transmitter functioning properly and programmed to the vehicle, GO TO C1.•NO – Transmitter failure, replace keypad.PINPOINT TEST C – KEYPAD WILL NOT UNLOCK VEHICLEPossible Causes•Wrong master code•Keypad button failure•Logic failure•Depleted batteryC1 – UNLOCK USING MASTER CODE FROM CODE CARD.Enter the master code printed on the master code card.Does the vehicle unlock?•YES – Complete.•NO – Possible master code card mismatch, GO TO C2.•The wireless RF keypads are a dealer accessory.•Key codes are available for both wireless RF keypad versions:•7L2Z-14A626–BA •ES7Z-14A626–A •The system will provide the master key code once the flash code has been entered.•To get the flash code from the wireless RF keypad (read all steps prior to performing code retrieval):•Press and hold the 1/2 and 3/4 buttons on the keypad.•While pressing the 1/2 and 3/4 buttons, press and hold the 7/8 button until the 9/0 button flashes, then release the buttons.•Count and record each flash (including the first one). The 9/0 button will flash each digit with a series of flashes at a one flash per secondrate. There will be a 3 second pause between each digit. The flash code has 5 digits, each digit can be 1-5 (that is, a 1 will flash once followed by a 3 second pause, a 4 will flash four times followed by a 3 second pause, then the next digit will flash, followed by a 3 second pause until all 5 digits have been sent). These five digits are the flash code.•When the Aftermarket Keyless Entry Keypad Code Access site is reached:•Enter the five digit flash code and press submit to get the master code.Does the master code you obtained unlock the vehicle?•YES – Complete.•NO – Include keypad flash code and retrieved master code in warranty claim.C2 – LOOK UP MASTER CODE THROUGH ONLINE APPLICATIONGeneral Information•You will only see the key code link if your user ID has been granted access.The accessory wireless RF keypad can only be used with vehicles that are factory built with RKE and without PEPS (vehicles that require IDS for programming the wireless RF keypad can have PEPS if it does not also have factory remote start). The master code for the wireless RF keypad can be retrieved from FMCDealer- Parts and Service- Parts Product Line Information- Keys/Entry Devices- Aftermarket Keyless Entry Keypad Code Access. Access to this site is granted to DPES authorized users. Once accessed, the master code retrieval process is given. The master code for the wireless RF keypad cannot be retrieved from the body module with a diagnostic tool.。
16层螺旋CT在主动脉瘤病诊断中的应用

( a il yD p r n,h 0 r H s i l f I , a nn 3 0 1 C ia R do g e a me tte3 3d opt J N n ig5 0 2 , hn ) o t aoP A
A s at O jel oe a aetee cc f1 -leS i l Ta g gah (T ) i otpoes gtcnq e bt c bet e T vl t h f ayo 6 sc pr n i rpyC A wt ps— rcs n h i si r v u i f i aC o h i e u n
动 脉 瘤 患 者 的 1 层 螺 旋 C 平 扫 和 血 管造 影 原 始 资 料进 行 回顾 性 分 析 。 原 始 数 据 传 输  ̄ADW42工 作站 行 后 处 理 . 6 T 将 . 包
括 遮 盖 容 积 重 建 ( R) 多平 面重 建 ( R) 最 大密 度投 影 ( P 、 面 重 建 ( S ) 仿 真 内镜 ( T E 等 各 种 后 处 理 技 V 、 MP 、 MI ) 曲 SD 和 CV ) 术主 动 脉 瘤7 , 主 动 脉 瘤9 以及 升 主动 脉 、 主动 脉 和 腹 主 动脉 假 性 动 脉 瘤各 4 例 腹 例 降 例 结 论 :6 螺 旋C 横 断 面及 三 维 图像 能 够快 速 、 确 、 创 、 面地 显 示 动脉 瘤病 变 的病 理 解 剖 改 变 . 临床 提 供 精 细 1层 T 准 无 全 为
哈佛分析框架与企业财务分析外文文献翻译
毕业设计附件外文文献翻译:原文+译文文献出处:Andrew G. The study of Harvard analysis framework and corporate financial analysis. American Journal of sociology, 2016, 2(4): 283-301.原文The study of Harvard analysis framework and corporate financial analysisAndrew GAbstractAn effective financial analysis framework should not only learn how to use accounting data, and be good at using the accounting data. Enterprises to implement its business strategy are based on the accounting data, and ignore the enterprise environment and strategic analysis. Thus, to a more comprehensive understanding of enterprise operating performance, but also extends the traditional financial analysis object by the financial statements for the entire financial report and related institutional environment, build a new financial analysis framework is more and more necessary.New analysis framework should be more with strategic vision, focus on the development strategy of the enterprise, takes the enterprise's competitive position, USES the method of management related problem analysis, financial statement analysis and analysis of organic combination of enterprise development strategy, analysis of enterprise internal and external management environment, combined with the overall development of the enterprise strategic and long-term interests, analyze the content of the more widely and more wide, to the enterprise management decision making will be more valuable. Harvard analysis framework and harvard analysis framework arises at the historic moment, standing in a strategic point of view, is not limited to the company's financial statements, to analyze the opportunities and threats from external environment, and the enterprise internal strengths and weaknesses, the analysis of financial situation improved prediction is scientific, pointed out the direction of future development for the enterprise.Keywords: Harvard analysis framework, the electric power enterprise, strategy, financial analysis1 IntroductionThe development needs of an enterprise financial analysis for its help, financial analysis has attracted the attention of the enterprise, experts and scholars are also constantly explore the solution to the financial analysis, financial analysis framework of research in recent years, more and more. Harvard analysis is the sublimation of traditional financial analysis, the framework from the management strategy of enterprises, analyzes the financial data of the enterprise, accounting analysis, find out enterprise possible false results, and then adopt some methods to improve the quality of accounting information, and on the basis of financial analysis, realistic analysis of the results, and then forecast the prospect of the enterprise. The traditional financial analysis framework is in the long-term practice of financial analysis and theoretical summary and form, it is main analysis object with financial statements, although joined the financial comprehensive analysis model or system, but still with quantitative analysis as the basic characteristics of neglect or some important financial information cannot be effectively incorporated into the analysis framework. Traditional analysis framework is mainly analysis enterprise's financial statements, is basically a state of "report on report". And commonly used analysis methods mainly include ratio analysis, comparative analysis, trend analysis and DuPont financial analysis system, etc., mainly through the calculation and comparison of the financial statement data, draw the corresponding index data, then the results of comparative analysis and factor analysis, heavy "quantity" is not "quality", the lack of the nature of the analysis of a problem. Traditional analysis, with emphasis on the internal situation, the main process flows of the enterprise, asset utilization ability, debt paying ability, profitability analysis, and ignore the external business environment. And analysis based on financial statements and financial statements is a summary of the business in the past, and this analysis has the obvious lag. The traditional financial analysis framework to analyze the data on the enterprise accounting statements cannot havesatisfied the needs of the development of enterprises now.2 Literature reviewCommon methods of financial analysis can be summarized as three kinds: DuPont financial analysis method, economic value added and balanced scorecard method. DuPont financial analysis method the enterprise net assets yield level decomposition to the product of a number of financial ratios, by using the inner relationship between financial indicators, comprehensive management of the enterprise financial management system and the economic benefit of this evaluation. It can help enterprise management more clearly see the determinants of return on net assets, and the sales net profit margin and total asset turnover, the correlation relationship between the debt ratio, provides a clear overview to management whether the company assets management efficiency and maximize shareholder returns roadmap. Economic value added theory init ially by Merton miller and Franco’s dial, two famous economists put forward. Later in the United States, tang, consulting company realized that this method is to evaluate the value of the company a good method, so the company will set up the method to promote worldwide. Economic value added is the company's operating profit after tax and the difference between the costs of capital; it takes into account the opportunity cost of capital economic profits, rather than accounting profit. It will force the company decision-makers high attention to the cost of capital. Put forward by Robert Kaplan, the balanced scorecard, which is based on enterprise strategy as the guidance, through finance, customer, operations and staff from four aspects and performance indicators of cause and effect, comprehensive management and the enterprise integrated performance evaluation system. Because of its advanced and has a certain reliability, so has been the favor of some companies. This kind of evaluation method to evaluate the quality of people to have certain request, because the choice of evaluation index need to refer to the company all aspects of characteristics, in order to fully reflect the company's financial position and operating results.In this increasingly mature, on the basis of financial analysis methods, scholars began to pay attention to these methods can be incorporated into a complete financialanalysis system, in order to form a frame structure, support for the enterprise economic operation.ErichHelford analysis framework is divided into introduction, operation analysis, investment analysis, financing analysis, value analysis several part. Summarizes the enterprise system, decision background and its relationship with financial statements and analysis tools, discussed including investment analysis, capital cost and financing options, and stock and enterprise value assessment, etc.Elisha based on the traditional financial analysis framework, which based on the analysis of enterprise debt paying ability, assets operation ability, profit ability and development ability, added into some of the industry analysis and the analysis of competition strategy. It includes business strategy analysis, accounting analysis, financial statement analysis and prospect analysis of four parts.The main points of the frame is in the business strategy analysis under the premise of accounting analysis, financial analysis and prospect analysis, shows that it is in a macro view more open order detail analysis, not only do detail analysis. Clyde P to financial analysis framework is divided into three parts, the first part of the financial accounting environment, the analysis of the data and the relationship between the enterprises the main activities, etc;The second part of accounting analysis, from the generally accepted accounting principles, analysis the connotation of the accounting item and quality; The third part of financial analysis, namely from the profitability, risk, prediction and evaluation of enterprise financial position and operating results are analyzed.3 Harvard theory analysis frameworks3.1 Strategic analysisStrategic analysis is the logical starting point of financial statement analysis, is also a Harvard analysis framework and other different parts of the financial analysis. Financial statement analysis is through the strategy analysis to the business activities of enterprises qualitative analysis of its economic significance, but also to accounting analysis and financial analysis for providing realistic background. Its main from the industry analysis and competitive strategy analysis of the two sides is analyzed. Can make use of porter five analysis, industry analysis to analyze the profitability of theindustry, by analyzing the existing and potential competitiveness, and negotiation ability, in the buying and selling market for investors to the data analysis of the industry has an overall grasp. Through the analysis of the industry development stage, the industry technological change speed, the product difference and integration, the buyer the seller number and relative size, industry market boundaries, total market and growth prospects, such as analysis, can see the nature of the industry and its status and role in the national economy. Sometimes, according to the characteristics of different industry life cycle for analysis. Must analysis the enterprise competition strategy analysis the characteristics of the industry and competitiveness problems. Choose attractive strong industry is part of business success, however, the real key to the success or failure of the enterprise is the enterprise the selected cost leadership strategy or differentiation strategy enforcement of whether to make a difference. Cost advantages including at a lower cost to provide the same product or service ability, a large number of mass production scale, production efficiency, etc.Difference advantage to supply a unique product or service cost is lower than the price, consumers preferred to buy a better product quality, more product variety, better customer service, etc.3.2 Accounting analysisAccounting analysis aims to evaluate financial statement disclosure of accounting information to the enterprise actual reflect the degree of operating conditions. Through the evaluation of enterprise accounting policies and accounting estimates whether appropriate, can assess the enterprise accounting information distortion degree. Through the analysis of the notes to financial statements, understand accounting statements behind digital detailed composition and not reflected in the information on accounting statements, by analyzing industry transverse and longitudinal analysis of the enterprise financial data that may exist in the water, and then to certain adjustment of financial data, and according to the adjusted data to the financial statements, so that they can more accurately grasp the enterprise the management condition. Accounting analysis steps in turn have to identify the key accounting policies, evaluating accounting flexibility, evaluationstrategy, accounting disclosure quality evaluation, recognize danger signals and finally eliminate the distortion of accounting information. Accounting analysis method can have the audit report to analysis, abnormal profit excluding method, cash flow analysis, related party transactions rejecting method eliminating method and the virtual assets.3.3 Financial analysisThe main content of financial analysis is to enterprise's debt paying ability, operation ability, and profit ability; create cash flow capacity using the method of financial ratio analysis and cash flow analysis to analysis and research. Is the purpose of financial analysis using the financial data to evaluate the performance of enterprise at present and the past, in order to better know and enterprise strategy is linked to performance. Ratio analysis is mainly used to evaluate the enterprise product market performance and financial policy. Cash flow analysis is mainly used to evaluate enterprise asset liquidity and financial flexibility. Analyze the corporate profitability and growth is one of the major problems of financial statement analysis and evaluation. Through the analysis of the problem can be used to develop product strategy and financial strategies. Product strategy, operation and management, including analysis of revenues and expenses management, working capital and the management of fixed assets investment management. Management of finance strategy including the analysis of debt and equity structure of financing strategy, dividend payments and profit distribution of dividend policy. Conduct financial analysis and accounting information distortion phenomenon is more common, so the Harvard analysis under the framework of financial analysis are not independent accounting data, but according to the result of step in the accounting analysis, namely the financial statements of the enterprise artificial out financial analysis, and the related parameters of the accounting statements and peer enterprises horizontal comparison, and analysis enterprise's position in the industry and its realistic situation.译文哈佛分析框架与企业财务分析研究Andrew G摘要一个有效地财务分析框架不仅要学习如何使用会计数据,而且要善于运用非会计数据。
ICT全器官灌注成像对胃癌的诊断价值

• 111型速升一缓降一平衡型, 起始段迅速上升达到最大值 后缓慢下降,下降到一定值 后维持较长时间一直到灌注 扫描结束; • IV型缓升一缓降型,起始段 较缓慢的上升,到达最大值 后缓慢下降一直到灌注扫描 结束
三、全胃灌注对胃肿瘤的应用价值
• 以往胃癌的检出主要靠X线气钡双重对比造影和纤维内窥 镜,但是这两种检查方法却难以准确的判断胃癌的浸润范 围和浸润程度,淋巴结转移及远处转移情况,术前不能对
水,注射开始后6s,对患者实行灌注扫描,覆盖范围包括
全胃层面。 • 灌注扫描结束后立即追加50ml对比剂及等量生理盐水,
再次行全胃扫描。
• 检查前准备:胃是腹部空腔脏器,其CT灌注成像不仅受 机器扫描参数本身的影响,还受呼吸、肠蠕动等因素的影 响,因而胃肠道的扫描前准备至关重要。
• 检查前2Omin饮水1000ml,肌肉注射山莨菪碱2Omg。
新 技 术
ICT全胃灌注对胃肿瘤的诊断价值
吴 道 青
南京军区福州总医院医学影像科
• 灌注成像(perfusion imaging)是指通过影像学设备直观 显示活体组织的灌注过程和作定量或半定量分析的方法。 • 具有很高的时间及空间分辨力,在显示血流改变的同时提
供细致的解剖图像。
• 其最早对急性脑缺血性病变的应用价值在临床上已得到肯 定。随着该技术的发展,近年CT灌注成像在脑肿瘤、肝
CT,通过一次灌注扫描可获得全器官组织的血流动力学
信息。这对于了解肿瘤组织内血供情况,对肿瘤良恶性、 肿瘤恶性程度、临床治疗措施选择以及预后判断具有重要
的临床价值。
病例1
正 常 胃 壁 灌 注 图
病例2
胃 癌 的 灌 注 图
胃癌
正常胃壁
胃灌注图的分析
杂勘复Intrepid Geophysics GeoModeller 2016 v3.3.0 Win64 1CD质模建

Geomagic Freeform 2017.0.84 Win64 1DVD
Geomagic Freeform Plus 2017.0.84 Win64 1DVD
Geomagic Sculpt 2017.0.84 Win64 1DVD
Dlubal COMPOSITE-BEAM 8.09.01 Win64 1CD
Dlubal CRANEWAY 8.09.01 Win64 1CD
Dlubal PLATE-BUCKLING 8.09.01 Win64 1CD
Dlubal RX-TIMBER 2.09.01 Win64 1CD
InnovMetric PolyWorks 2017 IR2 Win32_64 2DVD
Sheet Set Manager Properties Editor(SSMPropEditor) v6.4 for AutoCAD 1CD
Spider.Financial.NumXL.v1.65.42892.1.Win32_64 2CD
Lindo Lingo v17.0.60 Win64 1CD
DipTrace 3.1 with 3D Library 1DVD
Cadam.Drafting.V5-6R2017.SP2.Windows 1CD
Pumplinx v4.0 Win64 1DVD
CATIA.P3.V5-6R2017.GA.Win64 1DVD
Camnetics.Suite.2018 9CD
CAXA 实体设计 2018 SP0 Win32_64 1DVD
FTI.Forming.Suite.2017.2.0.15080.Win64 1CD
硕博学位论文UDC查询(2016)

.0 条目总则00 绪论.基本的知识和文化学. 计算机科001 科学和知识总论. 智力工作组织002 文件. 书籍. 著作. 著作权003 书写系统和脚本. 其中包括:标志和符号004 计算机科学与技术.计算004.2 计算机体系结构004.3 计算机硬件004.4 软件004.5 人机交互004.6 数据004.7 计算机通信004.8 人工智能004.9 面向应用的计算机基础技术005 管理005.1 管理理论005.2 管理代理. 机制. 措施005.3 管理活动005.32组织行为. 管理心理学005.5管理业务. 方向005.6质量管理. 全面品质管理005.7组织管理005.9管理领域005.92档案管理005.93工厂管理.物资管理005.9知识管理005.95/.96人事管理. 人力资源管理006 产品标准化, 业务名称, 重量, 尺寸与时间007 活动和组织. 信息. 通信与控制理论总论008 文明. 文化. 发展009 人文. 艺术主题总论01 书目. 目录02 图书馆03 参考作品总论. 百科全书050系列出版物. 期刊<其功能, 业务和编辑管理>06 组织和其他形式的协作. 包括: 社团. 议会.展览会. 博物馆070 报纸. 新闻界. 包括: 新闻工作08 集体工作09 手稿. 珍稀作品1 哲学.心理学101哲学的性质和作用11 形而上学13 心灵哲学14 哲学体系159.9 心理学159.91生理心理学 . 心理生理学159.92心理发展和能力. 比较心理学159.93感觉能力. 感官知觉159.94行政职能159.95高级心理过程159.96特殊心理状态与过程159.97变态心理学. 精神错乱. 智力障碍159.98应用心理学16 逻辑. 认识论17 道德哲学. 伦理2 ##.神学21 史前与原始##22远东##221中国##221.3道教223 韩国##225 日本##23印度次大陆##233狭义印度教234耆那教235锡克教24佛教241小乘<Theravada> 佛教242大乘佛教243喇嘛教244日本佛教25古代##.次要的邪教和信仰252 美索不达米亚##254 伊朗##257 欧洲##26犹太教262德系犹太教264西班牙犹太教265正统犹太教266进步犹太教267犹太教所带来的现代运动27基督教271东部教会272/27927西部教会272罗马天主教会.273非罗马天主教主教教会274新教总论. 新教徒. 持异议者. 清教徒275改革教会276Anabaptists277自由教会. 不顺从者27827其他新教教会279其他基督教运动和教会28伊斯兰教282逊尼派. 伊斯兰教逊尼派284什叶派教徒. S什叶派伊斯兰教285babi 巴哈教286巴哈教29现代精神运动-1##理论和哲学. ##性质. ##现象-2##迹象-3##人-4##活动. ##实践-5泛神论. 邪教. 仪式和典礼-6##过程-7##组织和管理-8##各种性质的特点-9信仰, ##, 教派或教会的历史3社会科学30社会科学理论和方法303社会科学方法304社会问题. 社会实践. 文化实践. 生活方式305性别研究. 性别角色. 性别. 多学科角度的人308Sociography. 社会描述性研究<定性和定量>313人口统计学.统计资料. 社会学311统计科学.统计理论311.1基本原则. 统计基础311.2研究技术. 准备. 制表311.3统计组织总论. 官方统计311.4私营统计314人口统计316社会学316社会学的对象和X围316社会学角度与趋势的观点316社会结构. 社会系统316社会进程. 社会动态316社会心理学316文化社会学. 社会生活的文化背景下32政治321政治组织形式. 国家形式政治权力322教会和国家的关系. ##政策. 教会政策323民政事务. 内部政策324选举. 公投. 公选. 竞选活动. 选举贪污, 舞弊的情况. 选举结果325领土的开放. 殖民地化326奴役327国际关系. 世界, 全球政治. 国际事务. 外交政策328议会. 人民代表329政党和运动.33经济学330经济学总论331劳工. 就业. 工作. 劳动经济学. 工会332区域经济学. 国土经济学. 土地经济学. 房屋经济学334组织形式与经济合作336 金融338经济形势. 贸易周期. 经济结构的发展. 增长339贸易. 商业. 国际经济关系. 世界经济34法.法理学340法学总论341国际法342公法. 宪法. 行政法343刑事法. 刑法罪行344特别刑法. 军事, 海军, 空军法346经济法. 政府经济调控法347民法348教士法. 教会法. ##法349法律特别分支. 杂项法律事物35公共行政351公共管理详细活动352基层行政. 当地政府. 市政管理. 地方当局353中层行政. 地区, 省政府. 地区当局354高层, 最高层行政. 中央, 国家政府355一般军事事务356普通军队. 步兵. 步行军357骑兵. 先锋军. 摩托化部队358炮兵. 工程师. 航空. 各种技术与其单位359海军力量. 军舰. 海军: 人事, 组织36社会福利364社会福利365住宿需要与满足. 保障住宿366消费者权益368保险. 通过分担风险的公众保障.37教育371教育组织和培训体系. 学校组织373提供普通教育的各种学校374教育和校外培训. 继续教育376教育, 教学, 特殊人群培训. 特殊学校377专科. 职业, 技术, 专业培训. 高职院校, 教育机构. 理工学院378高等教育. 大学. 学术研究379.8休闲39人种学. 风俗.礼仪. 传统. 生活方式. 民俗学391服饰. 服装. 民族服饰. 时装. 饰品329风俗, 礼仪, 个人生活习惯393死亡. 尸体处理. 丧事. 葬礼394公共生活. 盛会. 社会生活. 人民的生活. 包括: 日常生活. 庭院生活. 街道生活395社会礼仪. 礼节. 良好的礼仪. 社会形态. 阶级.头衔398狭义民俗学4空缺5自然科学50科学概述501科学概述. 广义数学502/504环境科学. 天然资源保护. 反对环境破坏502环境与其保护502.3/.7部份环境504 对环境的威胁. 包括: 污染51 数学510 基本和一般性数学511 数论512 代数514 几何515.1拓扑学517 分析519.1组合分析. 图论52 天文学. 天体物理学.空间研究. 测地学520 天文仪器与技术521 理论天文学. 天体力学523 太阳系524 恒星. 恒星系. 宇宙528测地学. 測勘. 摄影. 遥感, 制图53 物理学531一般力学. 固体与刚体力学532一般流体力学. 液体力学<流体力学>533气体力学. 航空力学. 等离子体物理534震动. 声学535光学536热量. 热力学537电力. 磁性. 电磁学53 事物物理性质54 化学. 结晶.矿物学542实验室实用化学. 制备和化学实验543分析化学544物理化学546无机化学547有机化学548晶体学549矿物学. 矿物质专研55地球科学. 地质学,气象学, 等550地质学等的辅助科学551地质学总论. 气象学. 气候学. 历史地质学. 地层.古地理学551.1/.4普通地质学551.1地球一般结构551.2地球内部动力学<内部过程>551.3地球外部动力学<外部过程>551.4地貌. 地球物理状态研究551.5气象学552 岩石. 岩553 经济地质学. 矿藏556 水圈. 常规水. 水文56 古生物561.1一般种子植物. 种子植物. 显花植物.Siphongamous embryophyta561.7Rosidae561.9Asteridae561.999 其他双子叶植物. Anomaliae562/569系统性古动物学57 一般生物科学572 人类学572.1/.4 人类起源论. 人类发展. 人类起源573一般理论生物学574一般生态和生物多样性575 普通遗传学. 一般细胞遗传学576 细胞和亚细胞生物学. 细胞学577生命物质基础. 生物化学. 分子生物学. 生物物理学578病毒学579微生物58 植物学.581植物学总论582系统植物学582.2/.3 隐花植物. 无花植物. 孢子植物582.3/.99 植物界582.4种子植物总论. 种子植物. 显花植物. Siphonogamousembryiophyta582.5/.9被子植物<木兰门>. 被子植物. 开花植物. 后期种子植物582.6/.9 Dicotyledonae <双子叶植物>582.7Rosidae582.9Asteridae59 动物学591一般动物学592/599系统动物学592Invertebrata593.1原生动物594 软体动物. 贝类等.595 有关节类. 蠕虫等.597/599脊椎动物门. 脊椎动物. 鱼类, 两栖类等598蜥形类. 爬行动物. 鸟类599哺乳动物6技术60生物技术601基本概念602工序和技术604产品606生物技术应用608问题. 包括: 法律, 经济, 道德影响61医学科学611解剖. 人类和比较解剖学612生理学. 人类和比较生理学613一般保健学. 个人保健和卫生614公共健康和卫生. 事故预防615药理学. 疗法. 毒理学616病理学. 临床医学617手术. 骨科. 眼科618妇科. 产科62工程.一般技术620材料试验. 商业材料. 发电站. 能源经济学621机械工程总论. 核技术. 电机系. 机械621.3电气工程622矿业623军事工程624土木与结构工程学总论625土木工程与陆路运输. 铁路工程. 公路工程626水利工程总论627天然航道, 港口, 港口和海岸工程. 航海, 疏浚, 打捞和救援设施. 水坝和水力发电厂628公共健康工程. 水. 环境卫生. 照明工程629运输车辆工程63农业和相关科学和技术.林业.耕作.野生动物利用630林业631农业总论632植物的损害,伤害.植物病害.害虫,有害植物的生物体.植物保护633田作物与其产品634普通园艺635园林植物.园艺635.1/.8蔬菜.菜园636畜牧业和育种总论.牲畜饲养.繁殖家畜637家用<农家庭院> 动物与游戏生产638昆虫和其他节肢动物的饲养,繁殖和管理639打猎.捕鱼.鱼类养殖64家政.家庭科学.家务管理640各类家庭和家庭管理641食物.煮食.菜肴642膳食和三餐.餐具643家庭. 住宅644用于健康和舒适的住宅装置645家具和家用设备646服装.身体护理647家庭成员648洗衣机.洗衣房.清洁649儿童,残疾人,客人的家庭照顾654/659通信业654电信和遥控<组织,服务>655图形产业.印刷.出版.图书贸易656交通运输和邮政服务.交通组织与控制657会计658企业管理,行政管理.商业机构659宣传.信息工作.公共关系66化学技术.化学品与相关行业661化学制品662爆炸物.燃料663工业微生物学.工业真菌学. 酿造学,发酵工业..饮料业.兴奋剂业664固体食品制作和保存665油.油脂.蜡.粘合剂.树胶.树脂666玻璃工业.陶瓷.水泥和混凝土667色彩产业669冶金67多样产业,贸易和工艺671贵金属,宝石物件672一般钢铁物件673有色金属物件<除贵金属>674木材和木材加工业675皮革业<包括毛皮和人造革>676纸浆,纸X和纸板业677纺织工业678基于高分子材料的产业.橡胶工业.塑料工业679基于各种可加工材料的产业68成品和拼装物件的产业,贸易和工艺681精密机械和仪器682锻冶. 黑铁业. 蹄铁术. 手锻铁器683五金产品. 硬件. 锁业. 瓶子. 灯具. 供暖设备684家具与有关行业.家具制造.室内装饰685旅行用具.鞋类. 手套.旅游,体育,游戏与其他设备686装订.喷镀.制镜.文具687制衣业.服装加工.美容文化688花式商品.玩具.装饰物品689业余手工艺.技术嗜好69建筑物<建造>贸易.建筑材料.建设实践与程序691建筑材料.建筑构件692建筑物结构和要素693砌体与相关建筑工艺694木材建造.木工. 细木工业696建筑物中的设备,服务,设施<卫生,燃气,蒸汽,电力>.管钳工.水管工.金属工人.排水管铺设机.电工.其他行业697建筑的采暖,通风和空气调节698收尾工作和装修行业7艺术71实际规划.区域,城市与乡村规划711实际规划的原则和实践.城镇和农村规划等.712景观的规划.公园,花园等.718结构特点总论719农村和城市容貌维护72建筑721普通建筑.包括:编程.设计.特定用途部分.客房725公共,民间,商业,工业建筑.一般世俗建筑726##,教会建筑.教堂,寺庙,清真寺等.727教育,科学,文化用途的建筑物.图书馆,博物馆,学校等.728住宅建筑.房屋.住宅大厦73造型艺术730一般雕塑.雕像736宝石雕刻术. 印章学737钱币学738陶瓷艺术.陶器739金属艺术74绘图.设计,应用艺术和手工艺741一般绘画742透视制图743解剖学制图744线性和几何绘图.技术制图745装饰工艺品746花式工作.艺术刺绣747室内装修748玻璃体艺术.艺术玻璃与水晶制品749艺术家具,取暖和照明设备75绘画详细的画家作品可以按字母排序76版画艺术.图形761浮雕技术762凹印技术763planographic技巧.光刻技术<直接平版印刷法> 766应用图形技术.商业图形77摄象与类似过程771摄象器材,设备和材料772利用无机物质或物理现象的摄象系统或过程773利用有机化合物的摄象系统或过程774常规印相操作过程776光刻. Photographic productions of planographic plates777凹版与浮雕过程778摄影的特殊的应用和技术778.5摄影.影片摄象78音乐781音乐理论.乐谱.和谐.节奏.组成,解释等.782/785 音乐种类782戏剧音乐.歌剧,音乐剧等.783教会音乐.神圣的音乐.##音乐784声乐.歌曲785器乐.交响音乐.管弦乐等..786独立音乐79消遣.娱乐.运动会.体育791电影院.电影792剧院.舞台艺术.戏剧表演793社会娱乐和消遣.运动艺术.舞.聚会游戏794平板和桌上游戏<针对思维,技能和运气>796体育运动.运动会.体育锻炼797水上运动.空中运动798骑马和驾驶.马与其他动物体育799捕鱼.打猎.射击和目标体育项目.01艺术理论与哲学.02技术. 技巧.03艺术时期和阶段.学派,风格,影响力.04艺术表现学科. 图解. 象征法.05应用美术<在工业,贸易,民政,日常生活>.06艺术有关的各种问题.07艺术与娱乐的职业与联系.08特点,形式,组合等<在艺术,娱乐与体育>.091演出, 表演<在原件>8语言. 语言学.文学80一般问题.包括:语文学.修辞801韵律.考据学.语文学的辅助科学和来源808修辞.语言的有效地使用.著述,编辑,发言等.81语言学与语言81'1/'4语言学层面81'1普通语言学81'2符号.心理语言学.社会语言学.用法.方言81'3数学与应用语言学.音标. 字形学.语法.语义学81'4篇章语言学.话语分析.类型语言学811语言811.1/.8个人<自然人>语文811.9人工语言82文学82-1/-9文学形式.体裁82-1诗.诗歌.韵文82-2话剧.戏剧82-3小说.散文叙事82-4/-9其他流派82.09文学批评.文学研究821个体语言文学9地理. 传记.历史91地理.勘探91191一般地理学.系统的地理.物理,人类,理论地理学等. 911.2911自然地理911.3人文地理<文化地理学> .文化因素地理911.5类型地理学911.6个人空间分区与区域单位911.7比较地理学911.8规X地理911.9适用,实用地理学912一个地区的非文学,非文本代表性.地图,地球仪,地图等.913区域地理总论.古代与现代世界的地理学913<100>世界区域地理913<2>物理区域的地理学.其中包括:土地面积913<3>古老世界地理学913<4/9>现代世界个别地区和国家的说明929传记和相关研究929.5宗谱929.6纹章学929.7贵族.头衔.爵位929.9国旗.标准.横幅93/94历史.历史的科学.辅助科学.一般历史94<3/9>个别地方的历史94<100>世界历史94<100>'19'20世纪的世纪历史94<94<3> 古老世界的历史94<94<4/9>现代世界的个别地区和国家的历史94<=411.16>犹太人民的历史。
2016汇总
2016汇总125851017300020326069000038000236277011.10000000000000013074002220001.2198400984001.31963009630022.29999999999999986386002316002.431606004818002.5237400748002.6110800108002.71108001080033.127425148503.211716017160125851055.0999999999999996 107000700005.210885088500 5.310 1450 14500 173000 66.11 29500 29500 6.25 12000 60000 6.31900 900 6.41400 400 6.51 3000 3000 6.618006.71 1000 1000 6.81260 260 6.91 72000 72000 6.11 21000 210002 2200 4400 6.121 10000 10000 203260 77.11 250000 2500005088004400007.31100001000069000099.11850085009.19999999999999931295002950038000序号数量单价(元)42U高度标准加深型服务器机柜(16孔PDU电源×2,走线槽,10对支架)操作系统WindowsServer2012R2(教育版授权)数据库MYSQL数据库软件VmwarevSphere6EnterprisePlus媒体云桌面开放式工具管理平台虚拟主机(云工具)虚拟机管理工具开放式实验室管理平台手写板、数位板(绘画板、绘图板)接口类型USB接口外型尺寸2771897.5毫米感应区尺寸216135毫米(8.55.3英寸)感应方式电磁共振感应方式分辨率100线/毫米(2540线/英寸)摄影机(套装)超小型便携式摄影机10台/套分辨率:19201080分辨率,30帧的视频拍摄及记录视频格式:H.264编码,mp4文件格式记录支持照片和摄像两种拍摄模式快门:自动,固定聚焦局支持曝光值补偿裸机防水:3M防尘处理时时彩屏超长待机360度框架采用单片的高强度专门针对配套的摄影机量身制作360度支架支持360度摄像和拍照的即插即用支持10架摄影机带有摄影同步工具和小型拆卸工具,以及底座超轻的重量360360全角度支持3/8和1/4三脚架底座支撑脚架灯腿电池(套装)摄像机配套电池10块/套1700mAh可充电锂电池充电器(套装)支持对摄像机配套电池充电10个/套存储卡(套装)64GB存储卡10块/套TF卡高达48MB/s存储速度多头充电器支持16个USB接口每个接口输出1.8A电量支持USB3.0VR缝合系统工作站CPU:3.6GHz4核心处理器内存:16GDDR3内存显卡:nVIDIAGTX980硬盘:480GBSSD硬盘光驱:DVDROM键盘:USBWindows键盘鼠标:光电鼠标(1000DPI),USB-redwheel操作系统:Windows864位专业版-简体中文显示器:24英寸IPSLED背光显示器,1920x1200分辨率,细节分毫必现360度全景内容体验系统虚拟现实头盔带有遥控器采用沉浸式体验支持360度全景模拟带有vr播放客户端安全可靠防辐射可调整瞳距亚洲面孔的人体工程学设计2.5K视网膜屏打印机扫描仪动漫设计数位板广告专业印刷流程设备三、VR360度虚拟现实全景摄影制作实训系统VR360度虚拟现实全景摄影制作实训系统新闻数据生产虚拟仿真教学平台(新闻数据视频化、新闻数据图片化虚拟仿真教学)开放式云媒体生产工具虚拟仿真实训系统(校内私有云)开放式云媒体生产工具虚拟仿真实训系统基础架构平台开放式云媒体生产工具虚拟仿真实训平台操作系统与数据库文传学院融合媒体虚拟仿真实训教学平台建设(一期)一、媒体制作工具虚拟仿真实训平台参数性能总价(元)产品名称小计:四、数据新闻制作虚拟仿真教学平台(新闻数据视频化、新闻数据图片化虚拟仿真教学)序号分项描述分项费用描述金额(元)一生产工具虚拟仿真实训平台二图文组版虚拟仿真设计平台报刊图文组版生产虚拟仿真设计平台三VR360度虚拟现实全景摄影制作实训系统四新闻数据生产虚拟仿真教学平台新闻数据生产虚拟仿真教学平台(新闻数据视频化、新闻数据图片化虚拟仿真教学)广告专业印刷流程设备合计主机:S5710-52C-EI-AC(48个10/100/1000Base-T以太网端口,双子卡槽位,冗余电源) 主要参数产品类型千兆以太网交换机应用层级三层传输速率10/100/1000Mbps交换方式存储-转发背板带宽416Gbps包转发率192MppsMAC地址表32K端口参数端口结构非模块化端口数量52个端口描述48个10/100/1000Base-T接口,4个10GESFP+接口控制端口2个扩展插槽G2HD高标清三维图文在线包装系统数据新闻视频化创作软件三维图形创作系统iArtistV3三维图形创作软件V1.01)制作软件有基本的三维模型,如球形、圆盘,方块等,是真三维设计软件,支持三维建模;2)支持三维模型运动轨迹设计,轨迹可以是直线、曲线或自行设计;3)支持常用的3D/2D特效,可以对物体做移动、旋转、缩放、卷页等特效;4)支持对外来实时视频进行三维DVE处理,例如移动、旋转、缩放等效果;5)支持常用的图片格式(TGA、jpeg、bmp、png等),支持图像的Alpha通道,支持TGA序列的导入,支持TGA序列中的Alpha通道;6)支持3DMax、Maya等常用三维设计软件输出的标准三维模型的导入,并能够编辑导入的模型;7)可读取外部数据库,根据数据库信息实时变换文本或图形,当外部数据断开时支持对文本和图形的手动更新;支持天气数据滚动播出;8)具备与资讯采集审核模块的数据接口,能够根据资讯采集审核模块发送过来的数据以走马、柱图、饼图、曲线图等形式进行播出。
16排螺旋CT诊断腹主动脉瘤的临床应用
1
6 m, 7 瘤体最长 9 6mm。2 9例伴有内附壁血栓及钙化 , 中 其 5例合 并主动脉夹层 , 3例合 并髂 总动脉瘤 ;真性动 脉瘤 2 6
例 ( A A 9例 )假 性 动 脉 瘤 2例 。 胸 A ,
3 讨 论
的有 效 手 段 , 别 是 A A 分 型 , 后 评 价 可 以代 替 血 管 造 影 特 A 术 或 D A。 S
1 检 查方 法 :采 用 P ip 6排 螺旋 C . 2 hl s1 i T机 ,2 V,4 10k 10
・
70 ・ 0
用 医技杂志 21 年 7月第 l 整 ! 02 9 塑
』
£ !
丛 cl bj 壁! !2 1, ! aT g Y Q2 y ! , n .
形 态 饱 满 , 缘 角 钝 , 场 回 声 明 显 增 强 , 场 衰 减 明 显 或 不 边 前 后
给患者健康带来很大威胁 , 轻者影 响生活质量 , 重者丧失劳动 能力 , 甚至威胁生命。 因此教育脂肪肝患者 和普通人群正确认 识疾病 , 适度运动 、 合理膳食 及减 少多余热量积累等对控制脂
其 中发 现脂 肪 肝 8 6例 。
逆转恢复正常 , 而有部分重度脂肪肝 长期可发展为肝硬化 , 预 后 凶险 。肝脏 作为脂 肪代谢 的重要 器官 , 常情况下 肝细 正
胞 内含 有 约 5 %的脂 肪 ,进 出 肝 细 胞 的脂 肪 处 于 动 态 平 衡 状
1 仪器 : . 2 应用美 国 G M dcl yt B型超声诊断仪对 E e i Ss m a e
法, 对脂 肪肝 的早期诊 断和 防治 , 追踪 观察及 治疗后 复查 等
具 有 十 分重 要 的 作 用 。脂 肪 肝 是 一 种 常见 的 临 床 现 象 , 非 而
FVCOM使用手册(完整版)
An Unstructured Grid, Finite-Volume Coastal Ocean Model(无规则网格的有限体积海岸海洋模型)FVCOM User Manual(FVCOM用户手册)FVCOM软件用户许可协议 (3)第一章序言 (4)第二章:模型公式 (6)2.1 直角坐标系下的原始方程 (7)2.2 -坐标下的控制方程 (12)2.3 二维(垂直积分)方程 (13)2.4 湍流闭合模型 (15)2.4.1 水平扩散系数 (15)2.4.2 垂直旋转粘性和热扩散系数 (16)2.5 球面坐标系下的原始方程 (24)第三章有限体积离散法 (27)3.1 不规则三角网格的设计 (27)3.2 笛卡尔坐标下的离散方法 (29)3.2.1 二维外部模式 (29)3.2.2 三维内模式 (37)3.3 外部与内部模式的输运一致性 (44)3.4 干/湿处理方法 (46)3.4.1 标准 (48)3.4.2 Isplit的上限 (52)3.5 球坐标系下的有限体积离散方法 (57)3.6 岸边界条件的微元处理 (63)第四章:外部强迫 (66)4.1 风应力、热通量和降水/蒸发 (66)4.2 潮汐强迫 (67)4.3 增加海岸或江河流量的方法 (69)4.3.1 TCE方法 (69)4.3.2 MCE方法 (72)4.4 水平分辨率和时间步长的规范 (74)4.5 通过底部输入地下水 (77)4.5.1 简单盐平衡地下水通量形式 (77)4.5.2 地下水输入的完全格式 (78)第五章:开边界处理 (79)5.1 开边界处理的初始设定 (79)5.2 普遍辐射开边界条件 (82)5.3 新的有限体积开边界条件模块 (87)第六章:数据同化方法 (97)6.1 推导方法 (100)6.2 OI方法 (102)6.3 Kalman筛选 (104)6.3.1减小序列Kalman筛选(RRKF) (106)6.3.2 集合Kalman筛选(EnKF) (109)6.3.3 集合平方根Kalman过滤(EnSRF) (111)6.3.4. 集合变换 Kalman筛选 (ETKF) (113)6.3.5确认实验 (114)第七章:FVCOM沉积模块 (120)7.1 控制方程 (121)7.2 简单测试情况 (122)第八章:FVCOM生物模块 (123)8.1灵活生物模块(FBM) (124)8.1.1 FBM流程图 (124)8.1.2 FBM中的方程和函数 (126)8.2 提前选择生物模块 (157)8.2.1 养分-浮游植物-浮游动物(NPZ模型) (158)8.2.2 磷限制低养分层食物网模型 (160)8.2.3. The Multi-Species NPZD Model (168)8.2.3 多物种NPZD模型 (168)8.2.4 水质量模型 (171)第九章:示踪-追踪模型 (174)第十章:三维拉格朗日粒子追踪 (175)第十二章:代码平行 (193)12.1 区域分解 (194)12.2 区域设置 (195)12.3 数据交换 (196)12.4数据收集 (197)12.5 执行 (198)第十三章:模型代码描述和总说明 (199)13.1 在使用FVCOM前的用户应知 (199)13.3 数值稳定的标准 (206)13.4子程序和函数描述 (207)第14章模式安装,编译和运行 (231)14.1 获得FVCOM (232)14.2a 编译METIS库 (233)14.2b 编译FVCOM (233)14.3a 运行FVCOM(连续) (238)14.3b 运行FVCOM(平行) (239)第十五章:模型设置 (240)15.1 FVCOM运行时间控制变量文件casename_run.dat (240)15.2 FVCOM输入文件 (253)15.3特殊设置的必需输入文件 (256)15.4 原始输入文件的输入文件格式 (257)15.5 建立和使用FVCOM模块 (268)第十六章:FVCOM测试例子 (292)第十七章:不规则三角形网格产生 (319)17.1数据准备 (320)17.2 网格产生 (324)感谢 (347)参考文献 (348)FVCOM Software Users’ License AgreementFVCOM软件用户许可协议All users should read this agreement carefully. A user, who receives any version of the source code of FVCOM, must accept all the terms and conditions of this agreement and also agree that this agreement is like any written negotiated agreement signed by you. You may be required to have another written agreement directly with Dr. Changsheng Chen at SMAST/UMASS-D and Dr. Robert C. Beardsley at WHOI 所有用户须仔细阅读此协议。
2016 ACCMS Conference Manual
A poster board, 95 cm wide and 200 cm high with one light on top will be provided to mount your poster. Your presentation will be limited to this area. Be sure to include the title of the abstract, authors and affiliations should be at the top of your poster centered.
Guide for Poster Presentation
Poster session is considered as a very important communication method in ACCMS-4, where in-depth discussion occurs to share the research results and information. 112 papers of high quality research will be posted during conference period (from Sept. 13th to 16th) to enhance discussion among the attendants.
sters are supposed to be set-up on Sept 13th in the poster room. Posters should be displayed during the conference for in-depth discussion. Posters can be taken off in the morning of Sept. 16th. During the poster session (16:15-18:15 Sept. 14, 2007), the researchers are supposed to be present by their poster to answer questions.