Optimization of the electrical discharge machining process
10_kV供配电系统智能化设计与优化方法
运营维护技术供配电系统智能化设计与优化方法陈志婷(佛山电力设计院有限公司,广东佛山探索并提出一种综合的智能化设计与优化方法,以提高10 kV供配电系统的智能化设计,包括系统架构、数据采集、智能传感器应用、数据处理以及实时监测控制策略。
研究了配电网电压控制优化方法和配电网损耗降低优化方法,探索了智能算法在电网优化中的应用。
通过实验和案例分析,验证了所提方法的有效性,并总结了电力系统未来发展的方向。
供配电系统;电力系统优化;智能算法;实时监测Intelligent Design and Optimization Method of 10 kV Power Supply andDistribution SystemCHEN Zhiting(Foshan Electric Power Design Institute Co., Ltd., FoshanAbstract: This study aims to explore and propose a comprehensive intelligent design and optimization method10kV power supply andTelecom Power Technology保及时传递数据。
三是中央控制系统。
中央控制系统是智能化设计的大脑,由计算机服务器、存储设备和软件组成,用于处理和分析从数据采集子系统收集的。
中央控制系统可以实施高级控制策略,如故障检测以及自动切换等。
四是智能算法,智能算法是系统的智能化核心,用于优化电力系统的运行,包括电力流分析、负荷预测、能源管理以及优化调度等。
这些算法可以提高系统效率,减少能源浪费,并支持可再生能源的集成。
效存储和检索需求。
最后,要充分考虑数据安全性和备份策略,以确保数据的保密性和可用性。
实时数据分析和决策系统允许电力系统运营者及时响应,通过实时监测和数据分析,识别故障、异常和潜在问题,以实现自动化的远程操作、设备控制和告警通知。
英语作文-如何在集成电路设计中实现功耗优化与节能减排

英语作文-如何在集成电路设计中实现功耗优化与节能减排In modern integrated circuit (IC) design, optimizing power consumption and achieving energy efficiency are critical goals. As technology advances and demands for more efficient electronic devices grow, engineers face increasing pressure to reduce power consumption while maintaining performance. This article explores various strategies and techniques employed in IC design to achieve power optimization and contribute to energy conservation and emission reduction efforts.### Understanding Power Consumption in ICs。
Power consumption in ICs primarily consists of dynamic power dissipation (P_dyn) and static power dissipation (P_static). Dynamic power is associated with switching activities of transistors during computation, while static power arises from leakage currents even when transistors are not switching. Reducing both types of power is essential for energy-efficient designs.### Techniques for Power Optimization。
2009.1_Optimization_of_Die_Design_for_Forging_of_a_Turbo-Charger_Impeller_and_a_Ring_Gear_Using_Proc
Optimization of Die Design for Forging a Turbo-Charger Impeller and a RingGear Using Process SimulationJay Gunasekera, PhD, DSc, PE, Professor of Mechanical Engineering, Ohio University, USA, Mazyad Al-Moheib and Fahad Al-Mufadi, Former PhD students at Ohio University, USASYNOPSIS: The objective of this project was to optimize the preform and final die design for two complex automotive forged products (a turbine impeller and a ring gear) for two different forging companies in the US. The turbine impeller has to have a minimum effective plastic strain of 0.5 in order to increase the toughness and resist fracture due to the very high centrifugal stresses. It is also important to distribute the strain and the grain size as uniformly as possible throughout the finished forged part, so as to achieve the best mechanical properties for the Al 2618 turbine wheel. Optimization of grain size was performed by determining optimal temperature and average strain rate (by the use of Zener-Hollomon Parameter). The second project was to optimize the die design for a steel Ring Gear, so as to reduce the number of forging stages and also reduce the material wastage due to excessive flash. The software used was MSC.SuperForge, the predecessor of Simufact.forming, which is capable of checking the die filling, defect formation and die contact in the final stage. It can also determine and display a variety of useful parameters such as; the effective plastic strain, effective strain rate, effective stress, material flow, temperature, force-time relationship and final shape by using Superforge-FV (Finite Volume) simulation. It is concluded that the software can be effectively used to optimize the forging process to maximize the mechanical strength, minimize material scrap & forging stages and hence reduce the overall cost of manufacture.1.INTRODUCTION:The objective of this project was to optimize the preform and final die design for two complex automotive forged products. The first part is a turbo-charger impeller (or turbine wheel) made of aluminum. This part rotates at very high speed (up to 100,000 RPM), accelerates rapidly from rest and has very high centrifugal stresses. The new preform dies have to be designed, so that the effective plastic strain in the dead metal zone of this part can be increased to a value greater than 0.5. The yield strength can also be increased by the optimization of the new preform die design since it increases the low effective plastic strain in the dead metal zone. This also leads to a near uniform effective plastic strain throughout the formed product. Referring to Figure 1, it can be seen that a flat preform die was previously used in the forged rotating part with alloy AA2618. Referring to Figure 2, a die with the final contour was used to obtain an effective plastic strain greater than 0.5 in the final product. However, this does not result in an overall uniform plastic strain greater than 0.5. A problem associated with this product is the presence of low effective plastic strain which is displayed in Figures 1 and 2 by the regions of blue known as Dead Metal Zone (DMZ) [1].Figure 1 Strain contours with flat die Figure 2 Final strain contours with flat dieThe goal is to achieve the best mechanical properties throughout the forged rotating part made from AA 2618. The main advantage of the hot forging operation is gained by decreasing the inhomogenities of the workpiece; porosities are eliminated because of fusion of cavities. Another goal is the optimization of the Zener-Holloman parameter, Z, by determining an optimal temperature and an average strain rate, in order to get an indication of the grain size of the material. The Zener Holloman parameter increases with an increase in the average strain rate and the average strain rate increases with an increase in the effective plastic strain or decrease in forging time. It is also increased by a decrease in the forging temperature. The coarse columnar grains are replaced by smaller equiaxed, recrystallized grains that give an increase in ductility and toughness. This would decrease the strength in a direct forging, but, a preform where the magnitude of the strain has been increased would preserve the strength of the material.The second part is a ring gear [2], and the objective here was to reduce the number of forging stages and also reduce any material wastage. FEM forward simulation has played a significant role in predicting the deformation flow patterns and has improved the quality of the product. However, the main role of FEM is to verify the die designs accomplished by using empirical relationships or based on engineering practice [3]. Usually, a number of preforms are needed in order to achieve the final complex shape from the initial simple shape with the optimal properties and geometrical tolerance in metal forming processes. Forging preform design is determined via backward deformation simulations using a procedure similar to die design procedure where the die shapes and process parameters are determined based on the final product shape as well as the material properties requirements. Consequently, forging pre-form design process using backward simulation has a very important function in forging die design process. Optimizing the entire forging process to obtain the desired forging properties such as achieving proper die-fill, reducing the material waste, reducing the die wear, obtaining favorable grain flow and the load required can be fulfilled by using adequate and appropriate pre-forms [3].UBET (Upper Bound Element Technique) was used for the backward simulation to obtain an optimal perform and then Finite Volume Method (Simufact.forming software) was used to do the forward simulation and verify the design. UBET has been developed and used by manyresearchers; for example Lee et al. [4] used UBET to analyze the forging load, die filling, and the effective strain for forgings with and without flash gap. The program was applied to both axisymmetric and non-axisymmetric closed die forging as well as plane strain closed die forging with rib-web type cavity. The results obtained from this study were compared with experimental results in which, a good agreement was achieved. A pre-form design approach that incorporates both FEM-based forward simulations and UBET-based backward simulations was developed by Liu, et al. [5]. Bramley, [6], has employed TEUBA, which is a UBET-based computer program for the process of forging pre-form design using reverse simulations. This approach is based on reversing the flow by starting from the desired final shape with the die velocities reversed in such a way that the material at the end of the deepest die cavity is considered to have a free boundary and material flows backward up to certain time step where the dies are separated from the billet, which gives the pre-form of the process. A finite element-based inverse die contact tracking method to design the perform die shapes of a generic turbine-disk forging process was used by Zhao, et al. [7]. Finally, M. Mohelib and J.S. Gunasekera [8] used UBET for backward simulation in Ring Rolling and for forging a Ring Gear. The Ring Gear project is reported in this paper. The theory of UBET can be found in a number of excellent publications and will not be repeated here.2.TURBINE WHEEL ANALYSIS [1]The development of Finite Element Analysis (FEA) techniques has provided an important link between advances in die and equipment design and an improved understanding of materials behavior. Inputs to the FE codes include the characteristics of the work piece material (flow stress and thermal properties) and the tool/work piece interface (friction and heat transfer properties), as well as work piece and tooling geometries. Typical outputs include predictions for forming load, strain, strain rate and temperature contour plots, and tooling deflections. The method of study for this model is:1.The models are first made in CAD software such as SOLID EDGE for the billets and forpreform (upsetting dies) as well as closed die forging in both the upper and lower dies.This model is exported for three-dimensional FEA techniques such as FV (Finite Volume) analysis (simulation) of actual die forging of the rotating part with SUPERFORGE [9] to find flaws in the design of the preform.2.To focus on optimizing the preform design.3.To define the best preform design and finished work piece based on optimization resultsand to verify the applicability of this method.One of the most important aspects of the closed-die forging process is the design of preforms (or blockers) to achieve adequate metal distribution. With the proper preform design, defect-free metal flow and complete die fill can be achieved in the final forging operation and metal losses into flash can be minimized. The determination of the preform configuration is an especially difficult task involving thorough metal flow understanding.The 3D modeling software SolidEdge is used to model parts, billets and dies. SolidEdge has an option by which volume of the modeled part can be found. SolidEdge provides the option of Boolean operation by which a specific shape can be subtracted or added to another shape. For this research, lower-die and upper-die are modeled without Boolean operations. Simufact SUPERFORGE is used to simulate the forging process.3.FINITE VOLUME METHODThe traditional finite element mesh distorts when an effort is made to track the deformation of the material. However, when the finite volume method is used, the computational mesh uses a finite volume mesh with an unchanging frame of reference when the material of the billet flows through the mesh. The energy, the mass and the momentum of the material are transported from one component to another. The grid points for the finite volume solver are preset in space and the elements are just partitions of the space defined by the connected grid points. The material of the billet beneath analysis moves throughout the finite volume mesh. Thus, the movement of the material via the elements of constant volume is computed by the finite volume solver. The dies work like a boundary to the flow of material in a forging simulation employing the finite volume mesh, where as the stresses present in the material contained by the finite volume mesh apply forces on the surfaces of the dies. In the finite volume technique, the mesh must be big enough to cover the material of the work piece once deformation has taken place. A fundamental finite element mesh also acts like a container and the material cannot depart the mesh. From a finite volume mesh, stress wave reflections and pressure buildup develop, but are not significant enough to be analyzed. FVM computer modeling is favorable for simulating gross material deformations intrinsic in forging operations due to this distinctive feature. Moreover, the requirement for remeshing techniques which are usually thought to be the major bottlenecks in 3-D forging simulations based on the finite element method, is totally eliminated [9,10].Figure 3 Model of upper dies, lower dies and billetsIt is important to understand the effect of different preform designs for the minimum effective plastic strain, and the comparison of range of values in order to determine the uniformity of the effective plastic strain in the work piece.Ten geometrically differing preform dies were designed to analyze the effective plastic strain in the workpiece with the objective being to find the highest value for minimum effective plastic strain and also the minimum range (difference between maximum and minimum) for effective plastic strain. This minimum range indicates the most uniform effective plastic strain for a particular preform.Table 1 shows the ten different geometries of the die designs used. The design of the preform with the best geometry helps to increase the minimum effective plastic strain and also creates uniformity in the workpiece. The best designs had a conical protrusion in the perform die to penetrate the dead metal zone (DMZ).Table 1: Preform design for all test casesData obtained for the effective plastic strain for maximum, minimum, and range of difference is shown in Table 2. This data was collected after simulating the ten different kinds of preform die designs which can be seen in Table 1. Die temperatures, billet temperatures, and interface friction factor were fixed for all cases. The work piece temperature was 425 C, initial die temperature 250 C, and friction factor was 0.8.Table 2: Values of effective plastic strain obtained by change in preform die designTen different preforms were designed and analyzed to obtain the final product in one and two preform stages. From this study, it can be concluded that the two stage preform with a flat lower die and an upper die with a 10° base angle protruding cone is best in terms of increasing the minimum effective plastic strain for uniform distribution and filling the dies in the final stage. After studying different combinations of workpiece temperature, die temperature, and friction factor, the following values were found to be the most optimal: work-piece temperature 425 C, die temperature 250 C, and interface friction factor of 0.3. An optimal average strain and the highest minimum strain were calculated for these values. The final simulation results are shown in Figure 4.Figure 4: Effective Plastic Strain using preform with cone angle 10°D. M. Z.The three images correspond to the first stage preform, the second stage preform, and the shape obtained in the final stage. The arrows in the final shape image point to the minimum effective plastic strain which is present in the dead metal zone areas, but they are all over 0.75 effective strain.The Zener-Holloman parameter was calculated and is shown in Figure 5. Good values were obtained for the Zener-Holloman parameter as the parameter was uniform and the range of difference was not too high. This is so because; the power of both the lower and upper values for Z is the same;12121048.31087.1⨯≤≤⨯Z . Zener-Holloman parameter is defined as;.exp ()QZ RTε= In the above expression, Q is the activation energy for deformation, 161kJ/mole, R is the universal gas constant, 8.314 J/mole-K, and T is the absolute temperature.Figure 5: Zener Hollomon parameter4. VALIDATION OF RESULTSTo substantiate the research work carried out, the experimental results were compared to the ones obtained by simulation. This comparison displayed the accuracy of the research work and, hence, validated the research. The dies were industrially fabricated for experimental work, which has been done in order to compare it with the simulation. The dimensions of the work piece and the filling of the die in the simulation were compared with the results of the actual experiment. (The experimental work was carried out to validate the computed results of the forging simulation using the Finite Volume method.)It is important to compare the dimensions of the part, obtained by simulation with that of actual experimentation, in order to see how good the results are. An actual product was obtained after the experimental work was carried out for all the three stages of the part forging. Analysis through simulation is beneficial in many ways. Real-time results can be obtained in the simulation without actual experimentation. Simulation also reduces various experimental costs, saves money on materials, and eliminates valuable experimentation time. (All the experiments-actual forgings were done at the Queen City Forging Co).Figure 6: Results obtained for the preform and final stages in the industryThe results obtained by experimentation are closely confirmed by those obtained by simulation, hence, validating the theoretical part forging obtained by the Finite Volume Method. The percentage error between the Finite Volume Method simulation results and the experimental results in relation to matching the heights and diameters has been found to lie in the range of 1.311 % - 8.055 % in the perform stage and 0.030 % - 6.019 % in the final stage . Thus, the Finite Volume Method simulation results closely resembled with the experimental results. The error present may have been due to the size of the elements in the edges and corner or due to possible manual error during the experimental work. Consequently, the Finite Volume Method appears to be a good method for the simulation of forging in the preform and final shape.5.RING GEAR ANALYSIS [2]Backward simulations using volume mapping approach can be carried out by reversing the boundary velocity field obtained to calculate the new backward geometry of the billetcorresponding to the upper die moving backward (upward) through one backward increment. The procedure is graphically shown in the following flow chart (Figure 7) and the main steps of this process can be summarized as follows:∙The final product geometry, finisher die and processing conditions are employed to establish the initial UBET model for the reverse deformation simulation.∙Start with final shape (die filled or almost filled)∙The final shape is divided using straight lines segments into a number of elements rectangular or triangular according to the change of slope of the die-surface geometry.∙Kinematical admissible velocity fields are derived based on step 2, by using volume mapping approach.∙Backward simulation is conducted by reversing the boundary velocity fields.∙ A backward step is taken to update the work-piece geometry and die position based on the velocity field from the previous backward step.∙The procedure is repeated until the desired separation of the dies is reached.∙When the stopping criterion is satisfied, the backward simulation is terminated.∙FEM forward simulations is then carried out in order verify the pre-form obtained by backward simulations.6.RESULTS AND DISCUSSIONThe forging of a ring gear blank for differentials in automobiles is considered. A volume mapping technique was used to determine the optimum intermediate shape for forging using backward simulation. The final part is divided into features, which provide an approximated profile consisting of a number of rectangular and triangular elements. It was intended from the present work to achieve proper forging strategy of the ring gear blank forging process through optimizing and reducing the following:(a)Material wastage during the multi-stage forging of ring gear blanks(b)Reduce the number of forging (and material handling) stages from 3 to 2, and(c)The initial billet temperature from about 2100o F to about 1800o FThe above tasks were accomplished by conducting a backward simulation using a volume mapping technique and iterative forward simulation using Finite Element Analysis of the gear blank forging process. Usually, a number of preforms are needed in order to achieve the final complex shape from the initial simple shape with the optimal properties and geometrical tolerance in metal forming processes [2]. The ring gear blank forging process is a multi-stage forging process in which three stages are currently involved in manufacturing the final part. These three current stages were simulated using Simufact.forming in order to verify the commercial software. Both 2D (axisymmetric) and 3D forging simulations were conducted for this purpose. In order to reduce the number of forging (and material handling) stages, a preform has to be obtained so that the final shape can be attained by only two stages, which will reduce the cost and time of material handling as well as the material wastage. Based on volume mapping approach, the kinematical admissible velocity fields are derived, and the preform geometry of the second stage forging was obtained by backward simulations. The material used was steel AISI-4337 and was performed at temperature of 2100o F and then reduced to about 1800o F. The preform obtained by volume mapping approach (Figure 8) is verified by conducting forward computer simulations using SIMUFACT.FORMING.Several forward computer simulations including 2D (axisymmetric) and 3D forging simulations were conducted in order to optimize the ring gear forging process. The forming temperature was reduced from about 2100o F to about 1800o F which will have a huge impact in increasing the die life. Also, the martial wastage can be reduced from about 5 % to about 17.5 % volume reduction. A volume reduction of 5% to about 10 % with 0.1 in and 0.2 in machining allowance could be achieved. The forming process can be carried out using flash-less precision forging (case--1) with 10% volume reduction as shown in Figure 9.Up to 17.5 % volume reduction can be achieved by conducting net shape forging in which only 0.02 in machining allowance is used. The 1st stage forging was performed using different aspect ratios (height to diameter) of the initial stock (billet). The simulations results 2D and 3D for the net shape forging (case--2) are shown in Figure 10 and Figure11 respectively, also the lower dies for both stages (case--3) were modeled with circular pockets so that the operators can position the workpiece at the center of the lower dies as shown in Figure 12.The forging of a ring gear blank for differentials in automobiles is considered. A volume mapping technique was used to determine the optimum intermediate shape for forging using backward simulation. The final part is divided into features, which provide an approximated profile consisting of a number of rectangular and triangular elements. The development of a volume mapping technique to arrive at an optimum pre-form/blocker forge geometry to minimize material usage and also reduce the number of forging stages was considered. A 2-D (axis-symmetric) and 3D computer model were used to simulate the forging process (forward simulation) and to ensure proper die fill. The simulations showed that the present method can successfully determine the optimum intermediate (preform) shape of the forging process. The significance of various process parameters, such as the intermediate geometry, the optimum aspect ratio of billet, forming temperature, and forming load were determined using the simulations results.7.CONCLUSIONS:In this research, the development of a volume mapping technique to arrive at an optimum preform/blocker forge geometry to minimize material usage and also reduce the number of forging stages of the ring gear blank forging (real problem from industry) was considered. A 2D (axis-symmetric) and 3D computer models (using SIMUFACT.FORMING) were used to simulate the forging process (forward simulation) and to ensure proper die fill. The simulations showed that the present method can successfully determine the optimum intermediate (preform) shape of the forging process. From the simulations results, it can be concluded that the developed method has the capability to determine the significance of various process parameters, such as the intermediate geometry, the optimum aspect ratio of billet, forming temperature, and forming load. Also, from optimizing the different process parameters through the simulations, all of the below tasks were met:∙Forging stages were reduced from 3 stages to 2 stages, and the final shape of the ring gear blank was achieved with complete die fill using the preforms obtained byvolume mapping approach.∙The initial billet temperature can be reduced to 1800o F.∙The final stage can be carried out using flash-less precision forging in which the material wastage can be reduced to about 10%.∙The final stage can be carried out using net shape forging in which material wastage can be reduced to about 17.5 %.Based on the above, it can be concluded that the developed method has the capability to reduce the number of forging stages. This will reduce the material handling, the material wastage as well as reduce the cost of the operation, with the large volume produced of the part in industry.8.ACKNOWLEGEMENTSThe authors wish to thank Queen City Forging Co., American Axle & Manufacturing Inc. and Forging Industry Association-FIERF for their technical and financial support to conduct these research projects. Both the former PhD students obtained their PhDs at Ohio University and are now Professors in two Universities in Saudi Arabia-address not known.9.REFERENCES1.Fahad Al-Mufadi, Optimization of a New Preform Die Design for Forging a Rotating Partusing Computer Modeling and Analysis, PhD, Ohio University June 20042.Mazyad M. Al-Mohaileb, Computer Modeling of Complex Metal Forming Processes usingthe Upper Bpund Elemental Technique (UBET), PhD, Ohio University Oct. 20033.Altan, T., Oh, S., Gegel, H., Metal Forming Fundamentals and Applications, AmericanSociety for Metals, 1995.4.Lee, J., H., Kim, Y., H., and Bae, W., B., “A Study on Flash and Flashless Precision Forgingby the Upper Bound Elemental Technique” Journal of Material Processing Technology 72 (1997) 371-379.5.Liu, Q., Shichun, W., Sheng, S., “Preform Design in Axisymmetric Forging by a New FEM-UBET Method” Journal of Material Processing Technology 74 (1998) 218-2226.Bramley A., N., “UBET and TEUBA: Fast Methods for Forging Simulation and PreformDesign” Journal of Material Processing Technology 116 (2001) 62-667.Zhao, G., Zaho, Z., Wang, T., and Grandhi, R., V., “P reform Design of a Generic TurbineDisk Forging Process” Journal of Material Processing Technology 84 (1998) 193-2018.Mazyad Almohaileb and Jay Gunasekera, Modeling of Profile Ring Rolling using theModified Upper Bound Elemental Technique, Intl Conf on Advances in Materials andprocessing Technologies, July 30-Aug 3, 2006, Las Vegas, NV9.MSC/Super Forge User’s Manual (Version 1.0), The MacNeal- Schwendler Corporation,1998 (now replaced by Simufact.forming software).。
优化供电系统英语作文

优化供电系统英语作文Title: Optimizing Power Supply Systems。
In today's rapidly evolving technological landscape, the optimization of power supply systems is paramount for ensuring efficiency, reliability, and sustainability. With the increasing demand for electricity driven by industrialization and digitalization, it is imperative to develop strategies to enhance power supply systems. In this essay, we will explore various approaches to optimize power supply systems.Firstly, embracing renewable energy sources is key to optimizing power supply systems. Renewable sources such as solar, wind, hydro, and geothermal energy offer sustainable alternatives to traditional fossil fuels. Integrating these sources into the power grid reduces reliance on non-renewable resources and mitigates environmental impacts such as greenhouse gas emissions. Moreover, advancements in renewable energy technologies have led to increasedefficiency and affordability, making them viable optionsfor large-scale power generation.Secondly, implementing smart grid technologies plays a crucial role in optimizing power supply systems. Smart grids utilize advanced monitoring, control, and communication technologies to enhance the efficiency and reliability of electricity distribution. By incorporating sensors, meters, and automated systems, smart grids enable real-time monitoring of energy consumption, detection of faults, and optimization of grid operations. Additionally, smart grids facilitate the integration of distributed energy resources such as rooftop solar panels and electric vehicle charging stations, further diversifying the energy mix and improving grid resilience.Furthermore, enhancing energy storage capabilities is essential for optimizing power supply systems. Energy storage technologies such as batteries, pumped hydro storage, and thermal storage enable the capture and storage of excess energy during periods of low demand for later use during peak demand periods. Energy storage systems helpbalance supply and demand, reduce reliance on backup power plants, and support the integration of intermittent renewable energy sources into the grid. Advances in energy storage technology, including improvements in energydensity and cycle life, are driving down costs and increasing the scalability of storage solutions.Moreover, promoting energy efficiency initiatives is a cost-effective way to optimize power supply systems. Energy efficiency measures, such as retrofitting buildings with energy-efficient appliances, upgrading industrial equipment, and implementing energy management systems, reduce overall electricity consumption and alleviate strain on the power grid. Additionally, energy efficiency programs help lower energy bills for consumers, enhance energy security, and contribute to climate change mitigation efforts by reducing carbon emissions associated with energy production.In addition to technological advancements, policy and regulatory frameworks play a vital role in optimizing power supply systems. Governments and regulatory bodies can incentivize investments in renewable energy, smart gridinfrastructure, and energy storage through subsidies, tax incentives, and favorable market conditions. Furthermore, establishing clear regulatory guidelines and standards promotes the adoption of best practices in power generation, transmission, and distribution, ensuring safety,reliability, and interoperability across the grid.In conclusion, optimizing power supply systems requires a multifaceted approach that integrates technological innovation, policy support, and stakeholder collaboration. By embracing renewable energy, deploying smart grid technologies, enhancing energy storage capabilities, promoting energy efficiency initiatives, and implementing supportive policy measures, we can create a more resilient, sustainable, and efficient power supply infrastructure to meet the growing energy needs of society. Only through concerted efforts and strategic investments can we build a brighter and more sustainable energy future.。
钛合金表面的电火花着色加工技术
钛合金表面的电火花着色加工技术高上品(上海第八机床厂,上海200030)摘要:介绍了利用电火花加工技术对钛合金表面着色的原理、加工过程、工艺特性、表面质量和应用实例,指出了该技术的实用价值和应用前景。
关键词:钛合金;电火花加工;表面着色;氧化膜钛是一种重量轻、强度高、耐蚀性强的金属材料,用途很广。
在航天航空和机械制造等工业部门甚至在生活日用品中均有应用。
钛表面呈银白色,类似于不锈钢和铝的表面。
由于产品表面的颜色往往影响到产品本身的价值,因此,对产品表面色彩的要求日益受到重视,在这种需求的背景之下,研究开发了钛合金表面的电火花着色加工技术,这也是电加工领域中出现的一项新的加工技术。
钛合金表面的着色加工通常是采用电解阳极氧化法,但这种方法的工艺过程较为复杂,成本也较高。
相比之下,电火花表面着色的加工方法则工艺过程简单,并可获得不同颜色的加工表面,是一种值得推广使用的着色加工方法。
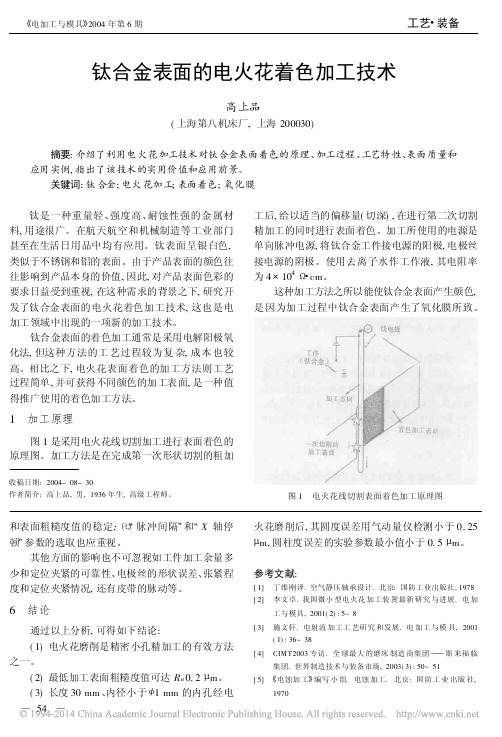
1加工原理图1是采用电火花线切割加工进行表面着色的原理图。
加工方法是在完成第一次形状切割的粗加收稿日期:2004-08-30作者简介:高上品,男,1936年生,高级工程师。
工后,给以适当的偏移量(切深),在进行第二次切割精加工的同时进行表面着色。
加工所使用的电源是单向脉冲电源,将钛合金工件接电源的阳极,电极丝接电源的阴极。
使用去离子水作工作液,其电阻率为4@1048#cm。
这种加工方法之所以能使钛合金表面产生颜色,是因为加工过程中钛合金表面产生了氧化膜所致。
图1电火花线切割表面着色加工原理图和表面粗糙度值的稳定;À/脉冲间隔0和/X轴停顿0参数的选取也应重视。
其他方面的影响也不可忽视如工件加工余量多少和定位夹紧的可靠性、电极丝的形状误差、张紧程度和定位夹紧情况,还有皮带的脉动等。
6结论通过以上分析,可得如下结论:(1)电火花磨削是精密小孔精加工的有效方法之一。
(2)最低加工表面粗糙度值可达R a0.2L m。
(3)长度30mm、内径小于<1mm的内孔经电火花磨削后,其圆度误差用气动量仪检测小于0.25 L m,圆柱度误差的实验参数最小值小于0.5L m。
the electrical conductivity was conducted

the electrical conductivity wasconductedThe electrical conductivity is a fundamental property that describes how well a material conducts electricity. It is a crucial parameter in various applications, ranging from power transmission to electronic devices. Therefore, it is essential to measure the electrical conductivity accurately.The measurement of electrical conductivity is typically done using a conductivity meter. This instrument applies a constant voltage across two electrodes immersed in the material being tested. The current that flows through the material is then measured, and the electrical conductivity is calculated based on the applied voltage and the measured current.The accuracy of the measurement depends on several factors. Firstly, the electrodes must be clean and free from corrosion or deposits. Any fouling on the electrodes can lead to measurement errors. Therefore, it is essential to clean the electrodes regularly or to use disposable electrodes for each measurement.Secondly, the temperature of the material being tested can affect the electrical conductivity. Many materials have their electrical conductivity optimum at certain temperatures. Therefore, it is essential to control the temperature of the material during the measurement. This can be achieved using temperature-controlled chambers or by immersing the electrodes in a temperature-controlled bath.Thirdly, the calibration of the conductivity meter is crucial for accurate measurements. Regular calibration using standards of known conductivity can ensure that the instrument is accurate and reliable. It is recommended to perform calibration at least once a year or after any significant instrument repair or modification.In conclusion, the measurement of electrical conductivity is crucial for various applications. It requires clean electrodes, controlled temperatures, and regularcalibration of the conductivity meter to ensure accurate and reliable measurements.。
文献翻译----功耗优化:从超低功耗到耗电系统
本科毕业设计外文文献及译文文献、资料来源:期刊文献、资料发表(出版)日期:2006.3.25院(部):专业:班级:姓名:学号:指导教师:翻译日期:外文文献:POWER OPTIMIZATIONS: FROM ULTRA-LOW POWER TOPOWER-HUNGRY SYSTEMSIn this section, we provide an overview of power optimizations targeted at four types of systems: Energy-scavenging ultra low power systems, battery operated embedded and mobile systems, plugged-in desktop machines and high-end servers. While some of the optimizations are useful across the different categories of systems, domain-specific power optimizations are effective in balancing the often conflicting design constraints. Because prototype hardware can be expensive to develop, research and development in power-aware design typically requires simulation. Depending on the technique, this may require anything from detailed circuit simulations, to cycle-by-cycle pipeline simulations, to coarse-grained, event-driven system-event simulations.Ultra Low Power SystemsThe need for ultra-low power devices has emerged in various applications such as unmonitored sensor networks and medical prosthetics, where the amount of energy that can be transferred to the implanted device from an external power source is limited. In such ultra-low power devices, energy must often be scavenged from the environment via thermal or mechanical means similar to old-fashioned self-winding watches. The amount of power available in this way is so low that, in addition to the need for low dynamic energy consumption during operational phase, it is imperative that the static power consumption in idle state is also negligible. If this condition is not met, most of energy scavenged will be wasted in static power dissipation and there will be insufficient energy to sustain the device operation. Consequently, ultra-low power devices need to deploy intelligent strategies to shutdown components or portions of the system into lower static power modes to conserve power consumption. For example, [F11] presents a multiplier design that can dynamically shut down portions of the component based on the bit width of the operands. It is also possible to reduce sampling rates of analog to digital converters or reduce theirprecision to reduce power consumption based on quality of service requirements. Significant power reduction is also possible by customizing the components for the targeted application. For example, an architecture for an event-driven sensor application with hardware support for interrupt processing can be more power efficient than a simple microcontroller that relies on operating system kernels for handling interrupts. Further, hardware acceleration blocks can be used for common sensor operations such as packet processing and forwarding to improve performance and reduce power consumption. In addition to computational blocks, memory organization can also be customized, as illustrated in[F11].In many of the ultra-low power sensing applications, the performance requirements are quite modest in comparison to desktop machines. In contrast to the few GHz clock frequencies deployed in desktop processors, these systems can meet functional requirements while operating at speeds in the range of a few KHz. This low speed requirement makes it possible to use architectures based on sub-threshold circuits. In such systems, the circuits use leakage currents to charge and discharge load capacitances and dramatically reduce overall power consumption at expense of slow operating speeds. Finding an optimal voltage to operate the system should strike a balance between the additional static power consumed due to the slower operating system with the quadratic power savings due to supply voltage reduction. In addition, the design of sub-threshold architectures pose various challenges as they are more susceptible to external noise such as soft errors and are more influenced by process variation.Embedded and Mobile SystemsThe next class of devices is the battery-operated low power embedded and mobile devices that can be recharged or replaced periodically. These devices need to prolong battery life while meeting other constraints such as system cost and quality of service requirements. Some of the embedded systems tradeoff quality of service with the power consumed. For example, portable video players can reduce the video quality or size for reducing power consumption. Since many embedded systems are driven by a constant throughput requirement rather than overall computation time, itis possible to exploit the variability in workloads to reduce power consumption. For example, the characteristics of a video stream that can be decoded by the video player at a rate faster than 30fps can be used to reduce supply voltage or increase threshold voltage. While pipelining and parallelism have been used in high-performance domains for improving performance, they can be used for reducing power in constant throughput applications, The additional slack obtained through reduced logic depth using deeper pipelining can be exploited by reducing supply voltage instead of reducing the frequency. The optimal depth of pipelining for power consumption depends on various factors such as overheads of pipeline register, activity factor of the circuit, the clock gating mechanism used to reduce activity in the pipeline registers and the ratio between leakage and dynamic energy. A parallel architecture can be used similarly to reduce power by operating multiple instances at lower voltages instead of operating a single unit faster using a higher supply voltageThe utilization of the system components varies based on the application workload. Consequently, most components of embedded systems support multiple power modes. Typically a mode with lower power consumption also incurs more performance penalty. For example, a CPU operating at a lower voltage requires a longer cycle time. The mode transition policies can be implemented either directly in hardware, or when more flexibility is required, in software. Battery operated systems also rely on improving the synergy between the software and the hardware characteristics for prolonging battery life. Example optimizations include shaping the current drawn by the system to maximize the battery efficiency and changing memory data access patterns for placing more memory modules in lower power modes. Similar to ultra-low power systems, embedded systems also rely on hardware acceleration for commonly executed tasks to reduce power consumption. For example, most portable MPEG players include an ASIC for dedicated, efficient MPEG decoding. Since many embedded applications execute a known set of applications, use of deterministic software-managed caches (scratchpad memories) is preferred to traditional hardware managed caches to obtain best performance and consequent, energy savings.Desktop SystemsDesktop systems have traditionally focused on performance as the main design metric. Consequently, numerous enhancements for performance improvement have been developed, but sometimes at the cost of increased power. Techniques such as branch prediction, value prediction, pre-fetching and predication have the potential to improve execution time, reducing energy per task, but on the other hand may increase the amount of wasted energy due to execution of instructions in the wrong path due to mis-speculation or pre-fetching blocks that will never be used. The aggressiveness of these techniques must be balanced against their potential wastefulness. Runtime feedback-directed techniques are also possible, but robust, stable control schemes are not yet available.Superscalar processors used in workstations and personal desktop systems (including high-performance laptops) also provide many opportunities for runtime adaptation to workload characteristics. [F10] provides a survey of some of these techniques. Coarse-grained adaptation, in the form of DVFS and sleep modes, is already available in many personal computers, as well as server systems, and is governed by the ACPI standard (Advanced Configuration and Power Interface). Finer-grain adaptation is possible as well. The size and complexity of many microarchitectural components such as the issue queue, register file, caches and functional units are usually designed to accommodate bursts of activity, but can often be reduced based on their predicted usage or occupancy. A smaller structure helps reduce the dynamic energy due to a smaller load capacitance and also reduce leakage energy as fewer transistors are leaking. Breaking large or heavily multi-ported structures into decoupled clusters can also help reduce dynamic energy as well as possibly improving access latency. Dynamic adaptation techniques need to carefully evaluate the overhead for supporting adaptation and the resulting influence on the power consumption of the rest of the components. Further dynamic adaptation techniques can reduce cost by permitting the thermal and cooling mechanisms to be designed based on the average case behavior. For example, on-chip thermal sensors can trigger power reduction techniques such as instruction throttling and voltagescaling when the chip temperature increases beyond a specified critical level.High-End ServersIn contrast to the ultra-low-power, battery-operated devices that exhibit long sleep times interspersed with sparse active computation modes, server systems are plugged in, usually consist of a multitude of component systems, altogether consisting of a multitude of CPUs, disks, memory, board-level and system-level interconnect and routers, etc., and can sustain prolonged bursts of activity. This means that server systems are often provisioned for peak load. Bursts can occur unexpectedly (consider a news site after some major event), but keeping the entire server cluster at full power is unacceptable. Electric utility costs in a data center (including cooling costs) can be more than 50% of the total cost of ownership [F12]. This requires runtime techniques that monitor the workload and put as much hardware into low-power states as possible, while ensuring that systems can wake up quickly enough to respond to traffic bursts. In addition, for traffic with real-time requirements, such as some e-commerce services (e.g., stock trading and other forms of online bidding), power management cannot jeopardize response times. Another key distinguishing factor for devising power management strategies is that there are many components as disk farms and cluster interconnects that are never considered in embedded system design space.The chief power-saving lever in bursty server systems is the ability to put resources in a low-power mode during periods of lower activity [F12]. For the CPU, whether DVFS (which may require some system resources to stay awake) or a sleep mode is preferable depends on the overhead of switching among power states as well as the ratio of static to dynamic power and the power dissipation of non-DVFS-capable system components. Request batching —queuing up requests while leaving resources in a low-power mode, then executing a large batch of requests at peak speed in order to put resources back in a low-power mode as soon as possible —can enhance power-saving opportunities. Request batching clusters requests in time and hence is limited by response-time guarantees. A complementary approach, load concentration, is essentially the opposite of load balancing and clusters requestsin space, minimizing the number of server nodes that need to be active. To avoid performance degradation, load concentration must ensure that no machine is overloaded and that enough spare capacity is available to accommodate abrupt bursts in traffic. Both approaches are helpful not only for the CPU but also for reducing energy consumed by disk drives, memory, and system-level interconnect. Data layout in disk drives and memory can further enhance opportunities to put individual disks and memory banks to sleep. In a similar way, load concentration can be used to improve opportunities to reduce power in the system interconnect, but must be balanced against the need to distribute activity to improve the data center's cooling capability and avoid individual nodes' or racks' becoming hot spots.中文译文:功耗优化:从超低功耗到耗电系统在本节中,我们提供了一个优化的功率概述四个类型的系统目标:节能清除超低功耗系统,电池供电的嵌入式和移动系统,插在台式机和高端服务器。
英语作文-揭秘集成电路设计中的功耗管理与优化技术
英语作文-揭秘集成电路设计中的功耗管理与优化技术In the realm of integrated circuit (IC) design, power management and optimization techniques are pivotal in enhancing the performance and longevity of electronic devices. As technology advances, the demand for smaller, faster, and more efficient ICs grows, making power management a critical aspect of design.Power Consumption in IC Design。
Power consumption in IC design is primarily composed of dynamic and static power. Dynamic power is consumed when transistors switch states, while static power is the result of leakage current when transistors are in a non-switching state. With the miniaturization of transistors, leakage current has become a significant contributor to power dissipation.Dynamic Power Management。
To manage dynamic power, designers employ clock gating and power gating techniques. Clock gating disables the clock signal to portions of the circuit that are not in use, thereby reducing dynamic power. Power gating goes a step further by completely turning off the power supply to inactive blocks, eliminating both dynamic and static power consumption.Voltage and Frequency Scaling。
英语作文-如何进行集成电路设计中的功耗优化与节能设计
英语作文-如何进行集成电路设计中的功耗优化与节能设计In the field of integrated circuit (IC) design, power optimization and energy-efficient design are crucial factors to consider. With the increasing demand for energy-saving solutions, it is essential to develop techniques that can reduce power consumption without compromising performance. In this article, we will explore various approaches to achieve power optimization and energy-efficient design in ICs.One of the fundamental techniques for power optimization is the reduction of dynamic power consumption. Dynamic power is the power dissipated when transistors switch states. By minimizing the number of state transitions and reducing the load capacitance, we can effectively reduce dynamic power. This can be achieved through various methods such as gate sizing, clock gating, and power gating.Gate sizing involves adjusting the sizes of transistors in a circuit to optimize power consumption. By carefully selecting the transistor sizes, we can balance the trade-off between power and performance. Smaller transistors consume less power but may result in slower circuit operation, while larger transistors consume more power but provide better performance. Therefore, a careful analysis of the circuit's requirements is necessary to determine the optimal transistor sizes.Clock gating is another technique that can significantly reduce power consumption. In a synchronous circuit, the clock signal is responsible for triggering the state transitions. However, not all parts of the circuit need to be active simultaneously. By selectively enabling or disabling the clock signal to specific circuit blocks, we can eliminate unnecessary switching activity and reduce power consumption. This technique is particularly effective in circuits with idle or lightly loaded components.Power gating is a more advanced technique that involves selectively shutting down power to inactive circuit blocks. By completely cutting off the power supply to these blocks, we can eliminate any leakage power consumption. Leakage power is the powerdissipated even when the circuit is in a static state. Power gating can be achieved through the use of power switches that can isolate different sections of the circuit. However, careful consideration must be given to the power-up and power-down sequences to avoid any glitches or excessive power consumption during the switching process.Apart from dynamic power optimization, reducing static power consumption is also crucial for energy-efficient design. Static power is the power dissipated due to leakage currents in transistors. As technology scales down, leakage currents become a more significant portion of the total power consumption. To mitigate static power, techniques such as transistor stacking, voltage scaling, and power supply gating can be employed.Transistor stacking involves placing multiple transistors in series to increase their threshold voltage. This technique effectively reduces leakage current at the cost of increased delay and area overhead. Voltage scaling involves operating the circuit at lower supply voltages, thereby reducing both dynamic and static power consumption. However, voltage scaling may lead to performance degradation, and careful analysis of the circuit's timing constraints is necessary. Power supply gating is similar to power gating but targets the reduction of static power. By shutting off the power supply to unused circuit blocks, we can minimize leakage currents and achieve energy savings.In conclusion, power optimization and energy-efficient design are crucial aspects of IC design. Through techniques such as gate sizing, clock gating, power gating, transistor stacking, voltage scaling, and power supply gating, we can effectively reduce power consumption without compromising performance. These techniques require careful analysis and trade-off considerations to achieve the optimal balance between power and performance. By incorporating these techniques into IC design practices, we can contribute to the development of energy-efficient electronic devices.。
英语作文-揭秘集成电路设计中的功耗分析与优化方法
英语作文-揭秘集成电路设计中的功耗分析与优化方法Power analysis and optimization in integrated circuit (IC) design is a critical aspect that influences both the performance and efficiency of electronic devices. As technology advances, demands for lower power consumption in ICs have become increasingly stringent, driven by factors such as battery life in mobile devices, heat dissipation in high-performance computing, and environmental concerns. In this article, we will delve into various methods and strategies employed in the analysis and optimization of power consumption in IC design.Firstly, it's essential to understand the sources of power dissipation in ICs. The major contributors typically include dynamic power dissipation (P_dynamic), which arises from charging and discharging internal node capacitances during switching activities, and static power dissipation (P_static), caused by leakage currents in transistors even when they are not switching.To effectively analyze and optimize power consumption, designers employ several key methodologies:1. Power Estimation and Modeling:Before diving into optimization, accurate estimation of power consumption is crucial. This involves using tools and techniques to model power at various stages of the design process—from early architectural exploration to detailed circuit implementation. Power estimation tools simulate the behavior of the IC under different conditions (e.g., varying workloads or input signals) to predict power consumption accurately.2. Architectural Optimization:At the architectural level, design choices significantly impact power consumption. Techniques such as voltage and frequency scaling (DVFS), where the operating voltageand clock frequency are adjusted dynamically based on workload, are commonly used to achieve optimal power-performance trade-offs. Furthermore, employing low-power design architectures such as pipelining, parallelism, and data gating helps in reducing power consumption without compromising performance.3. Circuit-Level Optimization:Circuit-level optimizations focus on reducing both dynamic and static power dissipation. Techniques like clock gating, where parts of the circuit are selectively shut down when not in use, effectively reduce dynamic power consumption. Additionally, optimizing transistor sizing, using low-leakage transistors, and implementing efficient power gating techniques help in minimizing static power dissipation.4. Advanced Power Management Techniques:As ICs become more complex, advanced power management techniques are crucial. This includes sophisticated power gating strategies like multi-threshold CMOS (MTCMOS), where different parts of the chip can operate at different voltages or shut down independently. Furthermore, the integration of power islands allows certain blocks of the IC to operate autonomously, enabling further power savings.5. Verification and Validation:Throughout the design process, verification of power-related optimizations is essential to ensure they meet design goals. Techniques such as power-aware simulation and formal verification help in validating power reduction strategies early in the design cycle, thereby minimizing costly redesigns later.6. Post-Silicon Power Analysis:Post-silicon power analysis involves measuring actual power consumption on fabricated chips. This step validates earlier estimations and optimizations, providing feedback for future design iterations and improvements.In conclusion, the analysis and optimization of power consumption in IC design involve a comprehensive approach spanning from early architectural decisions to post-silicon validation. By employing advanced modeling, architectural optimizations, circuit-level techniques, and rigorous verification, designers can effectively meet stringent power constraints while maintaining optimal performance. This holistic approach not only enhances the efficiency and longevity of electronic devices but also contributes to sustainable and eco-friendly design practices in the semiconductor industry.。
- 1、下载文档前请自行甄别文档内容的完整性,平台不提供额外的编辑、内容补充、找答案等附加服务。
- 2、"仅部分预览"的文档,不可在线预览部分如存在完整性等问题,可反馈申请退款(可完整预览的文档不适用该条件!)。
- 3、如文档侵犯您的权益,请联系客服反馈,我们会尽快为您处理(人工客服工作时间:9:00-18:30)。
Optimization of the electrical discharge machining processbased on the Taguchi method with fuzzy logicsJ.L.Lin a,*,K.S.Wang b ,B.H.Yan b ,Y .S.Tarng caDepartment of Mechanical Engineering,National Central University,Chung-Li,Taoyuan,Taiwan,ROC b Department of Mechanical Engineering,National Central University,Chung-Li,Taoyuan,Taiwan,ROCcDepartment of Mechanical Engineering,National Taiwan University of Science and Technology,Taipei,Taiwan,ROCReceived 9October 1998AbstractIn this paper,the application of the Taguchi method with fuzzy logic for optimizing the electrical discharge machining process with multiple performance characteristics has been reported.A multi-response performance index is used to solve the electrical discharge machining process with multiple performance characteristics.The machining parameters (the workpiece polarity,pulse-on time,duty factor,open discharge voltage,discharge current and dielectric ¯uid)are optimized with considerations of the multiple performance characteristics (electrode wear ratio and material removal rate).Experimental results are presented to demonstrate the effectiveness of this approach.#2000Published by Elsevier Science S.A.All rights reserved.Keywords:Electrical discharge machining;Taguchi method;Fuzzy logics1.IntroductionThe Taguchi method can optimize performance charac-teristics through the settings of process parameters and reduce the sensitivity of the system performance to sources of variation.As a result,the Taguchi method has become a powerful tool in the design of experiment methods [1±3].However,most published Taguchi applications to date have been concerned with the optimization of a single perfor-mance characteristic.Handling the more demanding multi-ple performance characteristics is still an interesting research problem [4,5].The theory of fuzzy logics,initiated by Zadeh in 1965[6]has proven to be useful for dealing with uncertain and vague information.In fact,the de®nition of performance charac-teristics such as lower-the-better,higher-the-better,and nominal-the-better contains a certain degree of uncertainty and vagueness.Therefore,optimization of the performance characteristics with fuzzy logic has been considered in this study.In this study,a fuzzy reasoning of the multiple performance characteristics has been developed based onfuzzy logic.As a result,optimization of complicated multi-ple performance characteristics can be transformed into the optimization of a single multi-response performance index (MRPI).In this paper,the optimization of the electrical dis-charge machining process with multiple performance char-acteristics has been investigated to illustrate this approach.Electrical discharge machining (EDM)has been used effectively in the machining of hard,high-strength,and temperature-resistant materials.Material is removed by means of rapid and repetitive spark discharges across the gap between the tool and the workpiece.In electrical dis-charge machining,it is important to select machining para-meters for achieving optimal machining performance [7].Usually,the desired machining parameters are determined based on experience or handbook values.However,this does not ensure that the selected machining parameters result in optimal or near optimal machining performance for that particular electrical discharge machine and environment.To solve this task in the present study,the Taguchi method with fuzzy logic is used as an ef®cient approach to determine the optimal machining parameters in the electrical discharge machining process.In the following,optimization of multiple performance characteristics with fuzzy logic is introduced brie¯y and the electrical discharge machining process is thendescribed,Journal of Materials Processing Technology 102(2000)48±55*Corresponding author.Tel.: 886-39-771997-284;fax: 886-39-771997-283.E-mail address :linauto@.tw (J.L.Lin)0924-0136/00/$±see front matter #2000Published by Elsevier Science S.A.All rights reserved.PII:S 0924-0136(00)00438-6after which the experimental details of using the Taguchi method with fuzzy logic to optimize the electrical discharge machining process to secure low electrode wear ratio(EWR) and high material removal rate(MRR)are given.Finally,the paper concludes with a summary.2.Optimization of multiple performance characteristics with fuzzy logicExperimental design methods[8]were developed origin-ally by Fisher[9].However,classical experimental design methods are too complex and not easy to use.Furthermore,a large number of experiments have to be carried out as the number of the process parameters increases.To solve this important task,the Taguchi method uses a special design of orthogonal array to study the entire parameter space with only a small number of experiments.The experimental results are then transformed into a signal-to-noise(S/N) ratio.The S/N ratio can be used to measure the deviation of the performance characteristics from the desired values. Usually,there are three categories of performance charac-teristics in the analysis of the S/N ratio:the lower-the-better, the higher-the-better,and the nominal-the-better.Regardless of the category of the performance characteristic,a larger S/N ratio corresponds to better performance characteristic. Therefore,the optimal level of the process parameters is the level with the highest S/N ratio.Furthermore,a statistical analysis of variance(ANOV A)is performed to identify the process parameters that are statistically signi®cant.The optimal combination of the process parameters can then be predicted based on the above analysis.Finally,a con-®rmation experiment is conducted to verify the optimal process parameters obtained from the parameter design. Basically,the Taguchi method is designed to handle the optimization of a single performance characteristic.The usual recommendation for the optimization of a process with multiple performance characteristics is left to engineer-ing judgment and veri®ed by con®rmation experiments[10]. This is because several problems are encountered in the optimization of a process with multiple performance char-acteristics.For example:the category of each performance characteristic may not be same;the engineering unit for describing each performance characteristic may be differ-ent;and the importance of each performance characteristic may vary.As a result,the application of the Taguchi method in a process with multiple performance characteristics can-not be straightforward.In this paper,the use of fuzzy logic to deal with the optimization of a process with multiple performance characteristics is reported.First,several fuzzy rules are derived based on the performance requirement of the process.The loss function corresponding to each per-formance characteristic is fuzzi®ed and then a single MRPI is obtained through fuzzy reasoning on the fuzzy rules.The MRPI can be used to optimize the process based on the Taguchi approach.3.The electrical discharge machining processThe electrical discharge machining removes workpiece by an electrical spark erosion process.The variations in the machining parameters,such as the workpiece polarity, pulse-on time,duty factor,open discharge voltage,discharge current,and dielectric¯uid,greatly affect the measures of the machining performance,for example,the EWR and the MRR.Therefore,proper selection of the machining para-meters can result in better machining performance in the electrical discharge machining process.3.1.Machining parameter selectionIn this study,an EDM machine(KT-200)was used as the experimental machine.Cylindrical pure copper with a dia-meter of8mm was used for an electrode to erode a work-piece of SKD11with a diameter of8mm.The schematic diagram of the experimental set-up is shown in Fig.1.The workpiece and electrode were separated by a moving dielec-tric¯uid such as kerosene.In the experiments,an additive (aluminum powder or aluminum oxide powder)to the kerosene used as the dielectric¯uid was employed to improve the machining performance[11].Machining experiments for determining the optimal machining para-meters were carried out by setting:negative polarity or positive polarity of the workpiece;a pulse-on time in the range of20±300m s;a duty factor in the range of0.3±0.7;an open discharge voltage in the range of100±150V;a dis-charge current in the range of1.5±6.0A and three different dielectric¯uids.To perform the experimental design,three levels of the machining parameters(pulse-on time,dutyTable1Machining parameters and their levelsSymbol Machining parameter Unit Level1Level2Level3A Workpiece polarity Negative PositiveB Pulse-on time m s2*******C Duty factor0.30.50.7D Open discharge voltage V100120150E Discharge current A 1.5 4.0 6.0F Dielectric fluid Kerosene Kerosene Al2O3powder Kerosene Al powderJ.L.Lin et al./Journal of Materials Processing Technology102(2000)48±5549factor,open discharge voltage,discharge current,dielectric ¯uid)were selected and are shown in Table 1.The initial machining parameters were selected as follows:negative polarity of the workpiece;a pulse-on time of 20m s;a duty factor of 0.5;an open discharge voltage of 120V;a dis-charge current of 4.0A;and an additive of aluminum oxide powder in the kerosene used as the dielectric ¯uid.3.2.Machining performance evaluationThe machining performance is evaluated by the EWR and the MRR.The EWR is de®ned as the ratio of the electrode wear weight (EWW)to the workpiece removal weight (WRW)and is usually expressed as a percentage,i.e.EWR 7EWWWRWÂ100(1)The MRR is the WRW under a period of machining time in minutes (T ),i.e.MRR g a minWRW T(2)In the experiments,the machining time for each work-piece is 30min.Basically,the lower is the EWR in the EDM process,the better is the machining performance.However,the higher is the MRR in the EDM process,the better is the machining performance.Therefore,the EWR is the lower-the-better performance characteristic and the MRR is the higher-the-better performance characteristic.4.Determination of the optimal machining parameters In this section,the use of the Taguchi method with fuzzy logic to determine the machining parameters with optimal machining performance in the EDM process is illustrated.4.1.Orthogonal array experimentTo select an appropriate orthogonal array for the experi-ments,the total degrees of freedom need to be computed.The degrees of freedom are de®ned as the number of comparisons between process parameters that need to be made to determine which level is better and speci®cally how much better it is.For example,a two-level process parameter counts for one degree of freedom.The degrees of freedom associated with interaction between two process parameters are given by the product of the degrees of freedom for the two process parameters.In the present study,the interaction between the machining parameters is neglected.Therefore,there are 11degrees of freedom owing to one two-level machining parameter and ®ve three-level machining para-meters in the EDM process.Once the degrees of freedom are known,the next step is select an appropriate orthogonal array to ®t the speci®c task.The degrees of freedom for the orthogonal array should be greater than or at least equal to those for the process parameters.In this study,an L 18orthogonal array was used because it has 17degrees of freedom more than the 11degrees of freedom in the machining parameters.This array has 8columns and 18rows and it can handle one two-level process parameter and seven three-level process parameters,at most.Each machining parameter is assigned to a column and 18machining parameter combinations are required.Therefore,only 18experiments are needed to study the entire machining parameter space using the L 18orthogonal array.The experimental combinations of the machining parameters using the L 18orthogonal array is presented in Table 2.4.2.Signal-to-noise ratioIn the Taguchi method,a loss function is de®ned to calculate the deviation between the experimentalvalueFig.1.Schematic diagram of the EDM process.50J.L.Lin et al./Journal of Materials Processing Technology 102(2000)48±55and the desired ually,there are three categories of the performance characteristics in the analysis of the signal-to-noise ratio,i.e.,the lower-the-better,the higher-the-bet-ter,and the nominal-the-better.To obtain optimal machining performance,the minimum EWR and the maximum MRR are desired.Therefore,the lower-the-better EWR and the higher-the-better MRR should be selected.The loss function L ij of the lower-the-better performance characteristic can be expressed asL ij 1nnk 1y2ijk(3)where L ij is the loss function of the i th performance char-acteristic in the j th experiment,n the number of tests,and y ijk is the experimental value of the i th performance character-istic in the j th experiment at the k th test.The loss function of the higher-the-better performance characteristic can be expressed asL ij 1nnk 11y2ijk(4)The loss function is further transformed into an S/N ratio. In the Taguchi method,the S/N ratio is used to determine the deviation of the performance characteristic from the desired value.The S/N ratio Z ij for the i th performance characteristic in the j th experiment can be expressed asZ ij À10log L ij (5) Table3shows the experimental results for the EWR and its S/N ratio based on the experimental parameter combina-tions(Table2).The experimental results for the MRR and its S/N ratio are shown in Table4.As shown in Tables3and4, the engineering units for describing the EWR and the MRR are different.To consider the two different performance characteristics in the Taguchi method,the S/N ratios corre-sponding to the EWR and MRR are processed by the fuzzy logic unit.4.3.Fuzzy logic unitA fuzzy logic unit comprises a fuzzi®er,membership functions,a fuzzy rule base,an inference engine,and a defuzzi®er.First,the fuzzi®er uses membership functions to fuzzify the S/N ratios.Next,the inference engine performs a fuzzy reasoning on fuzzy rules to generate a fuzzy value. Finally,the defuzzi®er converts the fuzzy value into a MRPI.Table2Experimental layout using an L18orthogonal arrayNo.Machining parameterWorkpiece polarity(A)Pulse-on time(B)Duty factor(C)Discharge voltage(D)Discharge current(E)Dielectric fluid(F)21122223113333412112251222336123311713121381323219133132102113321121211312213221132212311422231215223123162313231723213118233212Table3Experimental results for the EWR and its S/N ratioNo.EWR(%)S/N ratio(dB)133.69.510229.910.486347.1 6.3564 6.7023.380511.818.566643.97.151741.07.6828 4.9126.01390.7043.3831022.812.6651132.19.8641229.210.6881315.516.0831467.2 3.4491529.210.5501638.38.3271724.111.93518121.2À1.681J.L.Lin et al./Journal of Materials Processing Technology102(2000)48±5551In the following,the concept of fuzzy reasoning is described brie¯y based on the two-input±one-output fuzzy logic unit.The fuzzy rule base consists of a group of if±then control rules with the two inputs,x 1and x 2,and one output y ,i.e. Rule 1:if x 1is A 1and x 2is B 1then y is C 1else Rule 2:if x 1is A 2and x 2is B 2then y is C 2else ÁÁÁÁÁÁÁÁÁÁÁÁÁÁÁÁÁÁÁÁÁÁÁÁÁÁÁÁÁÁÁÁÁÁÁÁÁÁÁÁÁÁÁÁÁÁÁÁÁÁÁÁÁÁÁÁÁÁÁÁRule n :if x 1is A n and x 2is B n then y is C n .A i ,B i ,andC i are fuzzy subsets de®ned by the correspond-ing membership functions,i.e.,m A i ,m B i and m C i .In this paper,three fuzzy subsets are assigned in the two inputs (Figs.2and 3).Seven fuzzy subsets are assigned in the output (Fig.4).Various degree of membership to the fuzzy sets is calculated based on the values of x 1,x 2,and y .Nine fuzzyrules (Table 5)are derived directly based on the fact that larger is the S /N ratio,the better is the performance char-acteristic.By taking the max±min compositional operation [12],the fuzzy reasoning of these rules yields a fuzzy output.Supposing that x 1and x 2are the two input values of the fuzzy logic unit,the membership function of the output of fuzzy reasoning can be expressed asm C 0 y m A 1 x 1 m B 1 x 2 m C 1 y XX m A n x 1m B n x 2 m C n y(6)where is the minimum operation and is the maximum operation.Finally,a defuzzi®cation method,called the center-of-gravity method [12],is adopted here to transform the fuzzy inference output m C 0into a non-fuzzy value y 0,i.e.y 0y m C 0ym C 0 y (7)In this paper,the non-fuzzy value y 0is called an MRPI.Based on the above discussion,the larger is the MRPI,theTable 4Experimental results for the MRR and its S /N ratio No.MRR (g/min)S /N ratio (dB)10.00182À25.260620.00159À26.485130.00089À31.521240.00464À17.172050.00096À31.012460.00128À28.344970.00024À43.069780.00303À20.829890.00330À20.0926100.00024À43.0255110.00021À44.2724120.00026À42.2474130.00026À42.6933140.00029À41.1814150.00033À40.6065160.00053À36.3971170.00035À40.4645180.00031À40.6430Fig.2.Membership functions for theEWR.Fig.3.Membership functions for the MRR.52J.L.Lin et al./Journal of Materials Processing Technology 102(2000)48±55better is the performance characteristic.Table 6shows the experimental results for the MRPI using the experimental combinations of Table 2.Since the experimental design is orthogonal,it is then possible to separate out the effect of each machining para-meter at different levels.For example,the mean of the MRPI for the workpiece polarity at levels 1and 2can be calculated by averaging the multi-response performance indexes for experiments 1±9and 10±18,respectively (Table 2).The mean of the MRPI for each level of the other machining parameters can be computed in a similar manner.The mean of the MRPI for each level of the machining parameters is summarized and called the MRPI table (Table 7).In addi-tion,the total mean of the MRPI for the eight experiments is also calculated and listed in Table 7.Fig.5shows the MRPI graph,where the dashed line indicated in this ®gure is the value of the total mean of the MRPI.Basically,the larger is the MRPI,the smaller is the variance of the performance characteristics around the desired value.However,the rela-tive importance amongst the machining parameters for the multiple performance characteristics still needs to be known so that the optimal combinations of the machining parameter levels can be determined more accurately.4.4.Analysis of varianceThe purpose of the ANOV A is to investigate which process parameters signi®cantly affect the performance characteristics.This is accomplished by separating the totalvariability of the multi-response performance indexes,which is measured by the sum of the squared deviations from the total mean of the MRPI,into contributions by each of the process parameter and the error.First,the total sum of the squared deviations SS T from the total mean of the MRPI Z m can be calculated as SS Tp j 1Z j ÀZ m 2(8)where p is the number of experiments in the orthogonal arrayand Z is the mean of the MRPI for the j th experiment.The total sum of the squared deviations SS T is decom-posed into two sources:the sum of the squared deviations SS d due to each process parameter and the sum of the squared error SS e .The percentage contribution by each of the process parameter in the total sum of the squared deviations SS T can be used to evaluate the importanceofFig.4.Membership functions for the MRPI.Table 5Fuzzy rule table MRPIS /N for EWR SmallMiddle Large S/N for MRRSmall Very small Small Middle Middle Small Middle Large LargeMiddleLargeVery largeTable 6Results for the MRPI No.MRPI 10.48220.46830.33940.75050.77060.39070.21880.71390.863100.250110.325120.275130.271140.241150.301160.338170.309180.168J.L.Lin et al./Journal of Materials Processing Technology 102(2000)48±5553the process-parameter change on the performance charac-teristics.In addition,the F -test named after Fisher [9]can also be used to determine which process parameters have a signi®cant effect on the performance ually,the change of the process parameter has a signi®cant effect on the performance characteristic when the F value is large.The results of ANOV A (Table 8)indicate that workpiece polarity,discharge current,and open discharge voltage are the signi®cant machining parameters in affecting the multi-ple performance characteristics,with the workpiece polarity being the most signi®cant.Based on the above discussion,the optimal machining parameters are the workpiece polar-ity at level 1,pulse-on time at level 3,duty factor at level 2,open discharge voltage at level 1,discharge current at level 2and dielectric ¯uid at level 2.4.5.Con®rmation testsOnce the optimal level of the process parameters has been selected,the ®nal step is to predict and verify the improve-ment of the performance characteristic using the optimal level of the process parameters.The estimated S /N ratio Z using the optimal level of the process parameters can be calculated asZ Z mq i 1Z i ÀZ m (9)where Z m is the total mean of the MRPI,Z i the mean of the MRPI at the optimal level,and q is the number of the process parameters that signi®cantly affect the multiple performance characteristics.Table 7MRPI table Symbol Machining parameter MRPI Level 1Level 2Level 3Max±min B Pulse-on time 0.3360.4080.4180.082C Duty factor0.3840.3900.3870.006D Open discharge voltage 0.4730.3140.3750.159E Discharge current 0.2860.4690.4080.183FDielectric fluid0.3880.4570.3180.139Mean value of MRPI 0.396dBFig.5.MRPI graph.54J.L.Lin et al./Journal of Materials Processing Technology 102(2000)48±55Based on Eq.(9),the estimated MRPI using the optimal machining parameters can then be obtained.Table9shows the results of the con®rmation experiment using the optimal machining parameters.As shown in Table9,the EWR is decreased from29.9to2.07%and the MRR is increased from0.00159to0.00383g/min.The comparison of the S/N ratios between the initial machining parameters and the optimal machining parameters is also shown in Table10. It is shown clearly that the EWR and the MRR are greatly improved through this study.5.ConclusionsThe paper has presented the use of fuzzy logics to the Taguchi method for the optimization of the electrical dis-charge machining process with multiple performance char-acteristics.A fuzzy reasoning of the multiple performance characteristics has been performed by the fuzzy logic unit. As a result,the performance characteristics such as EWR and MRR can be improved through this approach.An experiment was conducted to con®rm this approach.As a result,the optimization methodology developed in this study is useful in improving multiple performance characteristics in the electrical discharge machining operation.References[1]P.J.Ross,Taguchi Techniques for Quality Engineering,McGraw-Hill,New York,1988.[2]A.Bendell,J.Disney,W.A.Pridmore,Taguchi Methods:Applica-tions in World Industry,IFS Publications,Bedford,UK,1989. [3]G.Taguchi,Introduction to Quality Engineering,Asian ProductivityOrganization,Tokyo,1990.[4]E.A.Elsayed,A.Chen,Optimal levels of process parameters forproducts with multiple characteristics,Int.J.Prod.Res.31(5)(1993) 1117±1132.[5]Y.S.Tarng,W.H.Yang,Application of the Taguchi method to theoptimization of the submerged arc welding process,Mater.Manuf.Process.13(3)(1998)455±467.[6]L.Zadeh,Fuzzy sets,Inform.and Control8(1965)338±353.[7]J.A.McGeough,Advanced Methods of Machining,Chapman&Hall,New York,1988.[8]D.C.Montgomery,Design and Analysis of Experiments,Wiley,Singapore,1991.[9]R.A.Fisher,Statistical Methods for Research Worker,Oliver&Boyd,London,1925.[10]M.S.Phadke,Quality Engineering Using Robust Design,Prentice-Hall,Englewood Cliffs,NJ,1989.[11]Q.Y.Ming,L.Y.He,Power suspension dielectric¯uid for EDM,J.Mater.Process.Technol.52(1995)44±54.[12]H.J.Zimmermann,Fuzzy Set Theory and its Applications,KluwerAcademic Publishers,London,1985.Table8Results of the ANOV ASymbol Machining parameter Degrees of freedom Sum of squares Mean square F Contribution(%)A Workpiece polarity10.3280.32819.2247.23B Pulse-on time20.0240.0120.71 3.48C Duty factor20.00010.000050.0030.01D Open discharge voltage20.0770.039 2.2511.08E Discharge current20.1050.063 3.0715.11F Dielectric fluid20.0580.029 1.708.34Error60.1020.01714.74Total170.693100Table9Results of the con®rmation experimentInitial machining parameters Optimal machining parametersPrediction Experiment Setting level A1B1C2D2E2F2A1B3C2D1E2F2A1B3C2D1E2F2 ERR(%)29.9 2.07MRR(g/min)0.001590.00383S/N ratio0.4680.7330.781Improvement MRPI 0.313Table10S/N ratio for the initial machining parameters and the optimal machiningparametersEWR MRRInitial machining parameters(A1B3C2D3E2F1)10.486À26.485Optimal machining parameters(A1B3C2D1E2F2)33.447À18.786Improvement S/N ratio(dB)22.9617.699J.L.Lin et al./Journal of Materials Processing Technology102(2000)48±5555。