chap05 Control Charts for Variables
Chapter 27 - SPC Attribute Control Charts(t)
J. APPLICATION EXERCISES 应用训练
DEFINE MEASURE
L
ANALYZE
IMPROVE
27-2
CHAPTER OBJECTIVES 本章目标
• Understand the use of attribute control charts. 熟练掌握属性控制图的运用
27-4
INTRODUCTION 前言
• These charts are an aid for decision making. With control limits, they can help us filter out the probable noise by adequately reflecting the voice of the process. 这些图有助于决定的制定。连同控制限,通过恰当反映过程之声,它们 可帮助我们过滤或然噪音。
• Learn how to enter data into Minitab in order to create an attribute control chart. 学会如何输入数据至 Minitab,产生属性控制图。
• Learn how to create and interpret a P, NP, C and U Chart. 学会如何创造及解说 P, NP, C 及 U 图
• Also, as with variable control charts, a process statistic, such as the number of defects, is plotted rather than sample number or time. 此外,变量控制图绘制的过程统计是缺陷数而不是样品数或时间。
MSA测量系统分析培训教程
Measure Reading Bias
1
5.8
-0.2
2
5.7
-0.3
3
5.9
-0.1
4
5.9
-0.1
5
6.0
0.0
6
6.1
0.1
7
6.0
0.0
8
6.1
0.1
9
6.4
0.4
10
6.3
0.3
11
6.0
0.0
12
6.1
0.1
13
6.2
0.2
14
5.6
-0.4
15
6.0
0.0
WONGKJ : MSA TRAINING, APR05
0.024 0.018 0.012 0.006 0.000
Xbar-R Chart of Density
5
10
15
20
25
30
35
40
Sample
5
10
15
20
25
30
35
40
Sample
U C L=2.50949
__ X=2.5
LC L=2.49051 45
U C L=0.02387
_ R=0.00927
0.0
-0.1
-0.2
-0.3
-0.4
-0.5 0 2 4 6 8 10 12 14 16 Measure
Regression Analysis: Bias versus Measure
The regression equation is Bias = - 0.1048 + 0.01393 Measure
变量数据统计过程控制SPC

Voice Of Process (VOP) 过程的一致性并且是可预测的,反映过程之声 • NOT a guarantee of good results or of meeting the
• Excessive false alarms will degrade users’ confidence in their function (don’t cry wolf too much!) /过度假警报会降低使用者的信心
• Use rules such that signals of economic importance are not missed
• Using the same material or material lots 使用同一材料或同一批的材料
Inappropriate sub-grouping may generate too many false alarms or miss an out of control situation.
答案在于错误警告率
纳尔逊(Nelson)
• 任何超出控制限的点 • 连续9点在中心线同侧 • 连续6点递增或递减 • 连续3点中的2点落在中心线同侧的B区以外 • 连续5点中的4点落在中心线同侧的C区以外 • 连续14个点上下交替 • 连续15个点落在中心线两侧的C区 • 连续8点落在中心线两侧且无一点落在C区
• Sample Frequency 取样频次 • Not too many (costly) 不要太多(代价上) • Not too few (unreliable information) 不要太少 (不可靠信息) • More frequent, the better 频次越高越好 • On-line Measurement Systems offer real-time Process Control 在线 测量反映实施时过程控制
英文商务统计学ppt课件第十四章_Ch14
Business Statistics: A First Course, 5e © 2009 Prentice-Hall, Inc.
Chap 14-8
Special Cause Variation
Business Statistics: A First Course
Fifth Edition
Chapter 14 Statistical Applications in Quality Management
Business Statistics: A First Course, 5e © 2009 Prentice-Hall, Inc. Chap 14-1
Common Cause Variation
Total Process Common Cause Special Cause = + Variation Variation Variation
Common cause variation
naturally occurring and expected the result of normal variation in materials, tools, machines, operators, and the environment
p chart R chart X chart
Business Statistics: A First Course, 5e © 2009 Prentice-Hall, Inc.
Chap 14-3
Theory of Control Charts
A process is the value added transformation of inputs to outputs Control Charts are used to monitor variation in a measured value from a process Inherent variation refers to process variation that exists naturally. This variation can be reduced but not eliminated
introductiontostatisticalqualitycontrol,5thedition:统计质量控制介绍,第五版

Chapter 7
7
• How
The P Chart
– By counting the number of defective items from a sample and then plotting the percent that are defective.
• Conditions
– In order to be of help, there should be some rejects in each observed sample.
Chapter 7
10
The P Chart
• To calculate Plot Points
– In a sheet metal assembly shop a common process is bucking rivets. Because of the combined variation in the rivets, the drilled holes, and the bucking process, there are quality problems. After the rivets in an assembly have been bucked into place they are checked for nonconformity. A P chart is used to track the first-time-through fraction defective.
• Used to evaluate fraction defective • Control limits are based on Binomial
Distribution
Chapter 7
控制图基本知识
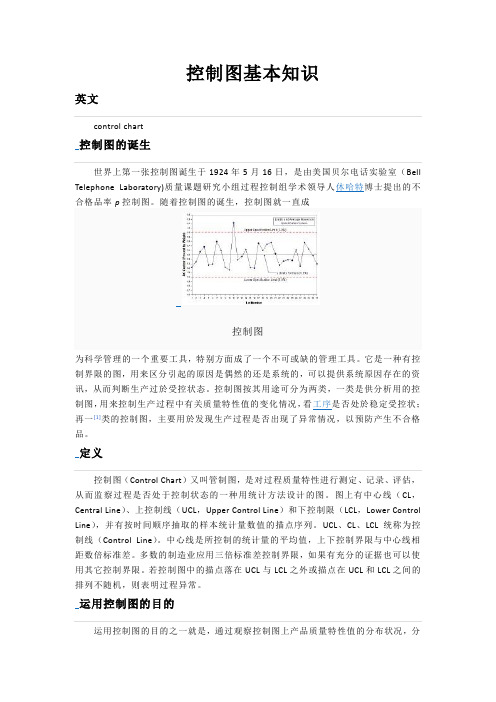
控制图基本知识英文control chart控制图的诞生世界上第一张控制图诞生于1924年5月16日,是由美国贝尔电话实验室(Bell Telephone Laboratory)质量课题研究小组过程控制组学术领导人休哈特博士提出的不合格品率p控制图。
随着控制图的诞生,控制图就一直成控制图为科学管理的一个重要工具,特别方面成了一个不可或缺的管理工具。
它是一种有控制界限的图,用来区分引起的原因是偶然的还是系统的,可以提供系统原因存在的资讯,从而判断生产过於受控状态。
控制图按其用途可分为两类,一类是供分析用的控制图,用来控制生产过程中有关质量特性值的变化情况,看工序是否处於稳定受控状;再一[1]类的控制图,主要用於发现生产过程是否出现了异常情况,以预防产生不合格品。
定义控制图(Control Chart)又叫管制图,是对过程质量特性进行测定、记录、评估,从而监察过程是否处于控制状态的一种用统计方法设计的图。
图上有中心线(CL,Central Line)、上控制线(UCL,Upper Control Line)和下控制限(LCL,Lower Control Line),并有按时间顺序抽取的样本统计量数值的描点序列。
UCL、CL、LCL统称为控制线(Control Line)。
中心线是所控制的统计量的平均值,上下控制界限与中心线相距数倍标准差。
多数的制造业应用三倍标准差控制界限,如果有充分的证据也可以使用其它控制界限。
若控制图中的描点落在UCL与LCL之外或描点在UCL和LCL之间的排列不随机,则表明过程异常。
运用控制图的目的运用控制图的目的之一就是,通过观察控制图上产品质量特性值的分布状况,分析和判断生产过程是否发生了异常,一旦发现异常就要及时采取必要的措施加以消除,使生产过程恢复稳定状态。
也可以应用控制图来使生产过程达到统计控制的状态。
产品质量特性值的分布是一种统计分布.因此,绘制控制图需要应用概率论的相关理论和知识。
05过程方法和过程控制教案(第5章,计数控制图)
引 言
计数控制图代表的是质量意识的第二个 阶段,即组织在零缺陷值的驱动下转向 对缺陷的预防。 在这个阶段,统计过程控制最初应用的 是计数控制图,然而,这个图所表达的 产出没有满足既定规格,但并不能回答 为什么没有满足这个问题。 完全(100%)满足既定规格并不能提供一 个进行永无止境过程改进的固定途径。
6.2.1 使用的条件
⑵假设每一个单位是否具有显著特征是 固定的。 ⑶在给定的机会域中,一个既定具有显 著特征的单位是独立的,它与其他单位 是否具有显著特征没有关系。 如果数据满足这砦条件,我们就可以使 用p控制图或np控制图,但是我们必须谨 慎以免不正确地使用这些控制图。
6.2.2 何时不能使用 P控制图和np控制图
我们必须谨慎地保证控制图只是用做一 个单一过程。 由多个复合过程而来的控制图会导致无 理性的子组或者我们无法从中得到过程 中问题的子组。 这样的图形简直得不到任何信息,控制 图反映出来的效应可能是带来变异的其 他特殊原因的伪装。
6.2.3 建立计件值控制图
建立与理解P控制图和np控制图会应用在 第3章讨论过的戴明循环。 利用PDCA循环。有人使用控制图既不按 步骤实施、也不能够掌握和解释控制图 所反映的物理意义,这样使用控制图作 用不大。
引 言
计数数据是基于计数或者我们在观察特 殊事件时由事件发生的次数而产生的数 据,这些事件可能是不合格品数、不合 格品率、缺陷数或者任何被定义的清晰 发生的事件。 计数数据也包括诸如不合格品或合格品、 舍弃或不舍弃、接受或不接受和单位缺 陷数这样的分类。
引 言
在第5章,我们认识到质量意识的第一个阶段 涉及对不合格品和合格品的分类:将合格品发 货,不合格品返修,降低不合格品的数目。 在第一个阶段,主要的努力集中在缺陷检测上, 通过排除不合格品达到检查质量的目的。这一 阶段的特征是依靠大量的检查而不是通过统计 过程控制来达到质量控制。 到今天,很多企业还坚持这种质量控制的信念。
概率统计英文韩文术语
Acceptable quality level AQL 合格质量水平합격품질수준Acceptance testing procedure ATP 验收检验规程Accuracy 정확성准确度Affinity diagram 친화도亲和图Alpha risk 제1종오류(생산자위험) 第一类错误Alternative hypothesis: H1 대립가설备择假设Analysis of covariance 공분산분석协方差分析Analysis of variance 분산분석方差分析Average 평균平均Bais 편의偏倚Benched at extremes 양쪽특이형两侧特异型Benchmarking 벤치마킹水平对比Best practice 베스트프랙티스BPC(最优方法)Beta risk (b) 제2종오류(소비자위험) 第二类错误bimodal 쌍봉형[히스토그램] 双峰型[直方图]Binomial distribution 이항분포二项分布Black belt - BB 블랙벨트黑带Blocking 블럭화划分区组Box plot 상자그림箱线图Box-Cox transformation Box-Cox 변환Box-Cox 转换Brain storming 브레인스토밍头脑风暴法Business Alignment Plan 목표제품선정계획目标制品选定计划Cause & Effect diagram 특성요인도因果图CDAM (Combine-Delete-Add-Modify) 해결안평가방법解决案评价方法Central limit theorem 중심극한정리中心极限定理Central line 중심선中心线Champion 챔피온倡导者Chi-square distribution 카이스퀘어분포χ方分布Chi-square test 카이스퀘어검정χ方检验Cluster sampling 집락표본추출分群取样法Common cause 불가피요인偶然原因Complete randomized design 완전랜덤실험법完全随机化设计Confidence coefficient (1-α)신뢰수준置信水平Confidence interval 신뢰구간置信区间Confounding 교락混杂Continuous data 연속데이터连续型数据Control assessment matrix 통제평가매트릭스控制评价矩阵Control chart 관리도控制图Control limits 관리한계控制界限COPQ (Cost Of Poor Quality) 품질실패비용劣质成本Core process 핵심공정核心工程Correlation coefficient 상관계수相关系数Cp (Potential process capability Index) 공정능력지수过程能力指数Cpk (Process capability index) 공정능력지수过程能力指数(考虑偏倚)Critical Business Requirement - CBR 사업핵심요구사항企业核心要求事项Critical Customer Requirement - CCR 고객핵심요구사항顾客核心要求事项Critical T o Process CTP 关键过程特性Critical T o Quality CTQ 关键质量特性Critical value 임계치临界值Cross-functional team CFT CFT Customer 고객顾客Customer value added activity 고객가치부가顾客价值增值Defect 결함缺陷Defect Per Million Opportunity DPMO 百万机会缺陷数Degree of freedom 자유도自由度dependent variable 종속변수因变量Design of Experiment 실험계획법试验设计DFM (Design For Manufacturability) 面向制造的设计DFSS (Design For Six Sigma) DFSS 6Sigma设计Discrete data 이산데이터离散型数据DPU (Defect Per Unit) 단위당결점수单位缺陷数EMEA (Error Mode and Effect Analysis)Enabling process 지원공정支援过程explanatory variable 설명변수解释变量Factor 인자因子Factor level 인자수준因子水平F-distribution F- 분포F- 分布Final yield(YF)First pass yield (YFp)flat 평편형平顶型FMEA (Failure Mode & Effect Analysis) 고장모드및효과분석潜在失效模式及影响分析Force field analysis Force field 분석Fractional factorial design 부분배치법部分实施因子设计法F-test F-검정F-检验Full factorial design 완전배치법全因子试验法Functional deployment mapping 기능전개매핑功能展开图F-value F-값F值Gauge % R&R 게이지R&RGreen belt - GB 그린벨트绿带Hidden factory 숨은공장隐蔽的工厂Histogram 히스토그램直方图Hypothesis testing 가설검정假设检验independent variable 독립변수自变量Input indicator Input 척도Input 尺度Interaction 교호작용交互作用Interval estimate 구간추정区间估计Kano analysis 카노분석卡诺分析key performance index KPI 关键性能指标Lack of fit 적합결여失拟Level of confidence 신뢰수준置信水平Linearity 선형성线性Long term process sigma 47 장기공정시그마长期过程Sigma值Lower control limit 관리하한控制下限Main effect 주효과主效应ManufacturabilityMaster black belt - MBB 마스터블랙벨트黑带大师Mean 평균平均Median 중앙값中值Mode 최빈값众数Mean square of error MSE 均方误Mind mapping 심리매핑脑图Multiple regression 다중회귀법多元回归分析Multi-stage sampling 다단계표본추출多阶段取样法Multi-vary analysis Multi-vary 분석Multi-voting 다중투표多重投票Nested design 嵌套设计Non-normal distribution 비정규분포非正态分布Non-random pattern 이상패턴异常趋势Non-value added activity 비가치부가非增值活动Normal distribution 정규분포正态分布Normality test 정규성검정正态性检验Normalized yield (YNorm)NP chart NP 차트NP图(不良数图)Null hypothesis: H0 귀무가설原假设Operational definition 측정운용정의Operational value added activity 운영가치부가Opportunity for Error 불량기회缺陷机会Outlier 이상점异常点Output indicator Output 척도Output 尺度Pareto analysis 파레토분석帕累托分析Pilotpoint estimate 점추정点估计Poisson distribution 포아송분포泊松分布poka-yoke 포카요케防差错措施Pooled standard deviation Pooled 표준편차Pooled 标准偏差Population 모집단总体Precision 정밀도精密度Prediction equation 예측방정식预测方程式probability density function,PDF 확율밀도함수概率密度函数probability sampling 확율표본추출随机样本抽取法Problem statement 문제기술서问题描述书Process capability index 공정능력지수过程能力指数Process control system 공정관리시스템过程控制系统Process indicator Process 척도Process 尺度Process mapping 프로세스매핑过程映射Process sigma 공정시그마过程sigmaProduct sigma 제품시그마产品sigmaP-value P-값P-值Qualitative process analysis 정성공정분석定性过程分析Quality function Deployment - QFD 품질기능전개质量功能展开Quick winRandom sampling 무작위샘플링随机抽样Random word 무작위단어随机词Randomized block design 랜덤블럭화설계随机区组设计Regression analysis 회귀분석回归分析Repeatability 반복성重复性Replication 반복重复Replication & standardization 전파와표준화传播和标准化Reproducibility 재현성再现性Residual 잔차残差Response surface analysis 반응표면법响应曲面法Response variable 반응변수响应变量Risk assessment matrix 위험평가매트릭스风险评价矩阵Rolled throughput yield - YRT 누적직행수율流通合格率RPN (Risk Priority Number) 风险系数R-square 결정계수决定系数Run chart 런차트运行图Scatter diagram 산점도散点图Screening experiment Screening 실험筛选实验Sensitivity analysis 민감도분석灵敏度分析Short term process sigma 단기공정시그마短期过程sigmaShow stopper 장애물障碍物Sigma calculation table 시그마계산표sigma计算表Significance level 유의수준显著性水平Six thinking hat 여섯가지사고를위한모자六顶思考帽Skewed 경사형倾斜型Solution mapping 문제해결매핑问题解决图Special cause 가피요인特殊原因Standard deviation 표준편차标准偏差Standard normal distribution 표준정규분포标准正态分布Statistical process control 통계적공정관리统计过程控制Stratification 층별화分层Stratified sampling 층별또는층화표본추출分层取样Stretch goal 스트레치목표Systematic sampling 계통표본추출系统取样法t-distribution t-분포t-分布T eam charter 팀헌장T eam 任务书Tips for innovation problem solving TRIZ 创造性问题解决理论T op down chart T op down 차트T op down 图T op down goal setting T op down 형목표설정tolerance 공차容差total productive maintenance TPM 全面生产维护total quality control TQC 全面质量控制total quality management TQM 全面质量管理Transactional Six Sigmat-T est t-검정t-检验t-value t-값t-值Type I error 제1 종과오第一类错误Type II error 제2 종과오第二类错误value analysis 가정에대한도전对假设的挑战value analysis 가치분석价值分析Variance 분산方差Variation 변동变动Voice Of Business - VOB 사업의소리企业声音Voice Of Customer - VOC 고객의소리顾客声音X-bar and R control chart X -R 차트均值-极差控制图X-bar and S control chart X -S 차트均值-标准差控制图z-value z-값z-值。
Chapter05 高级数据管理3(假设检验)
1.2.3 计算 p-values
• • • • quantile(rt(100000,54),c(0.025,0.975)) quantile(.) 计算分位点 rt(.) 计算了t 分布生成的100 000个随机数 c(0.025,0.975)表示计算这些随机数的 0.025quantile and • 输出结果为: • 2.5% 97.5% • -2.020038 2.014382
2 均值的检验
• • • • 2.1 单样本检验 2.1.1 z-test Description: 检验总体均值������ 是否等于������0. Assumptions: 数据取自于正态总体,标准 差 ������ 已知。.
• Annotations: • 检验统计量 Z服从标准正态分布 。 • z������ 为标准正态分布的分位点(������-quantile) 。 • 在样本容量足够大时,正态性假设可以放 宽,通常要求 n ≥ 25或30 • Remarks: • 单样本是z-test,没有 R的简单函数进行直 接计算
2.2.5 Paired t-test
• Description: 检验两总体均值之差 ������d = ������1 − ������2 differs from a value d0 ,数据是配对收集 的. • Assumptions:
Annotations:
3 方差 检验
Remarks: • There is no basic R function to calculate this ������2-test directly.
• • • • • • • • • # Calculate sample mean and standard deviation xbar<-mean(blood_pressure$mmhg) sigma<-sd(blood_pressure$mmhg) # Set mean value under the null hypothesis mu0<-140 # Calculate test statistic t<-sqrt(55)*(xbar-mu0)/sigma # Output results t
第三章 控制图
19
3.2 过程波动
3.2 过程波动
3.2 过程波动
过程控制的三种显示型态 过程控制的三种显示型态
(a) 正常型 Frequency LSL=Lower specification limit USL =Upper specification limit (b)共同原因变异 )
(c).特殊原因变异 特殊原因变异
α/2 =0.135
以 X 控制图控制过程前,需决定抽样时间(h)与样本大小(n) 。 故每隔h时间随机抽取n个样本,再将样本统计量 X 描绘控制 图上,即假设检验过程均值是否为 X ,若点出界则表示拒绝H0, 显示过程平均值发生偏差。 H0: µ= X H1: µ ≠ X
3
3.1 统计过程控制
SPC的特点: ——全系统,全过程,全员参加,人人有责。
——强调用科学方法(统计技术,控制图理论) 来保证全过程的预防。 ——不仅用于生产过程,而且可用于服务过程和 一切管理过程。
4
3.1 统计过程控制
SPC发展的三个阶段
SPC——科学地区分生产过程中产品质量的偶然波动和异 常波动,从而对过程的异常及时报警,以便采取措施, 消除异常,恢复过程的稳定。 SPD——统计过程诊断,张公绪提出的选控控制图和两种 质量诊断理论,开辟了统计质量诊断的新方向。 SPA——统计过程调整,过程诊断后要加以措施进行调整 三者之间的关系: 循环不已 不断改进 与时俱进 SPC SPD SPA
Drop to Drop Variation + Wind 油滴之间的变化加上风的作用 Drop to Drop Variation + Wind + the Variation of Steering 油滴之间的变化加上风的作用,以及 方向盘控制的变化 11