Nonlinearity 11 (1998) 1209--1232. Printed in the UK PII S0951-7715(98)90120-7 Beyond the p
Volume 3 Number 1 March, 2008
Journal of Educational Policy Analysis and Strategic Research2008 Subscription Rates•$35 Association Member USA (Canada: $40; Rest of World: $50)•$45 Individual USA (Canada: $50; Rest of World: $55)•$35 Student USA (Canada: $40; Rest of World: $50)•$140 Library/Institution USA (Canada: $160; Rest of World: $160)Single Issues and Back Issues: $25 USA (Canada: $35; Rest of World: $35)If you wish to subscribe for the printed edition of EPASAD, please send the subscription fee as check or money order (payable to International Association of Educators) to the following address:International Association of Educators1965 S. Orchard Street #DUrbana, IL 61801 USAPrint copies of past issues are also available for purchased by contacting the Customer Service department subscription@Journal of Educational Policy Analysis and Strategic Research Editor:Haluk Soran Hacettepe ÜniversitesiManaging EditorsMustafa Yunus Eryaman Mustafa KoçNihat Gürel Kahveci University of Illinois at Urbana-Champaign University of Illinois at Urbana-Champaign University of Illinois at Urbana-ChampaignEditorial Review BoardPetek AskarEsin AtavHakan DedeogluAyşe Ottekin Demirbolat Ihsan Seyit Ertem Nezahat GüçlüLeman TarhanCeren TekkayaErdal Toprakcı Mustafa UlusoyRauf YıldızMelek YamanAyhan Yılmaz Hacettepe ÜniversitesiHacettepe ÜniversitesiUniversity of FloridaGazi UniversitesiUniversity of FloridaGazi UniversitesiDokuz Eylül ÜniversitesiOrta Doğu Teknik Üniversitesi Cumhuriyet ÜniversitesiUniversity of Illinois at Urbana-Champaign Yüzüncü Yıl ÜniversitesiHacettepe ÜniversitesiHacettepe ÜniversitesiThe views expressed in this publication are not necessarily those of the Editor or the Editorial Review Board, nor the officers of the International Association of Educators (INASED).Copyright, 2008, International Association of Educators (INASED).TABLE OF CONTENTSVolume 3, Number 1:March 2008,From the Editor5Editorial StatementEryaman, Mustafa Y. & Y ang ChangyongArticles10“位育”之道——全球化中的华人教育路向The Way of “Wei Yu” — An Orientation of Education for the Chinese in the Globalizing World, by ZHANG Shiya16 学校转型中的领导发展与管理变革——参与“新基础教育”基地学校建设过 程的观察与体悟The Development of Leadership and Transformation of Management in School Transition — Observation and Apperception in the Construction of “New Basic Education”, by YANG Xiaowei36 中国新一轮普通高中新课程的新结构The New Structure of the New Curricula in New Round Ordinary High Schools in China, by LIAO Boqin43中国教育社会学:困境、问题与发展取舍China’s Sociology of Education: Issues and Problems, by MA Hemin and HE FangBook Review56 评《西南民族文化与教育研究丛书》A Review on the Series of the Culture and Education Study of the EthnicMinorities in Southwest China, by NI ShengliEditorial StatementWe are pleased to present this special issue on the contemporary trends and issues of progressive education in China. China is a country not only with massive education, but also with a rich educational history dating back more than three thousand years. With this special issue, the Journal of Educational Policy Analysis and Strategic Research has paid attention to the current developments in theory and practice of China’s education.Four articles and one book review are being published in the current issue reflecting China’s contemporary progressive education from different sides.In The Way of “Wei Yu” -- An Orientation of Education for the Chinese in the Globalizing World, Professor Zhang Shiya discussed the characteristics of contemporary Chinese education in the context of globalization and internalization. Professor Zhang pointed out that the concept of Chinese includes not only the 56 ethnic groups inhabiting in China, but also Chinese descendants overseas. The author argued that all Chinese people have a common basis of identification: four words, “Zhong He Wei Yu”(center, harmony, position, birth), have been engraved in Dacheng Hall of Confucian temple in Qufu City, Shandong Province. Education for the Chinese Groups advocated by Professor Zhang expatiate a philosophical approach of Chinese culture: rich in individuality, harmony in society and Great Harmony all over the world.In the second paper,the Development of Leadership and Transformation of Management in School Transition --Observation and Apperception in the construction of “New Basic Education”, Professor Yang Xiaowei , as an important member of “New Basic Education” Group, analyzed and summarized the transformation of leaders and managers in experimental schools. Professor Yang indicated that multi-value orientation of Education Reform based on participation and democracy not only put forward the urgency of school transition reform, but also offer great challenge and tribulation to the role of school leaders, including role-awareness, decision-making and project-planning. According to the author, the “pushing down the focus” strategy carried out by Base Schools not only strengthened the awareness of “First Responsible Person”, but also opened up a space for self-practice in disquisitive reform, and also inspired teachers to think independently. It also offered them the will to research corporately, the desire and the vigor to develop themselves and brought favorable interaction between system renovation and culture construction. Professor Yang Xiaowei’s paper demonstrated many vivid pictures of elementary schools and high schools’ education reform.In the third paper, The Structure of the New Curricula in New Round Ordinary High Schools in China, Professor Liao Boqin first discussed the structural relationship of the learning fields, subjects and modules, and then expatiated on their exhibition in new high school physic curricula. Professor Liao pointed out that there are eight fields in the new high school curricula, including Language and Literature, Mathematics,Human Culture and Society, Science, Technology, Art, Physical Education and Integrated Practice. Each learning field has one or more subjects, and each subject has some modules which are the basic units of curricular content. High school physics curriculum has the same structure as mentioned, yet it emphasizes the unification of fundamentality and selectivity. In the new curriculum of ordinary high school, module is the central unit of curriculum structure. There are twelve modules falling into two parts: required courses and elective courses. Each module has multiple education functions, and the series formed by modules represents different emphases of education function. Each set of modules contains not only the physical concepts, rules and experiments, but also other aspects like the thoughts and methods of physics , physics and development of society, physics and application of technology, physics and life, etc. The new physic curriculum for high school emphasizes the advancement of national sensitivity on the basis of Nine-Year Compulsory Education and the foundation of students’ lifelong study.In the fourth paper, China’s Sociology of Education: Issues and Problems, written by Professor Ma Hemin and Ms. He Fang explored the four periods in the development of China’s Sociology of Education: establishing period (1922-1949), standstill period (1949-1979), reconstruction period (1979-1998) and new development period since 1998. The paper mainly discussed the course of development, difficulties encountered, problems existing and choice of development of Sociology of Education in China.We hope you enjoy reading this issue and encourage you to submit your valuable works to coming issues of the journal.Mustafa Yunus ERYAMAN YANG ChangyongManaging Editor Guest Editor编者语中国是一个人口大国,也是一个教育大国。
激光熔融技术
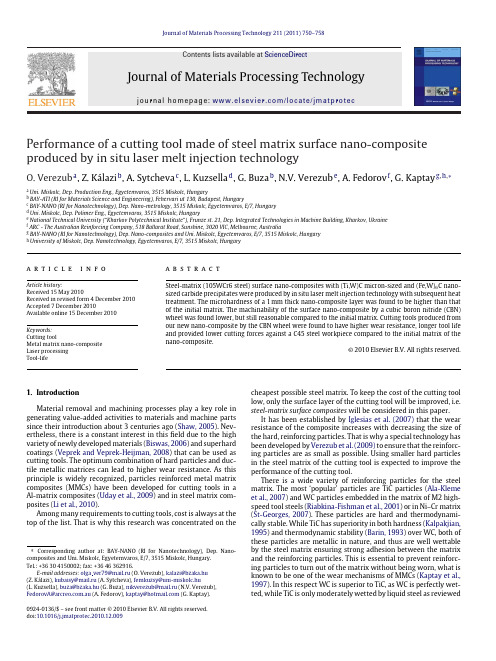
Journal of Materials Processing Technology 211(2011)750–758Contents lists available at ScienceDirectJournal of Materials ProcessingTechnologyj o u r n a l h o m e p a g e :w w w.e l s e v i e r.c o m /l o c a t e /j m a t p r o t ecPerformance of a cutting tool made of steel matrix surface nano-composite produced by in situ laser melt injection technologyO.Verezub a ,Z.Kálazi b ,A.Sytcheva c ,L.Kuzsella d ,G.Buza b ,N.V.Verezub e ,A.Fedorov f ,G.Kaptay g ,h ,∗aUni.Miskolc,Dep.Production Eng.,Egyetemvaros,3515Miskolc,HungarybBAY-ATI (RI for Materials Science and Engineering),Fehervari ut 130,Budapest,Hungary cBAY-NANO (RI for Nanotechnology),Dep.Nano-metrology,3515Miskolc,Egyetemvaros,E/7,Hungary dUni.Miskolc,Dep.Polimer Eng.,Egyetemvaros,3515Miskolc,Hungary eNational Technical University (“Kharkov Polytechnical Institute”),Frunze st.21,Dep.Integrated Technologies in Machine Building,Kharkov,Ukraine fARC -The Australian Reinforcing Company,518Ballarat Road,Sunshine,3020VIC,Melbourne,Australia gBAY-NANO (RI for Nanotechnology),Dep.Nano-composites and Uni.Miskolc,Egyetemvaros,E/7,3515Miskolc,Hungary hUniversity of Miskolc,Dep.Nanotechnology,Egyetemvaros,E/7,3515Miskolc,Hungarya r t i c l e i n f o Article history:Received 15May 2010Received in revised form 4December 2010Accepted 7December 2010Available online 15December 2010Keywords:Cutting toolMetal matrix nano-composite Laser processing Tool-lifea b s t r a c tSteel-matrix (105WCr6steel)surface nano-composites with (Ti,W)C micron-sized and (Fe,W)6C nano-sized carbide precipitates were produced by in situ laser melt injection technology with subsequent heat treatment.The microhardness of a 1mm thick nano-composite layer was found to be higher than that of the initial matrix.The machinability of the surface nano-composite by a cubic boron nitride (CBN)wheel was found lower,but still reasonable compared to the initial matrix.Cutting tools produced from our new nano-composite by the CBN wheel were found to have higher wear resistance,longer tool life and provided lower cutting forces against a C45steel workpiece compared to the initial matrix of the nano-composite.©2010Elsevier B.V.All rights reserved.1.IntroductionMaterial removal and machining processes play a key role in generating value-added activities to materials and machine parts since their introduction about 3centuries ago (Shaw,2005).Nev-ertheless,there is a constant interest in this field due to the high variety of newly developed materials (Biswas,2006)and superhard coatings (Veprek and Veprek-Heijman,2008)that can be used as cutting tools.The optimum combination of hard particles and duc-tile metallic matrices can lead to higher wear resistance.As this principle is widely recognized,particles reinforced metal matrix composites (MMCs)have been developed for cutting tools in a Al-matrix composites (Uday et al.,2009)and in steel matrix com-posites (Li et al.,2010).Among many requirements to cutting tools,cost is always at the top of the list.That is why this research was concentrated on the∗Corresponding author at:BAY-NANO (RI for Nanotechnology),Dep.Nano-composites and Uni.Miskolc,Egyetemvaros,E/7,3515Miskolc,Hungary.Tel.:+36304150002;fax:+3646362916.E-mail addresses:olga ver79@mail.ru (O.Verezub),kalazi@bzaka.hu (Z.Kálazi),kubaisy@mail.ru (A.Sytcheva),femkuzsy@uni-miskolc.hu(L.Kuzsella),buza@bzaka.hu (G.Buza),nikverezub@mail.ru (N.V.Verezub),FedorovA@.au (A.Fedorov),kaptay@ (G.Kaptay).cheapest possible steel matrix.To keep the cost of the cutting tool low,only the surface layer of the cutting tool will be improved,i.e.steel -matrix surface composites will be considered in this paper.It has been established by Iglesias et al.(2007)that the wear resistance of the composite increases with decreasing the size of the hard,reinforcing particles.That is why a special technology has been developed by Verezub et al.(2009)to ensure that the reinforc-ing particles are as small as ing smaller hard particles in the steel matrix of the cutting tool is expected to improve the performance of the cutting tool.There is a wide variety of reinforcing particles for the steel matrix.The most ‘popular’particles are TiC particles (Ala-Kleme et al.,2007)and WC particles embedded in the matrix of M2high-speed tool steels (Riabkina-Fishman et al.,2001)or in Ni–Cr matrix (St-Georges,2007).These particles are hard and thermodynami-cally stable.While TiC has superiority in both hardness (Kalpakjian,1995)and thermodynamic stability (Barin,1993)over WC,both of these particles are metallic in nature,and thus are well wettable by the steel matrix ensuring strong adhesion between the matrix and the reinforcing particles.This is essential to prevent reinforc-ing particles to turn out of the matrix without being worn,what is known to be one of the wear mechanisms of MMCs (Kaptay et al.,1997).In this respect WC is superior to TiC,as WC is perfectly wet-ted,while TiC is only moderately wetted by liquid steel as reviewed0924-0136/$–see front matter ©2010Elsevier B.V.All rights reserved.doi:10.1016/j.jmatprotec.2010.12.009O.Verezub et al./Journal of Materials Processing Technology211(2011)750–758751Table1Composition(in wt%)of the HVG steel(similar to105WCr6steel)(balance:Fe).C Mn Si S P Cu Cr Ni Al Ti Mo Nb W V O0.99 1.000.380.0140.0210.14 1.030.190.0280.0050.10.01 1.340.030.0056by Eustathopoulos et al.(1999)and shown theoretically by Kaptay (2005).Among the many possible technologies to produce steel matrix surface nano-composites,the laser melt injection(LMI)technology has been selected by the authors.This technology was developed 3decades ago by Ayers and Tucker(1980)to produce a surface composite layer.In this technique large(around100m)carbide particles are blown by a gas stream into a moving laser melted pool of a substrate metal.The method is superior to all coating technologies in providing perfect adhesion between the compos-ite and the substrate and also in providing large thickness(around 1mm)allowing to re-ground the cutting ter the LMI tech-nology has been proven to be efficient to produce WC particles reinforced steel matrix composites by Liu et al.(2008),using par-ticularly X40CrMoV5–1steel surface layer by Dobrzanski et al. (2005)and duplex stainless steels matrix by Do Nascimento et al. (2008).The combination of WC+Co particles was used by Bitay and Roósz(2006).TiC particles were added into liquid steel by Fábián et al.(2003).The drawback of LMI technology is that only large carbide par-ticles with a sufficiently large kinetic energy can break the high surface tension liquid metal/gas interface,as was proven for liq-uid steel by Farias and Irons(1985)and for liquid aluminum by Vreeling et al.(2000).This is especially true for low-density TiC particles(compared to the density of liquid steel)that are not‘per-fectly’wetted by liquid steel as shown by Verezub et al.(2005). In fact,incorporation problems for the TiC/liquid steel couple was mentioned in the veryfirst paper by Ayers and Tucker(1980)and was later confirmed by Králik et al.(2003).Thus,the steel rein-forcing matrix,the TiC particles,the LMI technique and the desire to produce surface nano-composite seem to be contradictory.To solve this problem,an in situ LMI technology was developed by Verezub et al.(2009)to produce steel matrix carbide reinforced surface nano-composites.The in situ production route of steel-matrix TiC reinforced composites has been known since the work by Terry and Chinyamakobvu(1991).This method has been developed further by using reaction casting by Feng et al.(2005)and high-energy electron beam irradiation by Lee et al.(2006).The method was extended to produce Fe/(TiW)C composite powder by Correa et al. (2007).Good tribological behaviour of TiC–ferrous matrix com-posites was shown by Kattamis and Suganuma(1990).The Fe/TiC composites were found to have excellent wear properties by Galgali et al.(1999),confirmed also for elevated temperatures by Degnan et al.(2001).The samefinding was extended by Dogan et al.(2001) for cast chromium steels reinforced by TiC particles.Nevertheless, the in situ production of Fe/TiC composites and the LMI technology was combined for thefirst time by Verezub et al.(2009).The goal of the present paper is to evaluate the machinability(upon producing a cutting tool from it)and also the performance as a cutting tool of a steel matrix(TiW)C reinforced surface nano-composite produced on a cheap steel matrix by the in situ LMI process.2.Materials and methods2.1.MaterialsLow-alloyed tool steel plates of grade HVG(Russian GOST5950-73,1973being the analogue of steel105WCr6)have been selected as a base material for the current research.Detailed chemical com-position of the HVG substrate is given in Table1.The initial size of the substrates was8mm×8mm×4mm.Additionally,tungsten carbide and metallic titanium powders of chemical purity,both with a particle size of45–70m were used.These two powders were mixed at a1:1molar ratio.This molar ratio was chosen as the most stable carbides in the Ti–W–C system are the TiC and WC car-bides,and in this way the exchange reaction Ti+WC=W+TiC can be ensured between them.Of-course,the C-content of the original steel will also play some role(see below).2.2.Production of the nano-compositesSchematic diagram of LMI-equipment used in the current study is shown in Fig.1.The upper8mm×8mm plane of the HVG sub-strate was coated by a thin layer of graphite to increase laser beam absorption efficiency during the LMI process.The other side of the steel substrate was brazed onto a large,water-cooled Cu-plate to ensure fast cooling of the substrate.The top surface of the substrate was melted by a2.5kW CO2continuous wave laser(type Trumph TLC105),with a laser spot of2mm in diameter.The laser spot was moving along the sample with a scanning speed of400mm/min. The(WC+Ti)powder mixture was blown into the melted pool at an angle of45◦using argon as carrier gas.The following three pow-der feeding rates were used during our experiments:1.3g/min, 2.3g/min and3.8g/min.Several laser tracks were drawn parallel to each other with a50%overlapping.After the LMI process,the rapidly cooled samples were heat treated under the following conditions:austenitizing at a tempera-ture of1000–1050◦C during10–15s in a high frequency induction furnace,followed by rapid cooling and tempering at a temperature of350◦C for1h.The second round of tempering was performed during1h at560◦C.For reasons of more correct comparison,the initial HVG samples were heat treated under usual conditions (hardening at840◦C and tempering at170◦C).The samples were grinded,polished,etched and analyzed uti-lizing special techniques.The microstructure of the substrates was observed using an AMRAY1810i SEM(Scanning Electron Microscopy with micro resolution),equipped with EDS(Energy Dispersive X-ray Spectroscopy).The identification of nano-sized particles was performed by a high resolution SEM(HitachiS-4800,Fig.1.The schematic diagram of the laser melt injection(LMI)equipment(1–laser, 2–powder nozzle,3–steel substrate to be treated,4–copper cooling plate,5–working table,6–cooling water input and output).752O.Verezub et al./Journal of Materials Processing Technology211(2011)750–758Japan).Quantitative analysis of the samples was performed by ImageJ software.In different parts of the paper the following short sample names are used:i.“LMI”is the sample produced here by the LMI procedure includ-ing heat treatment.ii.“HVG”is the original HVG sample(see Table1)heat treated as described above.iii.“HSS”is a commercially available high speed steel sample with 6%W+5%Mo.2.3.Microhardness measurement of the nano-compositeThe microhardness profiles were measured using TUKON2100B equipment(Wilson Instr.)using load of500g and time of pressing of10s.The samples were polished and etched before the micro-hardness measurements.Microhardness was scanned along two lines:(i)perpendicular to the surface,as function of depth,and(ii) parallel along the surface,at the depth of0.40mm.2.4.Machinability of the nano-composite by cubic BN wheelA cubic boron nitride(CBN)grindingflaring cup wheel of type L010(125/100)–100%–B1–58(Russian standard)which cor-responds to grinding wheel B120C100vitrified bond(Stephenson and Agapiou,2006)was used to remove small quantities of the sur-face composite material to produce the required shape and surface quality for the cutting tool insert.Additionally,the grinding ratio of the CBN wheel was studied by removing the same thickness of 1mm from each substrate(HVG,LMI,HSS).The grinding ratio G,is defined as the ratio of worn mass of the grinding wheel(mg)to the mass of the removed material(g).The CBN wheel was studied by SEM+EDS after the grinding experiments.2.5.Performance of a cutting tool made of LMI nano-composite materialSteel C45(0.45%C+0.6%Mn+0.25%Si)was used as a workpiece for the cutting experiments.Machining of the steel C45workpiece was performed by the HVG,LMI and HSS cutting tools.All the exper-iments were run with the following cutting conditions:cutting speed V=20–60m/min,feed f=0.05–0.3mm/rev and depth of cut d=0.25–1.75mm.The cutting force components were measured by a piezoelectric dynamometer(Kistler).SEM and EDS analysis of the cutting tool and the removed chips were applied after the cutting experiments.3.Results and discussion3.1.Structure and composition of the nano-compositeFig.2shows SEM pictures of cross section of the characteristic LMI sample.Fig.2a shows that the depth of the surface composite layer is approximately1mm.Due to multiple scanning by the laser beam,the depth of the melted layer shows a certain pattern in Fig.2a,with minima in the depth separated by a distance of about 1mm(what is half of the2mm laser spot diameter due to50% of overlapping).As one can see from Fig.2,the microstructure of the melted layer seems to be macroscopically homogeneous.This is due to the high velocity of Marangoni convection of the laser melted pool during the LMI process.Fig.3shows enlarged SEM pictures of the LMI sample with two types of precipitates.The several micron sized(Ti,W)C carbide pre-cipitates(Fig.3a)formed during fast cooling at the latest stage ofthe Fig.2.SEM pictures of the cross sections of the steel substrate after the LMI treat-ment(a)and the general view of the microstructure within the laser treated zone (b)(powder feeding rate is2.3g/min).LMI process by in situ precipitation from the molten steel matrix. The core of these precipitates is rich in Ti,while the outer region of the precipitates is rich in W.This is so due to higher thermodynamic stability of TiC compared to WC.The second type of precipitates is below100nm in diameter and is formed only during the subse-quent heat treatment.These nano-particles are(Fe,W)6C carbides (Fig.3a and b),precipitating from the supersaturated solid steel matrix(for more details see Verezub et al.,2009).The volume%of micron sized(Ti,W)C particles are shown in Fig.4as function of the powder feeding rate.The theoretical maximum,shown in Fig.4was calculated from the technologi-cal parameters and from the cross section of the melted zone(see Fig.2a).One can see that in the as-received LMI samples the amount of incorporated(Ti,W)C particles is somewhat lower compared to the theoretical maximum.The incorporation ratio decreases from 89%(for1.3g/min)to76%(for3.8g/m)with increasing the pow-der feeding rate.It is probably due to the gradual increase in the effective viscosity of the suspension with increasing its solid con-tent,what makes further incorporation and dissolution of(Ti+WC) particles more difficult.During heat treatment of the LMI samples, the volume%of micron-sized(Ti,W)C particles is decreased further by about20%.This is due to the partial dissolution of the W-rich outer region of the micron-sized(Ti,W)C precipitates.The amount of nano-sized(Fe,W)6C particles is found around25±5vol%,being independent of the powder feeding rate.These nano-sized particles form during the heat treatment,from the over-saturated matrix and partially from the dissolved outer regions of the micron-sized precipitates.As follows from materials balance,the majority of the content of these(Fe,W)6C nano-particles originate from the mate-rial of the matrix.Further investigation is needed to clarify howO.Verezub et al./Journal of Materials Processing Technology 211(2011)750–758753Fig.3.SEM micrographs of the cross section of the LMI sample in two different magnifications (powder feeding rate is 2.3g/min).the conditions of heat treatment influence the micro-and nano-structure of the composite and the amount and size distribution of (Fe,W)6C particles.It should be mentioned that at the highest powder feeding rate of 3.8g/min the LMI samples appeared to be cracked.This is probably due to the too high volume %of the carbide phase in the matrix.The two other samples (produced at the powder feeding rates of 1.3and 2.3g/min)are free of cracks.The latter is more promising as the higher amount of carbide phase leads to improved mechanical properties of the composite,if the formation of cracks is avoided.3.2.Microhardness of the LMI nano-composite sampleThe depth profile of microhardness of the LMI nano-composite sample with powder feeding rate of 2.3g/min is shown in Fig.5.All measurements are made after the heat treatment described in the experimental part.The depth profile can be divided into three regions:010*******12345powder feeding rate, g/min(T i ,W )C , v o l %Fig.4.The volume %of the micron-sized (Ti,W)C particles as function of powder feeding rate after the LMI process (before and after the heat treatment procedure).020040060080010001200140000.51 1.52M i c r o h a r d n e s s , HVDistance from surface, mmFig.5.Depth profile of microhardness of the LMI nano-composites (powder feeding rate is 2.3g/min).i.The upper surface layer of about 500m thickness has a highest microhardness of about 1200HV.ii.The initial substrate (below 1mm from the top surface)has a lowest microhardness of about 1000HV.iii.There is a transition zone between 500and 1000m measuredfrom the top surface,within which the microhardness gradually changes between the above mentioned limits.In evaluation of these results let us remind that carbon can diffuse from the non-melted part of the substrate into the melted LMI part of the substrate during the heat treatment.The increased microhardness of the upper surface layer of LMI nano-composite sample is obviously due to the precipitated micron-sized (Ti,W)C and nano-sized (Fe,W)6C hard carbide par-ticles.The existence of the intermediate zone could be due to the interplay between solidification rate (solidification goes from the bottom of the melted zone upwards)and the feeding and mixing rates of the added powder mixture (powder mixture is added to the top and the incorporated particles together with the dissolved atoms move downwards mainly by the Marangoni convection).In Fig.6a the measured microhardness is shown parallel along the sample surface,at the depth of about 0.4mm for both the as received LMI sample and the heat treated LMI sample.One can see that the microhardness of the LMI samples increase due to the heat treatment,what is probably due to the formation of (Fe,W)6C02004006008001000120014000.511.522.53M i c r o h a r d n e s s , H VDistance, mm00.20.40.60.8100.511.52 2.53d e p t h , m mdistance, mmFig.6.Microhardness scanned parallel along the surface,at the depth of about 0.4mm for both as received LMI sample and the heat treated LMI sample (a)and the depth of the melted pool as function of the same path (b)(see the pattern in Fig.2a).754O.Verezub et al./Journal of Materials Processing Technology 211(2011)750–7580.0340f , m m /p a s sv f ,/m i nFig.7.The grinding ratio of the LMI nano-composite sample (powder feeding rate is 2.3g/min,V =25m/s).nanoparticles.It is also obvious that the heat treatment flatters out the large fluctuations in the microhardness of the as received LMI sample.The minima in the microhardness fluctuations (Fig.6a)approximately coincide with the minima in the depth of the melted zone (see Fig.6b and the pattern in Fig.2a).This can be explained by Fig.5,measured at the largest depth of the melted zone.The smaller is the depth of the melted zone,the higher becomes the relative depth of the same absolute depth of 0.4mm,and thus,in accordance with Fig.5,the smaller is the microhardness.As follows from Figs.5–6,the microhardness of the produced nano-composite layer is around 12GPa.For this value the optimum grinding wheel and the optimum workpiece to be machined should be selected such that the ratio of microhardnesses of the machining and that of the to be machined materials should be at least 3.As a machining tool,CBN (cubic boron-nitride)has been selected with its microhardness of about 50GPa (Kalpakjian,1995)being about 4.2times stronger compared to the hardness of our LMI sample.On the other hand,the C45workpiece has been selected with its microhardness of about 2.7GPa,being about 4.4times less strong compared to our LMI sample.Thus,the microhardness of our LMI nano-composite sample is positioned almost in the middle (in a logarithmic scale)of the interval between the microhardness val-ues of the machining CBN tool and that of the to be machined C45workpiece.3.3.Machinability of the LMI nano-composite by cubic BN wheel During the LMI treatment the surface of the substrate melts,and thus it becomes quite uneven after solidification (the subsequent heat treatment does not provide any significant improvement).As a result,the as-received LMI nano-composite sample cannot be used as a cutting tool.Therefore,the as-received LMI nano-composite sample was grinded by a CBN wheel to obtain the shape and surface quality required for cutting tools.Fig.7shows the grinding ratio of the LMI nano-composite sam-ple as function of the feed rate of the workpiece (v f ,m/min)and a feed (f ,mm/pass).The combination of a feed of f =0.04m/pass and a feed rate of v f =3m/min leads to a maximum grinding ratio of about G =45–50mg/g.Based on the results shown in Fig.7,the optimal grinding conditions are selected as:f =0.01–0.02mm/pass,v f =1–2m/min and V =25m/s.Under these conditions the grinding ratio can be kept at a reasonable level of G =8–15mg/g.In compari-son,under the same conditions the grinding ratio for the HVG steel was found to be 6.8mg/g,while the grinding ratio for HSS is known to be about 5–6mg/g (Lisanov,1978).The increased grinding ratio of our LMI sample is obviously due to the hard (Ti,W)C and (Fe,W)6C particles in the surface of newly developed material.Fig.8.The EDS spectra of CBN wheels after grinding HVG (a)and LMI (b)samples (powder feeding rate is 2.3g/min).In Fig.8the energy dispersive X-ray spectra of two CBN wheels are compared after identical grinding runs of the HVG and LMI samples.In addition to the C-and Fe-peaks after grinding the HVG sample,large W and Ti peaks are observed after grinding the LMI nano-composite sample.This can be explained by stabilisation of the C-content of the initial steel substrate by added Ti and by the attraction between (Ti,W)and (B,N)atoms,respectively,being due to the existence of stable titanium boride,titanium nitride and tungsten boride compounds as reported by Barin (1993).Thus,dur-ing the grinding process part of the Ti-and W-content of the LMI nano-composite substrate adheres to the CBN surface.The pres-ence of solid titanium and tungsten carbides causes loosening of the CBN grains and their fallout,leading to intensive wear of the wheel,also shown by Klimenko et al.(1996).Forming the rake and flank surfaces during grinding of the LMI nano-composite samples resembles the grinding of high-speed steel cutting tools as shown by Mamalis et al.(2002).When the high quality alloyed layer is achieved,cutting edge without visible chip-ping is obtained.At the same time the edge roughness,as well as the radius of the cutting edge are higher for the HVG substrate com-pared to the LMI nano-composite substrate (Table 2).Increase of the feed rate and that of the feed lead to further increase in roughness of the tool’s cutting edge.Table 2Roughness of tool’s cutting edge and surfaces after grinding by CBN wheels (param-eters:V =25m/s,v f =2m/min,f =0.01mm/pass).Tool material Cutting edgeroughness R a ,m Roughness of rake and flank surfaces R a ,m HSS 1.2–1.30.15–0.18LMI 1.3–1.50.17–0.20HVG1.4–1.60.21–0.24O.Verezub et al./Journal of Materials Processing Technology 211(2011)750–75875500,10,20,30,40,5050100150200machining time, minV B , m mFig.9.The influence of machining time on flank wear for different cutting tool materials (V =25m/min,f =0.1mm/rev,d =0.5mm).Curves correspond to the HVG steel,LMI nano-composite produced with different powder feeding rates (figures on curves correspond to the unit of g/min),and HSS.Overall it can be concluded that CBN wheels can be used with optimum grinding parameters of f =0.01–0.02mm/pass,v f =1–2m/min and V =25m/s to convert the as-received LMI nano-composite into the cutting tool.The required shape and roughness of the cutting tool can be obtained with a reasonable grinding ratio of about G =8–15mg/g.3.4.Tool life of the cutting tool made of our nano-composite During testing of a new LMI nano-composite cutting tool on C45workpiece,crater wear was found to be negligible compared to flank wear.These two types of wear are the most common measured forms of tool wear.Thus,the tool life of this newLMI2040608010012014016018001234powder feeding rate, g/mint o o l l i f e , m i nFig.10.Tool life as function of the powder feeding rate during the LMI process (V =25m/min,f =0.1mm/rev,d =0.5mm)(the point at zero feeding rate refers to a different heat history of a sample,that is why this point is connected to other points by a thin line).nano-composite cutting tool is determined from the measured flank wear.Fig.9shows flank wear measurements for HVG steel used as a base material,LMI nano-composite produced with different pow-der feeding rates and HSS.The critical flank wear of 0.45mm was chosen based on values recommended for replacing or re-grounding alloyed tool materials (Kalpakjian,1995).The machining time during which the actual flank wear achieves the critical value is called tool life (T ,min).Tool life as function of the powder feeding rate is shown in Fig.10.It shows that an optimum value of the powder feeding rate exists for the maximum tool life.When Fig.10is rationalized in combination with Fig.4,it can be seenthat the volume %of carbide particles in the compositeFig.11.SEM images of the cutting tool made of the LMI sample after its service (a–c)and EDS spectrum (d)of the worn surface.756O.Verezub et al./Journal of Materials Processing Technology211(2011)750–758Fig.12.Removed chip from steel C45by the LMI cutting tool(a)and its EDS spec-trum(b).gradually increases with the increase of powder feeding rate and,as a consequence,tool life also increases.However,as was mentioned above,cracks were formed in the substrate,made by the powder feeding rate of3.8g/min.As a result,a cutting tool made of this substrate has a lower tool life.One can suppose that there is an optimum feeding rate in the interval between2.3and3.8g/min, when the volume%of carbide particles is somewhat larger than for the2.3g/min feeding rate,but still without crack formation.The SEM images of the LMI nano-composite cutting tool faces after machining of C45steel are shown in Fig.11.Fig.11a shows the overlapping of the LMI tracks and the traces of theflank wear(mea-sured as0.45mm).In Fig.11b–c carbide particles being similar to those shown in Figs.2–3are shown.The difference is that the steel matrix is worn away in between the hard carbide particles after machining compared to the initial state of the LMI nano-composite substrate(compare Fig.11b–c to Figs.2–3).Therefore,it is evident that theflank wear is the result of abrasive wear of the LMI cutting tool.The EDS spectrum(Fig.11d)of the worn surface shows Fe,Ti, W as basic components.In Fig.12the SEM picture and EDS spectrum of the removed chip from the C45workpiece is shown,after its machining by the LMI nano-composite cutting tool.It can be seen that the removed chip is continuous,and the main elements of the nano-composite (Ti and W)are missing from its X-ray spectrum.Thus,there was no adhesion of Ti and/or W to the C45steel workpiece during its machining by the LMI nano-composite cutting tool.In order to position our cutting tool made of the LMI substrate on a tool-life scale,tool-life tests have been conducted.The effect of cutting speed V on tool-life T has been assessed using Taylor’s tool life equation(Eq.(1))(Taylor,1907)and the results are shown Table3Experimental tool life(T,min)of different cutting tool materials against C45work-piece(f=0.1mm/rev and d=0.5mm).V,m/min T,min(experimental)HVG LMI HSS20385500535 2550160190 30157088 3542550 40–1726 45–715 50–47 60–24in Table3.C1=V·T n(1) Eq.(1)is widely used and recognized in the industry.It relates tool life to the cutting speed through empirical tool life constants n and C1.Table4shows the range of values n and C1for different cutting tool materials obtained from the data in Table3.The data(Table4)indicate that the LMI process of inserting (TiW)C particles into HVG substrate improved tool life of the base material by300–400%when cutting speed V was25–35m/min. However,this new material was felt short to surpass tool life of HSS cutting material by just20%in the same cutting speed range.No sig-nificant difference between tool life of HSS and LMI was observed during machining at20m/min.Performance of cutting tools made of LMI nano-composite is similar to the performance of HSS and is limited by wear resistance at cutting speeds above40–45m/min (Stephenson and Agapiou,2006).Cutting tools made of HVG steel can be used at speeds up to30m/min.3.5.Cutting force componentsDuring machining of the C45workpieces by the cutting tool made of HVG and LMI substrates,the two main force components F z (N)and F x(N)have been measured as function of the depth of cut d (mm)and feed f(mm/rev).The effects of depth of cut and feed on the measured F z and F x force components for the two different cutting materials(HVG and LMI nano-composite)are shown in Figs.13–14. The cutting speed increase within limits of V c=20–60m/min does not sufficiently influence the value of the cutting force(Fedorov, 2005)and therefore has not been tested in this paper.The effect of depth of cut d on the measured force components for two different cutting tool materials is shown in Fig.13a and b. Forces F z and F x increase with the increase in depth of cut because the increase in depth of cut leads to increase in the area of cut and length of the cutting edge in contact.The influence of feed f on the forces F z and F x is shown in Fig.14a and b.The increases in feed lead to increase in cut thickness,which,in turn,increases the area of cut and as a consequence,the force components.Figs.13–14show that machining with LMI nano-composite cut-ting tool material decreases cutting forces F z and F x in comparison with HVG cutting tool material.However,significant force reduc-tions can only be observed when depth of cut is greater than1mm and feed is greater than0.2mm/rev.The force components can be described as function of parameters d and f by the followingTable4Values of n and C1for different tool materials(f=0.1mm/rev,d=0.5mm).Cutting tool material n C1HSS0.2280.89 LMI0.1967.18 HVG0.1241.58。
OrganicPreparationsandProceduresInternational

This article was downloaded by: [Moskow State Univ Bibliote]On: 20 September 2013, At: 06:33Publisher: Taylor & FrancisInforma Ltd Registered in England and Wales Registered Number: 1072954 Registered office: Mortimer House, 37-41 Mortimer Street, London W1T 3JH, UKOrganic Preparations and ProceduresInternational: The New Journal for OrganicSynthesisPublication details, including instructions for authors and subscriptioninformation:/loi/uopp20AN IMPROVED METHOD FOR THEPREPARATION OF 2-SUBSTITUTED 1,2-BENZISOTHIAZOL-3 (2H)-ONES. NOVELCYCLIZATION OF N-SUBSTITUTED 2-CARBAMOYLBENZENESULFENYL BROMIDESON ACTIVATED BASIC ALUMINANobumasa Kamigata a , Satoshi Hashimoto a & Michio Kobayashi aa Department of Chemistry, Faculty of Science T okyo MetropolitanUniversity, Fukazawa, Setagaya, T okyo, 158, JapanPublished online: 18 Feb 2009.PLEASE SCROLL DOWN FOR ARTICLETaylor & Francis makes every effort to ensure the accuracy of all the information (the “Content”) contained in the publications on our platform. However, Taylor & Francis, our agents, and our licensors make no representations or warranties whatsoever as to the accuracy, completeness, or suitability for any purpose of the Content. Any opinions and views expressed in this publication are the opinions and views of the authors, and are not the views of or endorsed by Taylor & Francis. The accuracy of the Content should not be relied upon and should be independently verified with primary sources of information. Taylor and Francis shall not be liable for any losses, actions, claims, proceedings, demands, costs, expenses, damages, and other liabilities whatsoever or howsoever caused arising directly or indirectly in connection with, in relation to or arising out of the use of the Content.This article may be used for research, teaching, and private study purposes. Any substantialor systematic reproduction, redistribution, reselling, loan, sub-licensing, systematic supply, orD o w n l o a d e d b y [M o s k o w S t a t e U n i v B i b l i o t e ] a t 06:33 20 S e p t e m b e r 2013D o w n l o a d e d b y [M o s k o w S t a t e U n i v B i b l i o t e ] a t 06:33 20 S e p t e m b e r 2013D o w n l o a d e d b y [M o s k o w S t a t e U n i v B i b l i o t e ] a t 06:33 20 S e p t e m b e r 2013D o w n l o a d e d b y [M o s k o w S t a t e U n i v B i b l i o t e ] a t 06:33 20 S e p t e m b e r 2013D o w n l o a d e d b y [M o s k o w S t a t e U n i v B i b l i o t e ] a t 06:33 20 S e p t e m b e r 2013D o w n l o a d e d b y [M o s k o w S t a t e U n i v B i b l i o t e ] a t 06:33 20 S e p t e m b e r 2013。
深圳人口英文版(优秀)

The P opulation of Shenzhen and T he M edical D emand PredictionFrist editorSecond editorThird editorYour school nameAdvisor:********Abstract::AbstractIn this paper,using the establishment of the Malthus index of population growth model,gray model and linear regression model predict the population growth and beds demand for medical care in Shenzhen city.For question One:first of all,through the analysis the household register population,the non-registered population,the change of the number of the population characteristics of Shenzhen in recent ten years,we build the Malthus index of population growth model on the household registration population.To predict the number of the non-registered population,we use the cubic exponential smoothing method.We establish the gray model GM(1,1)based on different age groups,moreover,we verify the feasibility of the ing the model,we predict the number of Shenzhen resident non-registered population numbers and different age population in the next ten years.Then,using linear fitting method forecasts the value of beds demand.For question Two:we mainly consider the relationship between age structure and prevalence characteristics.According to each kind of disease in high-risk population,we determine the effect of age structure of population.Then,combined with the incidence rate,we analyzed the number of sick.According to the clinic characteristics of medical institutions of different types,we figure out the bed-space requirements of various kinds of diseases in different types of medical institutions by MATLAB software.Keywords:Malthus index of population growth model,Cubic exponential smoothing method,GM(1,1),MATLAB software1.IntroductionShenzhen is one of the fastest growing city in economy development.In recent years,with the reform and opening up and the changes of industrial structure in Shenzhen,the population of Shenzhen is undergoing tremendous changes.Therefore,it is particularly important to predict the population’s trend of Shenzhen.2.Problem analysisAiming at a population prediction problem,the population is divided into the household register population and the non-registered population.Due to the mobility of the population is relatively low,and the time of the prediction is relatively short,so we can develop the Malthus index of population growth model to estimate the number of registered population.The non-registered population population growth is much affected by various factors and the non-domicile population increased by second-degree curve,so we can use the cubic exponential smoothing method to predict the number of non-registered population.For the problem of a bed demand prediction,in a certain extent,the total numberof beds can reflect the demand of beds in 1979-2010years .Because of serious tendency of the aging population of Shenzhen city ,the number of beds are still needed on the original basis and keep a year-on-year increase of population at least in the future.For problem two,we do analysis on children pneumonia and hypertension,children pneumonia is characterized by pneumonia in children,which only for the age is in 0-4years old group.Meanwhile,hypertension is mainly in the elderly population.3.Model assumptions1.The data are accurate and reliable;2.Shenzhen city population prevalence is in the average rate of medium-sized city National hospital.3.The district of Shenzhen city population distribution is not changed greatly in 10years.4.Assuming that economic development in Shenzhen city level maintain a stable in the future of a period of time.5.The population policy and the medical system does not change .6.There is not considering the impact of major disease and war effect on population.4.Symbolic descriptionpopulation Permanent :y populationRegistered :1y populationregistered -Non :2y 5.Establishing and Analyzing the Models5.1the Prediction of P opulation of Shenzhen (2011-2020)We assume that the number of the population of Shenzhen is y in t year,of which the household registration population is 1y and the non-registered population is 2y .We can get :21y y y +=.Next,we forecast on the registration population and non -household population.5.1.1the Prediction M odel of the Registered P opulationIn consideration of the household registration population,owing to the mobility population is low relatively and Δt is short,so there is no need to consider the blocking effect of natural resources,environmental conditions and other factors on population growth,so using Malthus index of []1growth population model to estimate the population.)(110)0()(t t r e y t y −=(1)According to the formula (1)and the number of register population (Appendix I attached),,Using nonlinear least squares fitting by MATLAB software can get the r parameter value is 0.0677.Get the model :)1979(0667.0126.31)(−=t e t y (2)According to the formula (2),we get the number of estimated population,its residual error and relative error from 1979to 2010.The results are shown in the following T able 1:Year Actual number of registered population Estimated number of registered population Residual error Relative error (%)197931.2631.2600198032.0933.4496-1.3596 4.236833905198133.3935.7925-2.40257.195268044198235.4538.2996-2.84968.038363893198340.5240.9823-0.4623 1.140918065198443.5243.8528-0.33280.764705882198547.8646.92450.9355 1.954659423198651.4550.2113 1.2387 2.407580175198755.653.7283 1.8717 3.366366906198860.1457.4916 2.6484 4.403724643198964.8261.5186 3.3014 5.093181117199068.6565.8276 2.8224 4.111289148199173.2270.4385 2.7815 3.798825458199280.2275.3723 4.8477 6.043006731199387.6980.65177.03838.026342798199493.9786.30087.66928.161328083199599.1692.3457 6.8143 6.872025011996103.3898.814 4.566 4.4167150321997109.46105.7354 3.7246 3.4027041841998114.6113.1415 1.4585 1.2726876091999119.85121.0664-1.2164 1.0149353362000124.92129.5464-4.6264 3.7034902342001132.04138.6204-6.5804 4.9836413212002139.45148.33-8.886.367873792003150.93158.7196-7.7896 5.1610680452004165.13169.837-4.707 2.8504814392005181.93181.73310.19690.108228442006196.83194.4625 2.3675 1.2028146122007212.38208.0835 4.2965 2.0230247672008228.07222.6585 5.4115 2.3727364412009241.45238.2545 3.1955 1.3234624152010251.03254.9428-3.9128 1.558698164 Table1the N umber of E stimated P opulationopulation,,Its R esidual E rror and R elative E rrorIt is seen from Table1,the actual population and estimated population are quite close and the absolute relative error is within9%.we can conclude that the model is reliable,efficient and accurate.Through the model to calculate the predictive value of2011-2020,we obtain the following table:Table2the predictive value of2011-2020Year20112012201320142015Predictive value(10000)272.8001291.9082312.3547334.2333357.6444Year20162017201820192020Predictive value(10000)382.6954409.501438.1842468.8765501.71865.1.2the Prediction M odel of the Non-registered P opulationFirst,we analyze in the non-registered population data in Shenzhen city from 1979to2010.The results are shown the flowing Figure1:Figure 1the Trend of the Non-registered P opulationFrom the Figure one ,we can arrival at a conclusion that the non-registered population increased with second-degree curve from 1979to 2010.Meanwhile ,cubic exponential smoothing method can be used to predicted the the trend of the non-registered population from 2011to 2020.Exponential smoothing method is a time sequence ,which based on the analysis and prediction means,in the moving average method.With some time series prediction model of certain phenomena in the future prediction ,it is calculated by exponential smoothing value.Its principle is exponential smoothing any period values are the actual observed and previous period of exponential smoothing weighted average.The forecasting model of cubic exponential smoothing method are shown as follows:],...2,1,2=++=+∧T T c T b a y t t t T t (3)of which⎪⎪⎪⎪⎩⎪⎪⎪⎪⎨⎧+−−=−+−−−−=+−=]2[)1(2])34()45(2)56[()1(233)3()2()1(22)3()2()1(2)3()2()1(t t tt t t t t t t t tS S S c S S S b S S S a ααααααα(4)Where )(k t S is smoothing value with an index of k and α(10<<α)is the weighted coefficient.Here α=0.4,i nitial value ,55.13321)0(3)0(2)0(1=++===y y y S S S .We can gain )1(t S ,)2(t S ,(By Appendix 1).Moreover ,we can get the values asfollows:)3(t S 7867.743)1(32=S ,4296.705)2(32=S ,7718.668)3(32=S .When t=32,from the formula (3),32a ,32b ,32c can be calculated :783.843132=a ,28.214732=b ,0.377632=c ;Therefore,the prediction model is:2113776.02147.288431.783T T y T ++=+∧(5)here t=11.This model can be forecast the number of the the non-registered population from 2011to 2020.As is shown in Table 3:Table 3the n on-on-registeredregistered p opulation from 2011to 2020Year 20112012201320142015Predictivevalue value(10000)(10000)812.43841.78871.88902.74934.35Year 20162017201820192020Predictivevalue value(10000)(10000)966.72999.841033.71068.41103.8When T=3,we took the formula (4)into the prediction model of formula (3).Then:)3(2)2(2)1(221)1(1)1(3)1(33tt tt S S S y αααααα−+−−−−+−=+∧(6)To gain the prediction value ,taking t(from 0to 32)into formula (6).The fitted resultcan be seen in Figure 2:Figure 2Seen from figure 2,the forecasting value basically agrees with the actual value.Therefore,we can predict the number of the Non-registered population.5.1.3t he D evelopment T rend of P opulation S tructureIn order to predict the development trend of Shenzhen population structure,we listed the population age distribution of Shenzhen city according to Annex2,3,4.As shown in the following table:According to the data from the table,we can see the population age structure and sex structure data is only in 2000,2005and 2010,and the interval is 5years.So we can predict the population structure model in 2015and 2020by using the gray prediction theory.In the process of establishing the gray model,we put the data of 32years as the initial sequence:))3(),2(),1((0000x x x x =(7)So we can get )(k λ:)()1(00k x k x k −=λ(8)Checking and calculating of ratio values to test whether they are in ),(2212++−n n e e ,if not,we need to take sequence x (0)to do the necessary transformation to fall into the admissible covering interval .To seek the proper constant C and translation transform:nk c k x k y ,...,2,1,)()(00=+=(9)Frist ,to make the accumulated generating operation (AGO)gain the sequence :)]3()2(),2()1(),1([)]2(),2(),1([)0()1()0()1()1()1()1()1()1(x x x x x x x x x ++==(10)Of which )3,2,1)(()(10)1(==∑=k i x k x ki .3,2),1(5.0)(5.0)()1()1()1(=−+=k k x k x k z (11)Figure3From the Figure3,the change of population and beds is linear on the whole.The population growth faster during1991-2003,while the level of medical development is relatively stable.Especially in the past ten years and the population is linear growth basically.By the MATLAB,the data is used to do quadratic fit in nearly ten years,we can conclude the Figure4:Figure 4According to Figure 4,we can calculate that the parameter is 0.0036and -1.4815.Then ,equations can be obtained:()134815.10036.0)(−=n n y By Formula (13),we can calculate the number of the corresponding pared with the actual data,the relative error is shown as following:Figure5R elative E rror of E stimated V alue and A ctual V alue During2000-2010From Figure5,the relative error of estimated value and actual value is almost within0.1,indicating that the prediction equation can simulate the change trend of hospital beds accurately.Therefore the development trend of beds can be predicted 2011-2020in the Shenzhen city,as is shown the follows in the Table7:Table7t he D evelopment Trend of B eds During2010-2020Year20112012201320142015 Predictivevalue(1042455826316281503006332059person)Year20162017201820192020Predictive3414236317385864095843434person)value(104The population distribution of Shenzhen city in2000and2010the district is shown in Figure6and Figure7:Figure6the P roportion of P opulation D istribution in2020000Figure7the P roportion of P opulation D istribution in2010See from Figure 6and Figure 7,the population distribution changes in the proportion of the district is very little in 10years.So we can assume that the population distribution of Shenzhen District remained basically unchanged within ten years ,then the proportion of the population is shown in Table 8:Table 8the P roportion of the P opulation in 2010in Shenzhen City Luohu Distric tFutian District Nan-sh an District Baoan District Long-g ang District Yanhu District ,Guang ming New District Ping-sh an New District K(i)0.090.130.110.390.190.020.050.02The bed demand of each area:)(*)()(i Q i K i q =,here q is the need of beds each area,K(i)isthe proportionof the population in 2010in Shenzhen city,Q(i)is the bed need of Shenzhen and the variable i representing the year.By calculating,we can get the following Table 9:Table 9the Bed Demand Prediction of Each AreaLuohu DistrictFutian District Nan-sha n District Baoan District LonggangDistrictYanhuDistrictGuangm ing New District Ping-sha n New District k(i)0.080.1270.1050.3880.1940.020.0460.032011196431182578952847644911129736201221053342276310210510552612107892013225235752955109225461563129484420142405381831561166458326011382901201525644071336612438.8621964114749612016273143363584132476623682157010242017290546123813140907045726167010892018308649004051149717485771177411572019327652014300158917945819188412282020347455164560168528426868199713035.2the A nalysis of B eds D emand According to D ifferent D isease 5.2.1Infantile PneumoniaInfantile pneumonia is a common clinical disease ;it is easy to occur in four seasons ,especially in winter and spring.If it is not treated thoroughly,easy to repeated attacks and affecting the child's development normally.According to the Shenzhen City Health Bureau of Health Statistics Yearbook from 2001to 2010,the prevalence rate of different years are listed in the following T able 9:T able 9.The prevalence rate and the duration of hospitalization with i nfantilepneumoniaYear 2001200220032004200520062007200820092010P revalenc e rate (%)0.08970.08120.06950.07190.06290.05190.04020.04020.0310.03D uration of hospitalization ation(day (day )6666676667It can be seen from Table 9,along with the modern medical technology improving,the prevalence rate of infantile pneumonia is falling.As stated in 5-1-3,Checking and calculating of ratio values,we can know that they are in ()9680.9666,1.2.Thus we can use the gray model GM (1,1).UsingMATLAB software,the parameters can be obtained.The absolute value of the relative error between the estimated value and the actual value is:Figure 8The absolute value of the relative errorAs you can see from figure 8,the relative error is rather small,so we can estimate the future incidence rate using this model.By this model,we can get the prevalence rate was 0.0163and 0.0087in 2015and 2020.According to table 6,we can get the number of infantile pneumonia were 10529and 8773.5.2.2senile cataractAccording to theShenzhen City Health Bureau of Health Statistics Yearbook in 2001-2010,the prevalence rate of different years are listed in the following table 10:rate rate(%)(%)D uratio n of hospital ization ization((day)444443 2.7Along with the development of Shenzhen City,senile cataract prevalence is increasing year by year from the data in table 10.Then,we predicted the senile cataract prevalence by the cubic exponential smoothing method,and verify the correctness of the model.Moreover,we work out the relative error of the senile cataract prevalence between estimation value and the actual value ,as shown in the following table F igure 8:F igure 8the relative error of the senile cataract prevalenceFrom the table we can see ,owing to having the smaller relative errors between model value and real value,so it is a reasonable model.By using this mode,lwe can estimate the prevalence rate ,and then get that the prevalence rate is 0.00361and 0.01433.According to table 6,the number of old people who suffering from senile cataract were 4394and 29262.5.2.3B ed demand of different type types s hospital According to the statistical yearbook of 2011medical institutions of various kindsvisits and inpatients in Shenzhen city ,health agencies can be divided for the hospital,nursing homes,clinics and so on 。
CTC08录用论文清单:

CTC08录用论文清单:95 Regular papers + 40 Post-papers1. 会议报告论文 (Regular papers)ID Author Title Organization Topic 2郭建, 韩俊刚基于PSL的FIFO的验证西安电子科技大学设计验证5侯学彦 A Novel Low Power BIST for Scan Based Circuits Department of Microelctronics of Xi’anJiao Tong University数字测试12曾彬,张大方,黎文伟,谢高岗WPathload:一种改进的可用带宽测量方法研究湖南大学计算机与通信学院,湖南长沙410082容错技术14田力,金敏一种提高多存储单元内建自测试效率的电路设计英飞凌科技西安有限公司数字测试15白晓,余梅生一种对Pedersen的可验证秘密共享的改进方案燕山大学信息科学与工程学院容错技术16张玉怀,张玉兴电子产品的EMI控制策略论述电子科技大学电子工程学院AMS测试17田文杰,刘继承,艾兰基于蚁群神经网络的设备故障诊断北京联合大学自动化学院容错技术18邵晶波,马光胜,杨志,张瑞雪基于进程代数的SoC测试调度哈尔滨工程大学计算机科学与技术学院数字测试20姜岩峰,张晓波,黄绍起数字电视信道解调解码芯片内嵌式模数转换器的验证测试北方工业大学微电子中心AMS测试21骆昊,曾华燊分布式多点并发测试系统的设计与实现西南交通大学信息科学与技术学院软件测试24程伟,崔小乐基于蚁群算法的SoC测试壳和测试访问机制联合优化北京大学深圳研究生院集成微系统科学工程与应用重点实验室数字测试32薛彦红,吴金,张亮具有二次特性的斜坡补偿电路的设计东南大学集成电路学院南京 210096AMS测试33田俊峰,陈小祥,刘涛一种基于半环理论的可信性评估模型河北大学数学与计算机学院河北保定071002容错技术36柳永坡,刘雪梅,张懋测试流程管理与监控技术的研究与实现北京航空航天大学计算机学院,北京100083软件测试37骆祖莹电热分析及其对测试的影响北京师范大学信息科学与技术学院,北京100875数字测试38Song Yan-yan Zuo De-cheng YangXiao-zong Cui GangFault Tolerant Routing Protocol in WirelessSensor NetworksSchool of Computer Science andTechnology, Harbin Institute ofTechnology, Hei Long Jiang, Harbin150001容错技术39HU Mei (胡梅), WANG Hong (王红), YANG Shiyuan (杨士元) , CHENZhenmao (陈正茂)Linear Relativity among Node-Voltage Incrementsand Its Application in Soft Fault Diagnosis ofAnalog CircuitsDepartment of Automation, TsinghuaUniversity, Beijing 100084, ChinaAMS测试40裴慧卿,张秋实*,宋超,余瑛,高金山基于MSP430的手持式LCR数字电桥的设计与实现北京交通大学 100044 北京ATE应用41赵会群,赵洁,王恩雷基于TTCN-3的SIP协议一致性测试方法研究北方工业大学信息工程学院,北京100041软件测试42刘向玲余梅生多层Ad hoc网络中基于身份的密钥管理方案燕山大学信息科学与工程学院秦皇岛066004容错技术43卓红艳可靠性指标分配方法研究中国工程物理研究院应用电子学研究所四川绵阳919-1011信箱621900容错技术44赵会群, 王恩雷,赵洁一种TTCN-3测试套自动转化为编码解码器的方法研究及应用北方工业大学信息工程学院, 北京 100041软件测试45江燕辉,张金艺,林峰,王佳多时钟域SOC的TAM优化与测试调度上海大学微电子中心数字测试46葛樑应对RF SOC/SIP量产测试挑战惠瑞捷半导体(上海)有限公司AMS测试47Xing Jie, Wang Mingxiang New Architecture in flash memory testing toachieve throughput enhancementSpansion China Limited, No33 Xing HaiStreet, SIP Suzhou, 215021数字测试48梁伟毕经平Internet路由关联分析与监测系统设计中国科学院计算技术研究所软件测试49张颖 李华伟 李晓维SOC总线串扰的精简MT测试集中国科学院计算技术研究所计算机系统结构重点实验室数字测试50苏志勇李必信基于体系结构的Web服务可靠性建模东南大学计算机科学与工程学院,南京210096容错技术51周志远, 张大方, 缪力,赵丹,黄谷基于Java内存模型的并发程序模型检测湖南大学软件学院,湖南长沙,410082软件测试53Qi Tang Design for Load Regulation Production Test ofPMIC devicesVerigy (Shanghai) Co., Ltd数字测试54李华叶新铭吴承勇王龙王玲玲一种互操作测试的建模及测试选择方法内蒙古大学,计算机学院,呼和浩特市010021软件测试55Lu Ming The Optimized Test Solution for Mass Productionof High-performanceVerigy (Shanghai) Co., Ltd Shanghai201203AMS测试56刘炎华景为平孙玲一种传感器信号处理电路测试方法研究南通大学江苏省专用集成电路设计重点实验室,江苏南通 226019AMS测试57蒋方纯基于覆盖率的组合测试在游戏软件测试中的应用与分析深圳信息职业技术学院,广东深圳518029软件测试58付剑平陆民燕软件测试性设计综述北京航空航天大学工程系统工程系, 北京100083软件测试59张德平,聂长海,徐宝文划分测试用例选择策略研究东南大学计算机科学与工程学院,江苏南京 210096软件测试60李伟,王志功,李智群S参数测试校准技术中SOLT和TRL校准方法的比较东南大学射频与光电集成电路研究所,南京市四牌楼2号,210096AMS测试61崔江,王友仁基于DAGSVC的模拟软故障字典诊断方法南京航空航天大学自动化学院,江苏南京,210016AMS测试62欧阳思华,吴锦,李艳奎,刘新宇基于Agilent VEE的HEMT器件直流自动化测试系统中国科学院微电子研究所ATE应用64刘炜石志刚张琳FM发射芯片测试技术研究北京华大泰思特半导体检测技术有限公司ATE应用65张岩峰,王和兴,王翠荣,高远基于虚拟化技术的网络测试床的设计与实现东北大学秦皇岛分校,秦皇岛 066004软件测试66黄正峰梁华国陈田詹文法孙科一种容软错误的高可靠BIST结构合肥工业大学计算机与信息学院合肥230009数字测试67王佳李华叶新铭杭成宝基于NTP协议的时间同步服务的测试设计与实现内蒙古大学计算机学院呼和浩特市010021软件测试68吴为民基于二元CSP的RTL数据通路可满足性求解方法北京交通大学计算机与信息技术学院,北京,100044设计验证71鲍国民郑成文韩柯软件可靠性J—M模型的改进研究中国人民解放军通信指挥学院研究生管理大队软件测试72鲍国民聂剑平韩柯基于未确知理论的软件可靠性模型研究中国人民解放军通信指挥学院研究生管理大队软件测试73于磊,傅常顺基于度量的软件测试过程管理解放军信息工程大学信息工程学院,河南郑州,450002软件测试74张悦尤枫赵瑞莲利用蚁群算法实现基于程序结构的主变元分析北京化工大学信息科学与技术学院北京100029软件测试75李征, 赵瑞莲基于领域的程序切片准则的依赖性分析北京化工大学计算机科学系北京 100029软件测试77李光辉冯冬芹曾松伟基于拓扑结构分析的等价性验证方法浙江林学院信息工程学院杭州 311300设计验证78Kent Luehman, Yin Kun Interesting Applications of Digital Source andDigital CaptureVerigy ATE应用80王雅文宫云战肖庆杨朝红区间运算在软件缺陷检测中的应用北京邮电大学网络与交换技术国家重点实验室软件测试81吴子敬宫云战基于区间运算和组测试求解CSP以及在测试用例自动生成上的应用北京邮电大学计算机科学与技术交换与智能控制国家重点实验室软件测试83江标宫云战杨朝红非法计算检测的通用模型北京邮电大学网络与交换技术国家重点实验室软件测试84李春明代码风格所引起形式验证失配问题的分析江南计算技术研究所设计验证86Shu Xia, Xiu-Lan Cheng VLSI Test Education for University Students inChinaApplications Development Center,Teradyne (Shanghai) Co., Ltd.数字测试90周旭顾卫标倪红军朱昱电磁辐射接收机低频段全数字化设计南通大学,江苏南通 226019AMS测试91刘健,闫伟LED器件热阻测试仪的研制中国电子科技集团公司第十三研究所,石家庄 050051ATE应用92Kun Xiao,shihong Chen,Jian Xiao基于顺序图的面向方面动态编织测试School of Computer, Wuhan University软件测试93莫毓昌, 刘宏伟, 左德承, 杨孝宗FTCL: 面向Statechart描述的测试用例集自动生成工具计算机科学与技术学院, 哈尔滨工业大学软件测试94张广梅李劲松基于随机测试的软件可靠性评估山东农业大学信息科学与工程学院软件测试95潘送军胡瑜李晓维多核处理器瞬态故障敏感性分析中国科学院计算机系统结构重点实验室容错技术96Dong Xiang Boxue Yin Zhen Chen Conflict-Avoidance-Driven Test Generation andTest Point Insertionfor Transition Faults in Broadside Scan TestingTsinghua University数字测试97邝继顺刘钦尤志强由被测电路自己产生测试向量的“自动测试向量生成湖南大学计算机与通信学院数字测试99张旻晋李华伟李晓维面向最大串扰噪声的测试生成方法中国科学院计算技术研究所数字测试100Tongdan Jin, Shu Xia, Xiu-LanChengManaging ATE Maintenance to Reduce DeviceTesting CostTexas A&M International University ATE应用101王保青,梁华国,詹文法组扩展编码在测试数据压缩中的应用合肥工业大学计算机与信息学院数字测试103戈倩,高建华一种定位面向对象软件中回归测试错误的方法上海师范大学数理信息学院计算机与工程系软件测试104李明明关于串行A/D转换器静态参数测试技术的研究北京微电子技术研究所北京市丰台区东高地四营门北路2号AMS测试105谢远江,王达,胡瑜,李晓维用CAM作为冗余单元提高存储器修复率的内建自修复机制中国科学院计算技术研究所系统结构重点实验室容错技术107马明朗DAC静态参数测试技术研究中国航天时代电子公司北京微电子技术研究所AMS测试108张涛DIB design rules for testability and reliability Teradyne (Shanghai) Co., Ltd ATE应用110王之韡,高建华一种基于修改影响分析方法的错误定位技术上海师范大学计算机科学与工程系软件测试111刘亚飞,尚利宏容错CAN总线测试平台的研究和实现北京航空航天大学601教研室容错技术112周彬叶以正王志伟基于TRC重播种的二维测试数据压缩哈尔滨工业大学微电子中心数字测试116曹贝肖立伊王永生基于非一致CA的低功耗确定测试向量发生器的设计哈尔滨工业大学微电子中心数字测试117付斌章韩银和李华伟李晓维针对基于片上网络(NoC)的芯片的单向虚拟测试总线中国科学院计算技术研究所系统结构重点实验室数字测试118成永升,尤志强,邝继顺扩展相容性扫描树中的测试响应压缩器设计湖南大学计算机与通信学院数字测试120贺志容韩红星胡勇93K集成电路测试系统参考源校准方法研究武汉数字工程研究所ATE应用121靳昂,江建慧Java程序故障模式及故障注入方案同济大学计算机科学与技术系软件测试122王达,胡瑜,李晓维Flash存储器测试与修复方法概述中国科学院计算技术研究所系统结构重点实验室容错技术123王飞胡瑜李晓维一种确定性扫描链故障诊断向量的生成方法中国科学院计算技术研究所计算机系统结构重点实验室数字测试125王天成,吕涛,李晓维RTL错误注入的方法和实现中国科学院计算机系统结构重点实验室设计验证126张蕊江建慧楼俊钢沈君华王艳娜钱逢安基于B/S结构的嵌入式软件和系统测试平台同济大学计算机科学与技术系软件测试127蒙喜鹏 林建京一种以应用为导向的非接触射频卡芯片的全新测试方法北京微电子技术研究所ATE应用128刘品谢永乐LOT滤波器组在模拟集成电路故障诊断中的应用电子科技大学自动化工程学院AMS测试129褚彦明,朱经纷软件复杂度的评估和实现上海大学计算机工程与科学学院软件测试130李瑞麟大规模生产测试中的关键环节——连接性测试北京华大泰思特半导体检测技术有限公司ATE应用131施银盾,朱经纷软件可靠性模型综合量化分析上海大学计算机学院软件测试132张慧曲芳王剑超大规模集成电路测试开发技术及流程江南计算技术研究所ATE应用133曲芳陈冬林敏基于SAPPHIRE测试系统的VCD测试向量转换江南计算技术研究所ATE应用134陆晔蒋炎河张树文模拟锁相环解码器SE567测试实现江南计算技术研究所AMS测试135王剑陆晔张树文应用DOE提升大尺寸封装高速芯片的机测良率江南计算技术研究所ATE应用137史圣兵,靳洋,王红,牛道恒,杨士元行为级可测性综合平台综合模块的设计与实现清华大学自动化系数字测试138蒋翠云 梁华国 陶珏辉 陈田测试数据分块字典统计编码压缩法合肥工业大学理学院 合肥工业大学计算机与信息学院数字测试2. 会议张贴论文 (Post-papers)ID Author Title Organization Topic1张嘉怡, 刘建文, 伍川辉基于ZigBee的无线传感器网络在煤矿安全监测中的应用西南交通大学, 中科院成都计算机应用研究所(中科信息)容错技术3任继平, 王占武基于GJB 2725A的软件测试质量管理体系北京跟踪与通信技术研究所软件测试8高淼标准测试数据格式(STDF)文件的研究英飞凌科技有限公司邮编 710075ATE应用9何剑伟, 任继平, 王占武配置管理在软件测试项目中的应用中国卫星海上测控部(CSMTC),江苏省江阴市103信箱500号,214431软件测试10吉国凡, 王惠降低SOC芯片测试成本的有效方法北京华大泰思特特半导体检测技术有限公司ATE应用11潘振兴,谢涛一种低通信开销的DDoS异常检测模型国防科技大学计算机学院湖南长沙容错技术13王冠军,马光胜,聂东虎双阀值VLSI低测试功耗方法研究哈尔滨工程大学计算机科学与技术学院数字测试19于秀山,董昕Quick-Design在组合测试中的应用中国电子系统设备工程公司研究所软件测试22方建乾如何基于产品测试硬件进行IC高速接口时序特性参数测量英飞凌科技(西安)有限公司数字测试23甘泽洲一种支持自动化测试的测试管理工具的实现北京工业大学计算机学院软件测试25胡勇,吴丹,沈森祖,石坚基于Verigy 93000测试系统的存储器测试方法研究和实现武汉数字工程研究所ATE应用26葛先军,李志勇,宋巍巍基于网页恶意脚本链接分析的木马检测技术海军航空工程学院,山东烟台容错技术30钱军边界扫描技术在测试BS-NBS结构电路上的应用哈尔滨工业大学移动计算研究中心,哈尔滨150001数字测试31丁俊民孙玲刘炎华一种音频功率放大器测试方案设计南通大学,南通 226007AMS测试34洪继奎,刘军基于PKI和USB Key的网络信息系统安全认证研究解放军理工大学通信工程学院研究生一队;江苏南京;210007容错技术35李颖悟在系统级JTAG应用中识别单板类型的方法华为技术有限公司数字测试52张毅王鸿软件可靠性测试实例分析中物院总体工程研究所,四川绵阳919信箱402分箱,621900软件测试63张坚Detecting Opens in Fan-out Mode for FlashTestingVerigy (Shanghai) Co., Ltd.Shanghai 201203 P.R.China数字测试69廖明燕基于边界扫描的电路互联故障诊断研究中国石油大学信息与控制工程学院山东东营 257061数字测试70钱军,左德承,苗百利,杨孝宗基于JTAG的故障注入研究哈尔滨工业大学移动计算研究中心,哈尔滨150001数字测试76Tian-Junfeng,Chen-Xiaoxiang, LiuTaoA Trust Evaluation Model Based on SemiringInstitute of Computer NetworkTechnology, Hebei University, Baoding071002, China容错技术79刘玉林,李华基于UCM的组件集成测试方法内蒙古大学计算机学院,呼和浩特软件测试82白哥乐, 宫云战, 杨朝红基于源码分析的软件安全测试工具综述北京邮电大学网络与交换技术国家重点实验室软件测试85张小孟一种集成电路脉冲波峰值电压的测试方法北京微电子技术研究所北京100076ATE应用87周旭顾卫标倪红军朱昱EMC自动测试系统中光纤通信设计南通大学,江苏南通 226019ATE应用88周旭顾卫标倪红军朱昱主从式电磁辐射自动测试系统南通大学,江苏南通 226019ATE应用89周旭顾卫标倪红军朱昱高频传输室过渡接头内导体的形状优化设计南通大学,江苏南通 226019ATE应用98李鉴睿吴坚Introduction to Image Sensor Device Testing泰瑞达(上海)有限公司ATE应用102武晋南高建华基于User-Session的Web测试集简化方法上海师范大学计算机科学与工程系软件测试106史君浅析存储器的测试原理及方法时代民芯科技有限公司数字测试109刘文捷石坚微电子标准样片制备研究国防微电子一级站(中船重工第七0九数字测试113周彬叶以正李兆麟基于贪心行列消去算法的测试集优化哈尔滨工业大学微电子中心数字测试114翟志华单锦辉孙萍软件故障预防方法探讨黄河水利职业技术学院自动化工程系软件测试115王璇李泽民非法计算故障的检测方法研究装甲兵工程学院信息工程系软件测试119韩红星PCF8563芯片的测试程序开发研究武汉数字工程研究所数字测试124辛敏杰影响GUI自动化测试性能的因素分析上海师范大学计算机科学与技术系软件测试136刘恕NAND Flash的ECC分级及其在ATE设备中的测试方法爱德万测试(苏州有限公司)上海分公司数字测试139方南晖,叶卫东如何从流程上保证系统测试的质量中国南方航空公司信息中心软件测试140孙加兴,孟德刚数字软IP核评测与认证方法和流程信息产业部软件与集成电路促进中心数字测试141孟德刚,邱善勤,谢学军,孙加兴基于JTAG扫描链的嵌入式处理器IP核调试方法研究信息产业部软件与集成电路促进中心数字测试。
On Sequential Monte Carlo Sampling Methods for Bayesian Filtering
methods, see (Akashi et al., 1975)(Handschin et. al, 1969)(Handschin 1970)(Zaritskii et al., 1975). Possibly owing to the severe computational limitations of the time these Monte Carlo algorithms have been largely neglected until recently. In the late 80’s, massive increases in computational power allowed the rebirth of numerical integration methods for Bayesian filtering (Kitagawa 1987). Current research has now focused on MC integration methods, which have the great advantage of not being subject to the assumption of linearity or Gaussianity in the model, and relevant work includes (M¨ uller 1992)(West, 1993)(Gordon et al., 1993)(Kong et al., 1994)(Liu et al., 1998). The main objective of this article is to include in a unified framework many old and more recent algorithms proposed independently in a number of applied science areas. Both (Liu et al., 1998) and (Doucet, 1997) (Doucet, 1998) underline the central rˆ ole of sequential importance sampling in Bayesian filtering. However, contrary to (Liu et al., 1998) which emphasizes the use of hybrid schemes combining elements of importance sampling with Markov Chain Monte Carlo (MCMC), we focus here on computationally cheaper alternatives. We describe also how it is possible to improve current existing methods via Rao-Blackwellisation for a useful class of dynamic models. Finally, we show how to extend these methods to compute the prediction and fixed-interval smoothing distributions as well as the likelihood. The paper is organised as follows. In section 2, we briefly review the Bayesian filtering problem and classical Bayesian importance sampling is proposed for its solution. We then present a sequential version of this method which allows us to obtain a general recursive MC filter: the sequential importance sampling (SIS) filter. Under a criterion of minimum conditional variance of the importance weights, we obtain the optimal importance function for this method. Unfortunately, for numerous models of applied interest the optimal importance function leads to non-analytic importance weights, and hence we propose several suboptimal distributions and show how to obtain as special cases many of the algorithms presented in the literature. Firstly we consider local linearisation methods of either the state space model 3
Customer Value, Satisfaction, Loyalty, and Switching Costs An Illustration From a
Venkatesh Shankar
University of Maryland
M. Krishna Erramilli Bvsan Murthy
Nanyang Technological University
Although researchers and managers pay increasing attention to customer value, satisfaction, loyalty, and switching costs, not much is known about their interrelationships. Prior research has examined the relationships within subsets of these constructs, mainly in the business-toconsumer (B2C) environment. The authors extend prior research by developing a conceptual framework linking all of these constructs in a business-to-business (B2B ) service setting. On the basis of the cognition-affect-behavior model, the authors hypothesize that customer satisfaction mediates the relationship between customer value and customer loyalty, and that customer satisfaction and loyalty have significant reciprocal effects on each other. Furthermore, the potential interaction effect of satisfaction and switching costs, and the quadratic effect of satisfaction, on loyalty are explored. The authors test the hypotheses on data obtained from a courier service provider in a B2B context. The results support most of the hypotheses and, in particular, confirm the mediating role of customer satisfaction. Keywords: customer value; satisfaction; loyalty