High-resolution Melting Approachusing
高分辨率溶解曲线简介资料
高分辨率溶解曲线简介(2011-09-01 11:30:50)转载▼标签:杂谈高分辨率熔解曲线分析技术( High Resolution Melting ),简称 HRM ,是近年来兴起的一种检测基因突变、进行基因分型和SNP检测的新工具,可以迅速的检测出核酸片段中单碱基的突变。
HRM 技术因其速度快,操作简便,高通量,灵敏性特异性高,对样品无污染等优点而被迅速的应用在生命科学、医学、农学、畜牧业等领域的研究工作中。
其中,主要的研究方向集中在: 1 、基因未知突变以及 SNP 的扫描; 2、已知突变及 SNP 的基因分型; 3、动植物、微生物等物种的物种鉴定以及品种鉴定; 4 、法医鉴定、亲子鉴定; 5 、HLA 的配型; 6 、甲基化的研究等。
一、HRM技术的基本原理:HRM 技术主要是基于核酸分子物理性质的不同。
不同核酸分子的片段长短、 GC 含量、 GC 分布等是不同的,因此任何双链 DNA 分子在加热变性时都会有自己熔解曲线的形状和位置。
HRM 技术的基本原理就是根据熔解曲线的不同来对样品来进行区分。
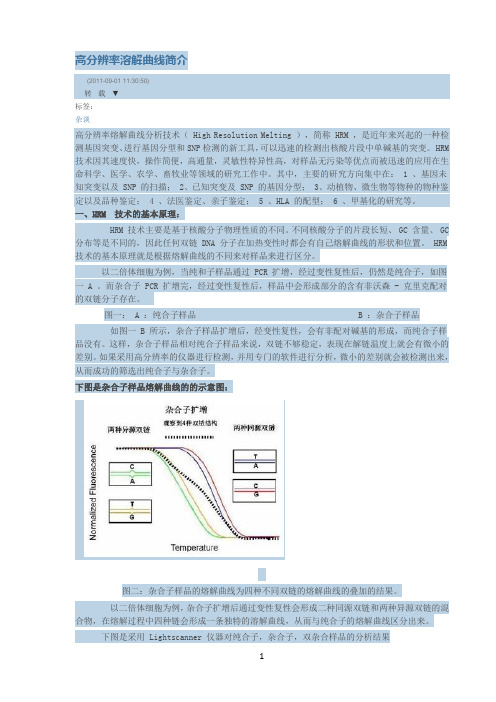
以二倍体细胞为例,当纯和子样品通过 PCR 扩增,经过变性复性后,仍然是纯合子,如图一 A 。
而杂合子 PCR 扩增完,经过变性复性后,样品中会形成部分的含有非沃森 - 克里克配对的双链分子存在。
图一: A :纯合子样品 B :杂合子样品如图一 B 所示,杂合子样品扩增后,经变性复性,会有非配对碱基的形成,而纯合子样品没有。
这样,杂合子样品相对纯合子样品来说,双链不够稳定,表现在解链温度上就会有微小的差别。
如果采用高分辨率的仪器进行检测,并用专门的软件进行分析,微小的差别就会被检测出来,从而成功的筛选出纯合子与杂合子。
下图是杂合子样品熔解曲线的的示意图:图二:杂合子样品的熔解曲线为四种不同双链的熔解曲线的叠加的结果。
以二倍体细胞为例,杂合子扩增后通过变性复性会形成二种同源双链和两种异源双链的混合物,在熔解过程中四种链会形成一条独特的溶解曲线,从而与纯合子的熔解曲线区分出来。
高分辨率熔解曲线技术常用的仪器和荧光染料
高分辨率熔解曲线技术常用的仪器和荧光染料郭心灵;尤崇革【摘要】高分辨率熔解曲线技术(HRM)是近年来发展迅速的一项用于基因突变扫描与检测的新技术.由于具备快速、简便、价廉、高通量和闭管均相检测等优点,HRM已被广泛地应用于突变基因的扫描、基因分型、遗传配型以及法医学鉴定等领域,并受到越来越多的关注且发展迅速.本文就该技术常规应用时的相关仪器与荧光染料的发展及应用进行分析总结.【期刊名称】《分子诊断与治疗杂志》【年(卷),期】2012(004)001【总页数】4页(P50-53)【关键词】高分辨率熔解曲线技术;聚合酶链反应;荧光染料;PCR仪【作者】郭心灵;尤崇革【作者单位】兰州大学第二医院中心实验室,甘肃,兰州730030;兰州大学第二医院中心实验室,甘肃,兰州730030【正文语种】中文高分辨率熔解曲线技术(high resolution melting,HRM)是美国Utah大学Wittwer实验室在2003年首次提出的基于新型饱和荧光染料LC Green的发明而进行基因突变检测的新技术[1]。
其基本原理就是利用与荧光染料结合的双链DNA 在温度升高的过程中会发生减色效应的物理性质,通过检测双链DNA在熔解过程中释放的染料荧光信号所形成的特征熔解曲线,进行PCR产物中核苷酸差异的鉴别。
该技术的应用不仅需要饱和荧光染料,而且更需要能进行高分辨检测的定量PCR仪。
近年来用于HRM技术的仪器和染料都在不断更新,朝着操作简便化、试剂专业化的方向发展,在常规检测、疾病诊断、实验室研究、前沿问题研究等方面发挥着重要作用[2,3]。
目前HRM技术可用于基因突变扫描、遗传配型、细菌分型和多重基因分型等领域[4,5]。
本文就HRM技术的常规开展所需要的相关仪器与荧光染料进行综述。
1 HRM仪器常规定量PCR仪由于温控不够灵敏、分辨率不够高及其熔解曲线无法区分熔解温度上差异很小的序列(如单核苷酸多态性、单碱基插入/缺失等),所以不能用于HRM分析。
hrm高分辨率溶解曲线实验流程
hrm高分辨率溶解曲线实验流程下载温馨提示:该文档是我店铺精心编制而成,希望大家下载以后,能够帮助大家解决实际的问题。
文档下载后可定制随意修改,请根据实际需要进行相应的调整和使用,谢谢!并且,本店铺为大家提供各种各样类型的实用资料,如教育随笔、日记赏析、句子摘抄、古诗大全、经典美文、话题作文、工作总结、词语解析、文案摘录、其他资料等等,如想了解不同资料格式和写法,敬请关注!Download tips: This document is carefully compiled by theeditor. I hope that after you download them,they can help yousolve practical problems. The document can be customized andmodified after downloading,please adjust and use it according toactual needs, thank you!In addition, our shop provides you with various types ofpractical materials,such as educational essays, diaryappreciation,sentence excerpts,ancient poems,classic articles,topic composition,work summary,word parsing,copy excerpts,other materials and so on,want to know different data formats andwriting methods,please pay attention!HRM(High Resolution Melting,高分辨率溶解)曲线分析是一种用于检测基因突变、单核苷酸多态性(SNPs)和基因重排等的技术。
高分辨溶解曲线突变检测
高分辨熔解曲线突变检测高分辨熔解曲线(High Resolution Melting)技术是近年来兴起的一种全新的突变扫描和基因分型的遗传分析方法。
HRM不受突变碱基位点与类型局限,无需序列特异性探针,在PCR结束后直接运行高分辨熔解,即可完成对样品的分析。
该方法与其他遗传分型技术相比具有灵敏度高、特异性好、成本低廉、高通量检测的优点,是进行突变检测的迅速、廉价而有效的方法。
HRM原理HRM是在PCR基础上通过测定DNA双链熔解曲线变化来检测突变的方法,溶解曲线的变化取决于DNA序列、长度、GC含量,因此,可以通过饱和燃料监控熔解曲线的变化来反映核酸性质的差异,从而对样品进行分析。
在双链体的溶解曲线检测时需要添加合适的染料,饱和染料例如SYBR Green 在双链解链过程中会发生重排,无法真实反映DNA熔解情况。
不适用于需低温解链的样品而且不能检测异源双链体。
因此不能用于熔解曲线的检测。
而LC Green (Idaho)是一种与DNA有更强的结合位点,对PCR抑制作用很小的饱和染料,已成功的用于HRM检测中。
HRM操作简便,在PCR结束后添加合适的染料,通过监测升温过程中荧光染料与PCR扩增产物的结合情况来实现的,在Lightscanner仪器(Idaho)升温过程中,双链解开,荧光染料从解链的分子上释放,同时荧光强度降低,所以通过荧光强度和曲线的变化上就可以判断是否存在突变。
HRM的特点和应用HRM应用:•检测人类疾病相关基因中常染色体的显隐性和X-连锁•鉴定人类肿瘤的体细胞突变,肿瘤样品中筛选体细胞突变•基因突变扫描:单碱基的改变、插入或缺失•特定突变、多态性位点的筛选•外显子和短扩增子基因型扫描HRM特点:•灵敏度高:杂合子突变体的检测的灵敏度可以达到100%,原则上数据分析时温度升高后纯合子或半合子的突变时检测不到的,但实际上,许多纯合子突变是可以检测到的。
如基因突变正好与x连锁,可以在PCR之前加入已知野生型样本来检测半合子或纯合子的突变。
hrm高分辨率溶解曲线
hrm高分辨率溶解曲线高分辨率溶解曲线(High-resolution Melting,简称HRM)是一种基于PCR技术的高灵敏度、快速检测和基因分型等应用的新兴方法。
它通过对PCR产物进行高温梯度退火,利用DNA序列中的单核苷酸多态性(Single Nucleotide Polymorphism,简称SNP)或突变等,可以对不同的DNA样本进行鉴别和分类。
HRM技术的原理是利用DNA双链在高温梯度环境下的失配特性。
在PCR反应中,经过一定的循环扩增过程,得到目标序列的大量复制品。
然后,通过控制扩增产物的温度、缓慢升温,逐渐增加其中的失配碱基数目,最终使DNA双链断裂解离。
同时,加入一种特定的DNA染料(例如SYBR Green),该染料能够与双链DNA结合并发光。
当溶解曲线进行扫描时,溶解温度越高,样品中的双链DNA越容易解离,染料释放的荧光信号越强。
而当双链DNA中存在SNP或突变时,会引起其中某一个区域的碱基配对发生改变,导致产物的熔解曲线发生改变。
根据熔解曲线的形状、峰型、峰面积等特征,可以判断样品中的SNP型态或突变类型,并进行分类鉴别。
HRM技术具有多个优点。
首先,HRM技术不需要引入特异性的探针或标记物,减少了实验操作的复杂性和成本。
其次,HRM技术具有高度灵敏性和准确性,能够鉴别并区分出少量变异的DNA样品,并且对于SNP的鉴定准确度高。
此外,HRM技术具有高通量、快速、操作简单等特点,适用于大规模基因分型和突变检测等实验。
HRM技术在药物研发、医学诊断和遗传学研究等领域有着广泛的应用。
例如,在药物研发中,可以通过HRM技术对候选靶点进行筛选,评估药物的安全性和有效性。
在医学诊断中,HRM技术可以应用于肿瘤的分型和突变检测,早期发现和预测疾病的风险。
在遗传学研究中,HRM技术可以用于亲子鉴定、人群遗传学调查和基因组学研究等方面。
尽管HRM技术具有许多优点和应用前景,但也存在一些局限性。
Bar-HRM技术在人参和西洋参药材鉴定中的应用研究
Bar-HRM技术在人参和西洋参药材鉴定中的应用研究王志科;鲁放;熊超;孙伟;薛建平【摘要】目的:采用高分辨率熔解曲线技术(HRM),应用ITS2序列对人参和西洋参药材进行快速鉴别,为规范市场药材管理提供一个新的分子检测手段.方法:收集人参、西洋参以及购买人参商品粉末药材,提取DNA,选择ITS2作为鉴别序列.在HRM-PCR条件下,建立人参和西洋参的标准高分辨熔解曲线、熔解曲线模型并确定Tm 值;应用该方法检测市场随机收集的10份人参商品.结果:通过比较分析,人参和西洋参能够很好的区分开,10份人参商品粉末的高分辨熔解曲线、熔解曲线的峰形和Tm值均与人参相吻合,初步说明这10份人参商品都含有人参.进而将其PCR产物测序,以验证该结果.结论:Bar-HRM方法可简单、快速、高通量化和可视化的实现人参商品粉末药材的快速检测.【期刊名称】《世界科学技术-中医药现代化》【年(卷),期】2016(018)002【总页数】5页(P191-195)【关键词】高分辨熔解曲线;ITS2;人参;西洋参;分子鉴定;快速检测【作者】王志科;鲁放;熊超;孙伟;薛建平【作者单位】淮北师范大学生命科学学院淮北235000;中国中医科学院中药研究所北京100700;淮北师范大学生命科学学院淮北235000;中国中医科学院中药研究所北京100700;中国中医科学院中药研究所北京100700;中国中医科学院中药研究所北京100700;淮北师范大学生命科学学院淮北235000【正文语种】中文【中图分类】R282.5人参(Panax ginseng C. A. Meyer)和西洋参(P. quinquefolium Linn)均为五加科人参属植物的干燥根[1,2],皆系名贵药材,因补虚疗效显著,临床应用日趋广泛。
人参大补元气、复脉固脱、补脾益肺、生津、安神;西洋参补气养精、清热生津[3]。
二者的性状非常相似,市售粉末商品存在混伪[4];并且在粉末状态下,用传统的形态、分类学鉴定方法,很难将其性状区分开[5]。
hrm高分辨率溶解曲线
hrm高分辨率溶解曲线高分辨率溶解曲线(High-resolution melting curve)是一种广泛应用于基因分型、突变检测和SNP分析等领域的检测技术。
其基本原理是利用荧光染料与DNA双链结合,随着温度的升高,DNA双链会逐渐解旋,导致荧光强度的变化。
通过检测荧光信号的变化,可以获得一条关于温度的曲线,称为溶解曲线。
高分辨率溶解曲线分析的优势在于其高灵敏度和高分辨率。
它可以快速、准确地检测出不同DNA序列之间的差异,甚至能够区分相似度达到99.99%的DNA序列。
这使得高分辨率溶解曲线成为一种非常重要的基因分型和突变检测技术。
高分辨率溶解曲线的操作相对简单,通常包括以下几个步骤:1.样品准备:从生物样本中提取DNA,并进行纯化和扩增,以获得足够的DNA量。
2. PCR扩增:选择适当的引物,进行PCR反应,扩增目标DNA片段。
3.荧光染料加入:在PCR反应结束时,将荧光染料加入PCR体系中。
荧光染料可以与双链DNA结合,从而产生荧光信号。
4.温度梯度扫描:利用PCR仪器进行温度梯度扫描。
通过逐渐升高温度,将DNA片段逐渐解旋,并观察荧光信号的变化。
5.数据分析:通过对荧光信号进行分析,可以得到一条溶解曲线。
根据曲线的形状和荧光峰值的位置,可以判断样品中的DNA序列。
高分辨率溶解曲线的分析可以被广泛应用于许多领域,例如基因分型、突变检测、SNP分析等。
在基因分型中,通过对多个基因位点的高分辨率溶解曲线进行分析,可以确定个体的基因型。
在突变检测中,溶解曲线的形状和荧光峰值的位置可以指示是否存在DNA序列的突变。
而SNP分析则是通过溶解曲线的变化来检测单核苷酸多态性。
除了上述应用之外,高分辨率溶解曲线还可以被用于测定DNA的荧光特性和结构特点。
通过观察溶解曲线的形状和荧光峰值的位置,可以获得DNA的熔解温度、熔解曲线宽度等信息,进而了解DNA序列的稳定性和结构特点。
总之,高分辨率溶解曲线是一种重要的基因分型和突变检测技术。
高分辨率熔解曲线分析:一种新的用于遗传病基因突变筛查的技术

高分辨率熔解曲线分析:一种新的用于遗传病基因突变筛查的技术李东至【摘要】@@ 目前,DNA碱基变异如突变或单核苷酸多态性(single nucleotide polymorplaism,SNP)的检测方法有2种:一是针对特定的位点合成序列特异性探针,如Taqman探针法、位点特异寡核苷酸分析、反向斑点杂交及基因芯片等,用于检测已知突变;二是以核酸的物理性质为基础的检测方法,如变性一高效液相层析、单链构象多态性、变性梯度凝胶电泳、温度梯度凝胶电泳及构象敏感凝胶电泳等,此类方法可用作突变筛查,但无法明确突变性质.【期刊名称】《中国产前诊断杂志(电子版)》【年(卷),期】2011(003)002【总页数】3页(P1-3)【作者】李东至【作者单位】广州市妇女儿童医疗中心,产前诊断中心,广东,广州,510623【正文语种】中文目前,DNA碱基变异如突变或单核苷酸多态性(single nucleotide polymorphism,SNP)的检测方法有2种:一是针对特定的位点合成序列特异性探针,如Taqman探针法、位点特异寡核苷酸分析、反向斑点杂交及基因芯片等,用于检测已知突变;二是以核酸的物理性质为基础的检测方法,如变性-高效液相层析、单链构象多态性、变性梯度凝胶电泳、温度梯度凝胶电泳及构象敏感凝胶电泳等,此类方法可用作突变筛查,但无法明确突变性质。
这2种方法在应用上有其局限性,如成本高、操作繁琐、耗时、以及相对低通量。
DNA测序是突变/SNP检测的金标准,但不适于大规模突变筛查和流行病学研究。
2002年犹他大学和爱德华科技公司合作开发出突变/SNP检测分析的一项新技术—高分辨率熔解曲线分析(high resolution melting,HRM)[1]。
这种技术不受突变碱基位点与类型的限制,可同时对扩增片段进行未知突变扫描和已知突变的基因分型。
因其操作简便、快速、高通量、低成本和真正实现了闭管操作而受到普遍的关注,成为近年来兴起的一种高通量突变扫描和基因分型技术。
- 1、下载文档前请自行甄别文档内容的完整性,平台不提供额外的编辑、内容补充、找答案等附加服务。
- 2、"仅部分预览"的文档,不可在线预览部分如存在完整性等问题,可反馈申请退款(可完整预览的文档不适用该条件!)。
- 3、如文档侵犯您的权益,请联系客服反馈,我们会尽快为您处理(人工客服工作时间:9:00-18:30)。
Journal of Integrative Plant Biology 2010,52(12):1036–1042New TechnologyA Cost-effective High-resolution Melting Approach using the EvaGreen Dye for DNA Polymorphism Detection and Genotyping in PlantsYi-Dan Li 1,Zhi-Zhan Chu 3,Xiang-Guo Liu 1,Hai-Chun Jing 2,Yao-Guang Liu 3∗and Dong-Yun Hao 1∗1BiotechnologyResearch Centre,Jilin Academy of Agricultural Sciences,Changchun 130033,China 2Institute of Botany,the Chinese Academy of Sciences,Beijing 100093,China3College of Life Sciences,South China Agricultural University,Guangzhou 510642,China ∗Corresponding authorsTel:+8643187063195;Fax:+8643187063080;E-mail:dyhao@ Tel:+862085281908;Fax:+862085282180;E-mail:ygliu@Available online on 5October 2010at and /journal/jipb doi:10.1111/j.1744-7909.2010.01001.xAbstractHigh-resolution melting (HRM)analysis relies on the use of fluorescent dyes,such as LCGreen,ResoLight,and SYTO9,which bind in a saturated manner to the double-stranded DNAs.These dyes are expensive in use and may not be affordable when dealing with a large quantity of samples.EvaGreen is a much cheaper DNA helix intercalating dye and has been used in quantitative real-time polymerase chain reaction (PCR)and post-PCR DNA melt curve analysis.Here we report on the development of an EvaGreen-based HRM analysis and its performance,in comparison with the popular LCGreen-based HRM analysis,in detection of DNA polymorphism in plants.We found that various polymorphisms ranged from single nucleotide polymorphisms (SNPs)to Indels were equally detected by using EvaGreen-or LCGreen-based HRM.EvaGreen dye was sensitive enough in discovery of SNPs in fivefold pooled ing this economical dye we successfully identified multiple novel mutant alleles of Gln1-3gene,which produces a cytosolic glutamine synthetase isoenzyme (GS1),in a maize ethyl methanesulfonate (EMS)-mutagenized library,and genotyped rice mapping populations with SNP markers.The current results suggest that EvaGreen is a promising dye for HRM analysis for its ease to use and cost effectiveness.Li YD,Chu ZZ,Liu XG,Jing HC,Liu YG,Hao DY (2010)A cost-effective high-resolution melting approach using the EvaGreen dye for DNA polymorphism detection and genotyping in plants.J.Integr.Plant Biol .52(12),1036–1042.IntroductionHigh-resolution melting (HRM)is a new generation of mutation scanning and genotyping technology (Wittwer et al.2003).The advantages of HRM include the high efficiency and labor-saving benefits.Since invented in 2003,this technology has been adopted in clinical chemistry,human pathology and plant sciences (White et al.2007;Croxford et al.2008;Wu et al.2008;Akiyama et al.2009;Dagar et al.2009;Hofinger et al.2009;Sun et al.2010;Ujino-Ihara et al.2010).Several HRM platformsare available from various manufacturers.The key to thistechnology is the use of special fluorescent dyes that can bind to double-stranded DNA in a saturated manner.Popular dyes in use include LCGreen/LCGreen Plus (Idaho Technology Inc.,Salt Lake City,UT,USA),ResoLight Dye (Roche Diagnostics Limited,Shanghai,China)and SYTO9(Invitrogen,Beijing,China),among which LCGreen and LCGreen Plus are by far the most widely used due to its high sensitivity,stability,reliability and compatibility with many popular HRM instruments (Caren et al.2006;Herrmann et al.2006).However,the high cost ofC2010Institute of Botany,Chinese Academy ofSciencesA Cost-effective HRM Approach using EvaGreen 1037these dyes often limits the application of this technology,in particular when dealing with a large number of samples.Eva-Green (Biotium Inc.,Hayward,CA,USA)is a newly developed and low-cost dye,and has been used in quantitative real-time polymerase chain reaction (PCR),post-PCR DNA melt curve analysis and several other applications (Ihrig et al.2006;Sang and Ren 2006;Wang et al.2006;White et al.2007;Akiyama et al.2009;Dagar et al.2009;Sun et al.2010;Ujino-Ihara et al.2010).It is also a so-called saturated dye that intercalates every single nucleotide of the double-stranded DNA.The objective of this paper was to examine whether EvaGreen can be used in HRM analysis as a reliable and economical approach for routine detection of DNA polymorphisms and genotyping in plants.ResultsDNA polymorphism detection in LightScanner RplatformLCGreen Plus (or LCGreen)was the manufacturer-recommended dye for HRM analysis using LightScanner.Weexamined the performance of EvaGreen as a substitute of LCGreen Plus in DNA polymorphism analysis.Three ampli-cons of approximately 300bp in length with known sequence polymorphisms in the maize Gln1-3gene,which producesaFigure parison of the high-resolution melting (HRM)assays using EvaGreen (left)and LCGreen (right).The HRM data are presented as two different parts:the top displays normalized melting curves for the tested amplicons,whereas the bottom shows difference curves displaying the difference in fluorescence ( F )of the amplicons in relation to the wild-type (WT).Amplicons containing single nucleotide polymorphisms (SNPs)or deletions and the wild-type samples used in the assay are color coded and are indicated inside the bottom graphs.The curves are also color coded according to the color of the amplicon.cytosolic glutamine synthetase isoenzyme (GS1)and plays an important role in grain development (Martin et al.2006),were selected.The aliquots of the same amplicons were analyzed using LCGreen Plus dye as the control.As shown in Figure 1,the normalized melting curves and the difference curves using EvaGreen were similar to those using LCGreen Plus.The am-plicons containing one single nucleotide polymorphism (SNP),two SNPs or 4nt deletion were clearly distinguished from the wild-type amplicons at F >0.05,a value that is considered to be significant in HRM analysis.Detection of nucleotide polymorphisms in pooled samplesThe pooling strategy is frequently used in mutation scanning to increase the efficiency whilst reducing costs.To examine the detection efficiency of EvaGreen in pooled samples,the above-mentioned mutant amplicons were mixed in various ratios with the corresponding wild-type amplicons.It can be seen from Figure 2that both EvaGreen and LCGreen HRM analyses showed a comparable performance.As expected,the 1:1(variant:wild-type)amplicon mixtures exhibited the highest difference curve peak.One SNP was also predictable in a 1:2(variant:wild-type)amplicon mixture (Figure 2).However,when the amplicon mixture ratio (variant:wild-type)was 1:3or higher,the F values became less than 0.05,indicating1038Journal of Integrative Plant Biology Vol.52No.122010Figure 2.High-resolution melting (HRM)assays using different mixing ratios of genomic DNAs of the variant and wild-type maize line as the templates.The HRM data are presented as graphs displaying the difference in florescence ( F )of the two different amplicons and wild-type amplicon mixtures in relation to the wild-type (WT).Each variant amplicon was mixed with a WT amplicon at a ratio of 1:1,1:2,1:3,or 1:5,respectively.that the prediction of one SNP was unreliable.For amplicons containing two SNPs,it was reliably detectable in a 1:1,1:2,1:3,or even 1:5(variant:wild-type)mixture.We could also detect the amplicon containing a 4nt deletion (Figure 2).Identification of novel variant alleles of the maize Gln1-3geneTo test the robustness and application of the EvaGreen-based HRM analysis,mutations in the Gln1-3gene in an ethyl methanesulfonate (EMS)-mutagenized maize popula-tions were screened.A total of 528M 2maize lines with defective grain development were selected from 8902maize M 1lines.Primers were designed to amplify four overlapping fragments of the gene for HRM analysis (Figure 3).In total 17mutations were predicted in 12maize lines and were confirmed by Sanger sequencing (Table 1).In addition to identifying various SNPs,a 1nt insertion and a 4nt deletion were found.Nine mutations appeared to be newly induced byEMS,showing the transition of G/C to A/T,as expected for the effects of EMS (Greene et al.2003).The other mutations were likely to be variants introduced by cross-pollination of the surrounding maize cultivars.Together,these results indicated that EvaGreen-based HRM analysis is efficient in detection of SNPs or other mutations when amplicons are around 300bp in length.EvaGreen-based HRM analysis for rice genotypingTo verify the use of EvaGreen-based HRM analysis for geno-typing,we genotyped rice lines with various polymorphic markers including SNPs,Indels and simple sequence repeats (SSR).The results showed that all of these molecular markers could clearly distinguish the genotypes of parental homozy-gotes and heterozygotes of F 2individuals in rice mapping populations.Figure 4shows examples of two markers with one and three SNPs in genotyping of an F 2population by EvaGreen-based HRM analyses.A Cost-effective HRM Approach using EvaGreen1039Figure 3.Schematic representation of the maize Gln1-3and detected nucleotide changes (top)showing the locations and sizes of polymerase chain reaction (PCR)amplicons (bottom).DiscussionThe present study demonstrated that EvaGreen was a satis-factory substitutive dye in LightScanner-based HRM analysis.Cross-platform comparison of instruments and dyes showed that LightScanner is an efficient and high throughput HRM platform,and the LCGreen Plus is a more efficient and sensitive dye for HRM analysis than ResoLight Dye,SYTO9and SYBR-Green (Caren et al.2006;Herrmann et al.2006).We found that in HRM analysis EvaGreen and LCGreen Plus performedTable 1.Summary of the high-resolution melting (HRM)results by using EvaGreen Lines Nucleotide change62538T >C182102G >C,2353G >A,2512A >T 632502insert A792480–24834-nt deletion 861821C >A,2522C >T 892504G >A 902533A >G1052353G >A,2504G >A 1651833C >A 1812513G >T 1832529G >A1842510G >C,2538T >Csimilarly in screening a range of DNA polymorphisms including SNPs,insertion and deletion.We also found that EvaGreen was even more sensitive in detection of the amplicon containing one SNP in pooled samples.The predictions of EvaGreen-based HRM analysis approached 100%accuracy when ampli-cons are around 300bp,which is an ideal size to identify DNA polymorphism in Lighscanner platform (Hofinger et al.2009).Hence,EvaGreen is an efficient,sensitive,and low-cost dye in detection of DNA polymorphism,genotyping and perhaps other applications.There are a few reports recently assessing the efficiency of different dye-based HRM analysis (White et al.2007;Ujino-Ihara et al.2010),in which EvaGreen was not used.However,these reports hardly described the running cost of this approach.In our laboratory,for example,the cost was estimated at approximately US $30per 96reactions (one plate)for HRM-PCR using LCGreen Plus and Master Mixture supplied by the vender in China.One way to reduce the cost would be to prepare the PCR reactions manually instead of using the Master Mixture kit.Still,the cost for LCGreen Plus alone would exceed US $15per 96reactions (one plate).Other dyes usable for HRM analysis are even more expensive than LCGreen Plus.Such a high cost limits the application of HRM technology for dealing with a large-number of samples in crop molecular breeding programs.In case of using EvaGreen;however,the running cost is only about 1/7or less than those of other dyes usable for HRM analysis,at about US $2per 96reactions.1040Journal of Integrative Plant Biology Vol.52No.122010Figure 4.Genotyping of rice F 2plants by EvaGreen high-resolution melting (HRM)with two single nucleotide polymorphism (SNP)markers (G/C >T/A variations).Top parts display normalized melting curves of the amplicons of 96F 2plants,of which the genotypes P1(ZS97A),P2(MH63),and heterozygote are identified.Bottom parts show derivative melting peaks of the same amplicons.In summary,EvaGreen is a competitive alternative for LCGreen Plus in HRM analysis.Shortly after this manuscript was first submitted,another report was published by Ujino-Ihara et al.(2010)that also describes the application of Eva-Green for HRM analysis of SNPs.At present,the EvaGreen HRM approach is routinely used in our laboratories.The EvaGreen-based HRM protocol described in this work may be adopted by other molecular biology and molecular breeding laboratories.Materials and MethodsPlant materialsMaize (Zea Mays cv.8902)pollen was mutagenized with EMS and applied to the silks of cv.8902ears (Okagaki et al.1991).Ears were harvested at 5–6weeks post pollination.M 1seeds were planted and a whole young leaf harvested from each plant for DNA sampling.An F 2population of rice was derived from a cross between two indica lines (ZS97A and MH63).Preparation of ampliconsFragments of the maize Gln1-3gene (GenBank:EU338535.1)was amplified by use of forward primer (position 2393)5 -AGTTCCAAGTCGGGCCTTCC-3 and reverse primer (po-sition2681)5 -TCCTCATCGACTCCGTGCTG-3 .Four ampli-cons derived respectively from three maize variants and maize cultivar Mo17were used in this study,including a single nucleotide polymorphism (SNP)mutant (A/T to G/C),a double-SNP mutant (A/T to G/C,G/C to T/A)and a 4nt deletion,together with a wild-type amplicon as the reference sample.Primer pairs of two rice SNP markers presented in Figure 4are (marker-1)5 -AGTAGCTTGGAATGGGCAGTAG-3 and 5 -CAGTCTCTTTCCATCCTGACAG-3 (for an 86-bp amplicon with 1SNP)and (marker-2)5 -GGTCTATTGATTA CAATGACATG-3 and 5 -CTCACATGGAGATTTGAATTCTT-3 (for an 86-bp amplicon with 3SNPs).PCR and HRM proceduresPCR amplifications using LCGreen Plus (Idaho Technology Inc.)were carried out in 10µL volumes containing 5µL HotShotA Cost-effective HRM Approach using EvaGreen1041Master Mix(Cadama Medical Ltd.,UK),1µL10×LCGreen Plus,1µL each5µM primer,and approximately50ng template DNAs of the maize parent or pooled mixture as the templates.In order to compare the detection effects,we mixed each mutant amplicon with the wild-type amplicon in different ratios,i.e.1:1, 1:2,1:3,and1:5.PCR amplifications using EvaGreen were carried out in10µL volumes containing5µL rTaq Premix(Takara-Bio,Dalian, China),0.5µL20×EvaGreen(Biotium Inc.),1µL each5µM primer,and approximately50ng(for maize)or approximately 10ng(for rice)template DNAs,including the pooled ones of maize.PCR reactions were performed using96well plates(Abgene, ),and the reactions were covered with15µL mineral oil.PCR profile for maize DNA samples was one cycle of 95◦C for5min,30cycles of95◦C for30s,64.2◦C for 30s,and72◦C for30s,one cycle of72◦C for10min, one cycle95◦C for30s,and then down to40◦C holding at the0.1◦C/s.PCR profile for rice genotyping was the same as above except that the re-nature temperature was62◦C. Subsequently,the PCR plates were subjected for HRM analysis in LightScanner(Idaho Technology Inc.).Mutation scanning analysis by HRM was done as described(Hofinger et al. 2009).AcknowledgementsThis work was supported by the Science Development Planning of Jilin Province(20086029),the Hi-Tech Research and Devel-opment Program of China(863Program2007AA102110),and the State Key Basic Research and Development Plan of China (973Program2005CB120802).Received17May2010Accepted24Sept.2010ReferencesAkiyama H,Nakamura F,Yamada C,Nakamura K,Nakajima O, Kawakami H,Harikai N,Furui S,Kitta K,Teshima R(2009)A screening method for the detection of the35S promoter and the nopaline synthase terminator in genetically modified organisms in a real-time multiplex polymerase chain reaction using high-resolution melting-curve analysis.Biol.Pharm.Bull.32,1824–1829.Caren H,Holmstrand A,Sjoberg RM,Martinsson T(2006)The two human homologues of yeast UFD2ubiquitination factor,UBE4A and UBE4B,are located in common neuroblastoma deletion regions and are subject to mutations in tumours.Eur.J.Cancer42,381–387.Croxford AE,Rogers T,Caligari PD,Wilkinson MJ(2008)High-resolution melt analysis to identify and map sequence-tagged site anchor points onto linkage maps:a white lupin(Lupinus albus)map as an exemplar.New Phytol.180,594–607.Dagar V,Chow CW,Ashley DM,Algar EM(2009)Rapid detection of SMARCB1sequence variation using high resolution melting.BMC Cancer9,437.Greene EA,Codomo CA,Taylor NE,Henikoff JG,Till BJ,Reynolds SH,Enns LC,Burtner C,Johnson JE,Odden AR,Comai L, Henikoff S(2003)Spectrum of chemically induced mutations froma large-scale reverse-genetic screen in Arabidopsis.Genetics164,731–740.Herrmann MG,Durtschi JD,Bromley LK,Wittwer CT,Voelkerding KV(2006)Amplicon DNA melting analysis for mutation scanning and genotyping:cross-platform comparison of instruments and dyes.Clin.Chem.52,494–503.Hofinger BJ,Jing HC,Hammond-Kosack KE,Kanyuka K(2009) High-resolution melting analysis of cDNA-derived PCR amplicons for rapid and cost-effective identification of novel alleles in barley.Theor.Appl.Genet.119,851–865.Ihrig J,Lill R,Muhlenhoff U(2006)Application of the DNA-specific dye EvaGreen for the routine quantification of DNA in microplates.Anal.Biochem.359,265–267.Martin A,Lee J,Kichey T,Gerentes D,Zivy M,Tatout C,Dubois F,Balliau T,Valot B,Davanture M,Terce-Laforgue T,Quillere I, Coque M,Gallais A,Gonzalez-Moro MB,Bethencourt L,Habash DZ,Lea PJ,Charcosset A,Perez P,Murigneux A,Sakakibara H, Edwards KJ,Hirel B(2006)Two cytosolic glutamine synthetase isoforms of maize are specifically involved in the control of grain production.Plant Cell18,3252–3274.Okagaki RJ,Neuffer MG,Wessler SR(1991)A deletion common to two independently derived waxy mutations of maize.Genetics128, 425–431.Sang F,Ren J(2006)Capillary electrophoresis of double-stranded DNA fragments using a newfluorescence intercalating dye Eva-Green.J.Sep.Sci.29,1275–1280.Sun H,Wang HT,Kwon WS,In JG,Lee BS,Yang DC(2010) Development of molecular markers for the determination of the new cultivar‘Chunpoong’in Panax ginseng C.A.MEYER associated with a major latex-like protein gene.Biol.Pharm.Bull.33,183–187.Ujino-Ihara T,Taguchi Y,Moriguchi Y,Tsumura Y(2010)An efficient method for developing SNP markers based on EST data combined with high resolution melting(HRM)analysis.BMC Res.Notes3,51. Wang W,Chen K,Xu C(2006)DNA quantification using Eva-Green and a real-time PCR instrument.Anal.Biochem.356,303–305.White HE,Hall VJ,Cross NC(2007)Methylation-sensitive high-resolution melting-curve analysis of the SNRPN gene as a diagnos-tic screen for Prader-Willi and Angelman syndromes.Clin.Chem.53,1960–1962.1042Journal of Integrative Plant Biology Vol.52No.122010Wittwer CT,Reed GH,Gundry CN,Vandersteen JG,Pryor RJ (2003)High-resolution genotyping by amplicon melting analysis using LCGreen.Clin.Chem.49,853–860.Wu SB,Wirthensohn MG,Hunt P,Gibson JP,Sedgley M(2008)High resolution melting analysis of almond SNPs derived from ESTs. Theor.Appl.Genet.118,1–14.(Co-Editor:Chun-Ming Liu)。