(相变化)qualifying exam_100114v2
考研词义辨析大全

考研词义辨析大全amplify, enlarge, stretch, magnify, reinforce, expandamplify v.扩大,增加,尤其指通过增强电压或电流使声音扩大;补充叙述(故事、事件等)。
We must ask you to amplify your statement.我们得请你对你的说法作进一步的说明。
enlarge v.扩大,多指具体物品如相片的放大。
enlarge photograph放大照片enlarge a house扩建房屋stretch v. (有弹性地)伸展,延伸,并有可能超过限度;伸长、伸出(身体某部位)并绷紧肌肉(尤指在放松后或为了够着某物)。
The pullover stretched after I had worn it a few times.这件套头毛衣我穿了几次之后就撑大了。
Having finished their morning work, the clerks stood up behind their desks, stretching themselves.完成了早间工作之后,职员们站到桌子后面伸伸懒腰。
magnify v.放大,指用透镜或显微镜使物体看上去大一些。
His eyeglasses magnify words so he canread them.他借助眼镜把字放大以便能够阅读。
reinforce v.增援,加固。
expand v.指范围、体积的扩大、增大,也可以指内容或细节的充实。
The balloon expanded, then exploded.气球先是膨胀,然后就爆破了。
anger, fury, indignation, resentment这一组名词都有"愤怒、生气"的意思。
anger n.气愤,生气,是一般用语。
After their argument, he expressed his anger by punching the other man in the face.争吵之后,他一拳打在那个人的脸上以发泄怒气。
An Analysis of States in the Phase Space From Quantum Mechanics to General Relativity

1
ABSTRACT The paper has euristic character. It exploits basic concepts of quantum physics to infer on a selfconsistent basis the properties of the gravitational field. The only assumption of the theoretical model is the quantum uncertainty: the physical properties of quantum systems depends on the delocalization ranges of the constituent particles and not on their local dynamical variables. The conceptual approach follows the same formalism already described in early non-relativistic papers [S. Tosto, Il Nuovo Cimento B, vol. 111, n.2, (1996) and S. Tosto, Il Nuovo Cimento D, vol. 18, n.12, (1996)]. The paper shows that the extended concept of space time uncertainty is inherently consistent with the postulates of special relativity and that the most significant results of general relativity are achieved as straightforward consequence of the space time delocalization of quantum particles.
Quantization of soliton systems and Langlands duality

arXiv:0705.2486v3 [math.QA] 9 Dec 2007
BORIS FEIGIN AND EDWARD FRENKEL Abstract. We consider the problem of quantization of classical soliton integrable systems, such as the KdV hierarchy, in the framework of a general formalism of Gaudin models associated to affine Kac–Moody algebras. Our experience with the Gaudin models associated to finite-dimensional simple Lie algebras suggests that the common eigenvalues of the mutually commuting quantum Hamiltonians in a model associated to an affine algebra b g should be encoded by affine opers associated to the Langlands dual affine algebra Lb g. This leads us to some concrete predictions for the spectra of the quantum Hamiltonians of the soliton systems. In particular, for the KdV system the corresponding affine opers may be expressed as Schr¨ odinger operators with spectral parameter, and our predictions in this case match those recently made by Bazhanov, Lukyanov and Zamolodchikov. This suggests that this the correspondence between quantum integrals of motion and differential operators may be viewed as special cases of the Langlands duality.
ò á êúD Y× × óò ú úD ò ìêì

C e n t r u m v o o r W i s k u n d e e n I n f o r m a t i c aPNAProbability, Networks and AlgorithmsProbability, Networks and AlgorithmsAn image retrieval system based on adaptive waveletliftingP.J. Oonincx, P.M. de ZeeuwR EPORT PNA-R0208 M ARCH 31, 2002CWI is the National Research Institute for Mathematics and Computer Science. It is sponsored by the Netherlands Organization for Scientific Research (NWO).CWI is a founding member of ERCIM, the European Research Consortium for Informatics and Mathematics. CWI's research has a theme-oriented structure and is grouped into four clusters. Listed below are the names of the clusters and in parentheses their acronyms.Probability, Networks and Algorithms (PNA)Software Engineering (SEN)Modelling, Analysis and Simulation (MAS)Information Systems (INS)Copyright © 2001, Stichting Centrum voor Wiskunde en InformaticaP.O. Box 94079, 1090 GB Amsterdam (NL)Kruislaan 413, 1098 SJ Amsterdam (NL)Telephone +31 20 592 9333Telefax +31 20 592 4199ISSN 1386-3711CWIP.O.Box94079,1090GB Amsterdam,The NetherlandsPatrick.Oonincx,Paul.de.Zeeuw@cwi.nl1.I NTRODUCTIONContent-based image retrieval(CBIR)is a widely used term to indicate the process of retrieving desired images from a large collection on the basis of features.The extraction process should be automatic(i.e. no human interference)and the features used for retrieval can be either primitive(color,shape,texture) or semantic(involving identity and meaning).In this paper we confine ourselves to grayscale images of objects against a background of texture.This class of images occurs for example in various databases created for the combat of crime:stolen objects[21],tyre tracks and shoe sole impressions[1].In this report we restrict ourselves to the following problem.Given an image of an object(a so-called query)we want to identify all images in a database which contain the same object irrespective of translation,rotation or re-sizing of the object,lighting conditions and the background texture.One of the most classical approaches to the problem of recognition of similar images is by the use of moment invariants[11].This method is based on calculating moments in both the-and-direction of the image density function up to a certain order.Hu[11]has shown that certain homogeneous polynomials of these moments can be used as statistical quantities that attain the same values for images that are of the same class,i.e.,that can be obtained by transforming one single original image(affine transforms and scaling).However,this method uses the fact that such images consists of a crisp object against a neutral background.If the background contains‘information’(noise,environment in a picture)the background should be the same for all images in one class and should also be obtained from one background using the same transformations.In general this will not be the case.The kind of databases we consider in this paper consists of classes of different objects pasted on different background textures.To deal with the problem of different backgrounds one may use somefiltering process as a preprocessing step.In Do et al.[7]the wavelet transform modulus maxima is used as such preprocessing step.To measure the(dis)similarity between images,moments of the set of maxima points are determined(per scale)and subsequently Hu’s invariants are computed.Thus,each image is indexed by a vector in the wavelet maxima moment space.By its construction,this vector predominantly represents shapes.In this report we propose to bring in adaptivity by using different waveletfilters for smooth and unsmooth parts of the image.Thefilters are used in the context of the(redundant)lifting scheme[18].The degree2of”smoothness”is determined by measuring the relative local variance(RLV),which indicates whether locally an image behaves smoothly or not.Near edges low order predictionfilters are activated which lead to large lifting detail coefficients along thin curves.At backgrounds of texture high order predictionfilters are activated which lead to negligible detail coefficients.Moments and subsequently moment invariants are computed with respect to these wavelet detail coefficients.With the computation of the detail coefficients a certain preprocessing is required to make the method robust for shifts over a non-integer number of gridpoints.Further we introduce the homogeneity condition which means that we demand a homogeneous change in the elements of a feature vector if the image seen as a density distribution is multiplied by a scalar.The report is organized as follows.In Sections2and3we discuss the lifting scheme and its adaptive version.Section4is devoted to the topic of affine invariances of the coefficients obtained from the lifting scheme.In Section5the method of moment invariants is recapitulated.The homogeneity condition is in-troduced which leads to a normalization.Furthermore,the mathematical consequences for the computation of moments of functions represented byfields of wavelet(detail)coefficients are investigated.Section6 discusses various aspects of thefinal retrieval algorithm,including possible metrics.Numerical results of the algorithm for a synthetic database are presented in Section7.Finally,some conclusions are drawn in Section8.2.T HE L IFTING S CHEMEThe lifting scheme as introduced by Sweldens in1997,see[18],is a method for constructing wavelet transforms that are not necessarily based on dilates and translates of one function.In fact the construction does not rely on the Fourier transform which makes it also suitable for functions on irregular grids.The transform also allows a fully in-place calculation,which means that no auxiliary memory is needed for the computations.The idea of lifting is based on splitting a given set of data into two subsets.In the one-dimensional case this can mean that starting with a signal the even and odd samples are collected into two new signals,i.e.,,where and,for all.The next step of the lifting scheme is to predict the value of given the sequence.This prediction uses a prediction operator acting on.The predicted value is subtracted from yielding a ‘detail’signal.An update of the odd samples is needed to avoid aliassing problems.This update is performed by adding to the sequence,with the update operator.The lifting procedure can also be seen as a2-bandfilter bank.This idea has been depicted in Figure1.The inverse lifting scheme can/.-,()*+/.-,()*+/.-,()*+/.-,()*+/.-,()*+Figure1:The lifting scheme:splitting,predicting,updating.immediately be found by undoing the prediction and update operators.In practice,this comes down in Figure1to simply changing each into a and vice versa.Compared to the traditional wavelet transform the sequence can be regarded as detail coefficients of the signal.The updated sequence can be regarded as the approximation of at a coarse ing again as input for the lifting scheme yields detail and approximation signals at lower resolution levels.We observe that every discrete wavelet transform can also be decomposed into a finite sequence of lifting steps[6].To understand the notion of vanishing moments in terms of the prediction and update operators,we com-pare the lifting scheme with a two-channelfilter bank with analysisfilters(lowpass)and(highpass) and synthesisfilters and.Such afilter bank has been depicted in Figure2.Traditionally we say that a389:;?>=<89:;?>=</.-,()*+89:;?>=<89:;?>=<Figure2:Classical2-band analysis/synthesisfilter bank.filter bank has primal and vanishing moments ifandwhere denotes the space of all polynomial sequences of order.Given thefilter operators and, the correspondingfilters and can be computed by(2.1)(2.2)where and denote thefilter sequences of the operators and respectively.In[12]Kovacevic and Sweldens showed that we can always use lifting schemes with primal vanishing moments and dual vanishing moments by taking for a Nevillefilter of order with a shift and for half the adjoint of a Nevillefilter of order and shift,see[17].Example2.1We take and.With these operators we getThefilter bank has only one vanishing moment.The lifting transform corresponds in this example to the Haar wavelet transform.Example2.2For more vanishing moments,i.e.,smoother approximation signals,we takeThese Nevillefilters give rise to a2-channelfilter bank with2primal and4dual vanishing moments. The lifting scheme can also be used for higher dimensional signals.For these signals the lifting scheme consists of channels,where denotes the absolute value of the determinant of the dilation matrix,that is used in the corresponding discrete wavelet transform.In each channel the signal is translated along one of the coset representatives from the unit cell of the corresponding lattice,see[12]. The signal in thefirst channel is then used for predicting the data in all other channels by using possible different prediction operators.Thereafter thefirst channel is updated using update operators on the other channels.Let us consider an image as a two-dimensional signal.An important example of the lifting scheme applied to such a signal is one that involves channels().We subdivide the lattice on which the signal has been defined into two sets on quincunx grids,see Figure3.This division is also called ”checkerboard”or”red-black”division.The pixels on the red spots()are used to predict the samples on the black spots(),while updating of the red spots is performed by using the detailed data on the black spots.An example of a lifting transform with second order prediction and updatefilters is given by4Figure3:A rectangular grid composed of two quincunx grids.order200000040000060008Table1:Quincunx Nevillefilter coefficientsThe algorithm using the quincunx lattice is also known as the red-black wavelet transform by Uytterhoeven and Bultheel,see[20].In general can be written as(2.3) with a subset of mod and,a set of coefficients in. In this case a general formula for reads(2.4)with depending on the number of required primal vanishing moments.For several elements in the coefficients attain the same values.Therefore we take these elements together in subsets of, i.e.,(2.5)Table1indicates the values of all,for different values of(2through8)when using quincunx Nevillefilters,see[12],which are thefilters we use in our approach.We observe that and so a44tapsfilter is used as prediction/update if the requiredfilter order is8.For an illustration of the Nevillefilter of order see Figure4.Here the numbers,correspond to the values of thefilter coefficients as given in and respectively at that position.The left-handfilter can be used to transform a signal defined on a quincunx grid into a signal defined on a rectangular grid,the right-hand filter is the degrees rotated version of the left-handfilter and can be used to transform a signal from a rectangular grid towards a quincunx grid.We observe that the quincunx lattice yields a non separable2D-wavelet transform,which is also sym-metric in both horizontal and vertical direction.Furthermore,we only need one prediction and one update operator for this2D-lifting scheme,which reduces the number of computations.The prediction and update operators for the quincunx lattice do also appear in schemes for other lattices, like the standard2D-separable lattice and the hexagonal lattice[12].The algorithm for the quincunx lattice can be extended in a rather straightforward way for these two other well-known lattices.5111122222222111122222222Figure 4:Neville filter of order :rectangular (left)and quincunx (right)Figure 5illustrates the possibility of the use of more than channels in the lifting scheme.Herechannels are employed,using a four-colour division of the 2D-lattice.It involves (interchange-able)prediction steps.Each of the subsets with colours ,and respectively,is predicted by application of a prediction filter on the subset with colour .Figure 5:Separable grid (four-colour division).3.A DAPTIVE L IFTINGWhen using the lifting scheme or a classical wavelet approach,the prediction/update filters or wavelet/scaling functions are chosen in a fixed fashion.Generally they can be chosen in such way that a signal is approximated with very high accuracy using only a limited number of coefficients.Discontinuities mostly give rise to large detail coefficients which is undesirable for applications like compression.For our purpose large detail coefficients near edges in an images are desirable,since they can be identified with the shape of objects we want to detect.However,they are undesirable if such large coefficients are related to the background of the image.This situation occurs if a small filter is used on a background of texture that contains irregularities locally.In this case a large smoothing filter gives rise to small coefficients for the background.These considerations lead to the idea of using different prediction filters for different parts of the signal.The signal itself should indicate (for example by means of local behavior information)whether a high or low order prediction filter should be used.Such an approach is commonly referred to as an adaptive approach.Many of these adaptive approaches have been described already thoroughly in the literature,e.g.[3,4,8,13,19].In this paper we follow the approach proposed by Baraniuk et al.in [2],called the space-adaptive approach.This approach follows the scheme as shown in Figure 6.After splitting all pixels of a given image into two complementary groups and (red/black),thepixels inare used to predict the values in .This is done by means of a prediction filter acting on ,i.e.,.In the adaptive lifting case this prediction filter depends on local information of the image pixels .Choices for may vary from high to low order filters,depending on the regularity of the image locally.For the update operator,we choose the update filter that corresponds to the prediction filter with lowest order from all possible to be chosen .The order of the update filter should be lower or equal to the order of the prediction filter as a condition to provide a perfect reconstruction filter bank.As with the classical wavelet filter bank approach,the order of the prediction filter equals the number of dual vanishing6/.-,()*+/.-,()*+Figure6:Generating coefficients via adaptive liftingmoments while the order of the updatefilter equals the number of primal vanishing moments,see[12].The above leads us to use a second order Nevillefilter for the update step and an th order Nevillefilter for the prediction step,where.In our application the reconstruction part of the lifting scheme is not needed.In[2],Baraniuk et al.choose to start the lifting scheme with an update operator followed by an adaptively chosen prediction operator.The reason for interchanging the prediction and update operator is that this solves stability and synchronization problems in lossy coding applications.We will not discuss this topic in further detail,but only mention that they took for thefilters of and the branch of the Cohen-Daubechies-Feauveau(CDF)filter family[5].The order of the predictionfilter was chosen to be,,or,depending on the local behavior of the signal.Thefilter orders of the CDFfilters in their paper correspond to thefilter orders of the Nevillefilters we are using in our approach.Relative local variance We propose a measure on which the decision operator in the2D adaptive lifting scheme can be based on,namely the relative local variance of an image.This relative local variance(RLV) of an image is given byrlv var(3.1) with(3.2) For the window size we take,since with this choice all that are used for the prediction of contribute to the RLV for,even for the8th order Nevillefilter.When the RLV is used at higher resolution levels wefirst have to down sample the image appropriately.Thefirst time the predictionfilter is applied(to the upper left pixel)we use the8th order Nevillefil-ter on the quincunx lattice as given in Table1.For all other subsequent pixels to be predicted,we first compute rlv.Then quantizing the values of the RLV yields a decisionmap indicating which predictionfilter should be used at which positions.Values above the highest quantizing level induce a 2nd order Nevillefilter,while values below the lowest quantizing levels induce an8th order Nevillefil-ter.For the quantizing levels we take multiples of the mean of the RLV.Test results have shown that rlv rlv rlv are quantizing levels that yield a good performance in our application.In Figure7we have depicted an image(left)and its decision map based on the RLV(right).4.A FFINE I NVARIANT L IFTINGAlthough both traditional wavelet analysis and the lifting scheme yield detail and approximation coeffi-cients that are localised in scale and space,they are both not translation invariant.This means that if a signal or image is translated along the grid,its lifting coefficients may not be just be given by a translation of the original coefficients.Moreover,in general the coefficients will attain values in the same range of the original values(after translation),but they will be totally different.7a) original image b) decision map (RLV)Figure7:An object on a wooden background and its rel.local variance(decision map):white=8th order, black=2nd order.For studying lifting coefficients of images a desirable property would also be invariance under reflections and rotations.However,for these two transformations we have to assumefirst that the values of the image on the grid points is not affected a rotation or reflection.In practice,this means that we only consider reflections in the horizontal,the vertical and the diagonal axis and rotations over multiples of.4.1Redundant LiftingFor the classical wavelet transform a solution for translation invariance is given by the redundant wavelet transform[15],which is a non-decimated wavelet(at all scales)transform.This means that one gets rid of the decimation step.As a consequence the data in all subbands have the same size as the size as the input data of the transform.Furthermore,at each scaling level,we have to use zero padding to thefilters in order to keep the multiresolution analysis consistent.Not only more memory is used by the redundant transform,also the computing complexity of the fast transform increases.For the non-decimated transform computing complexity is instead of for the fast wavelet transform.Whether the described redundant transform is also invariant under reflections and rotations depends strongly on thefilters(wavelets)themselves.Symmetry of thefilters is necessary to guarantee certain rotation and reflection invariances.This is a condition that is not satisfied by many well-known wavelet filters.The redundant wavelet transform can also be translated into a redundant lifting scheme.In one dimension this works out as follows.Instead of partitioning a signal into and we copy to both and.The next step of the lifting scheme is to predict by(4.1) The predictionfilter is the samefilter as used for the non-redundant case,however now it depends on the resolution level,since at each level zero padding is applied to.This holds also for the updatefilters .So,the update step reads(4.2)For higher dimensional signals we copy the data in all channels of the usedfilter bank. Next the-channel lifting scheme is applied on the data,using zero padding for thefilters at each resolu-8................ ........Figure8:Tree structure of the-channel lifting scheme.tion level.Remark,that for each lifting step in the redundant-channel lifting scheme we have to store at each scaling level times as much data as in the non-redundant scheme,see Figure8.We observe that in our approach Nevillefilters on a quincunx lattice are used.Due to their symmetry properties,see Table1,the redundant scheme does not only guarantee translation invariance,but also invariance under rotations over multiples of and reflections in the horizontal,vertical and diagonal axis is assured.Invariance under other rotations and reflections can not be guaranteed by any prediction and updatefilter pair,since the quincunx lattice is not invariant under these transformations.4.2An Attempt to Avoid Redundancy:Fixed Point LiftingAs we have seen the redundant scheme provides a way offinding detail and approximation coefficients that are invariant under translations,reflections and rotations,under which the lattice is also invariant.Due to its redundancy this scheme is stable in the sense that it treats all samples of a given signal in the same way.However redundancy also means additional computational costs and perhaps even worse additional memory to store the coefficients.Therefore we started searching for alternative schemes that are also invariant under the described class of affine transformation.Although we did not yet manage to come up with an efficient stable scheme,we would like to stretch the principal idea behind the building blocks of such approach.In the sequel we will only use the redundant lifting scheme as described in the preceding section.Before we start looking for possible alternative schemes we examine why the lifting scheme is not translation invariant.Assume we have a signal that is analysed with an-band lifting scheme. Then after one lifting step we have approximation data and detail data.Whether one sample,is determined to become either a sample of or a sample ofdepends only on its position on the lattice and the way we partition the lattice into groups.Of course, this partitioning is rather arbitrary.The more channels we use the higher the probability is that for afixed partitioning one sample that was determined to be used for predicting other samples,will become a sample of after translating.Following Figure8it is clear that any sample,can end up after lifting steps in ways,either in approximation data at level or in detail data at some level.The idea of the alternative scheme we propose here is to partition a signal not upon its position on the lattice but upon its structure.This means that for each individual signal we indicate afixed point for which we demand that it will end up in the approximation data after lifting steps.If this point can be chosen independent of its coordinates on the lattice,the lifting scheme based on this partitioning will then translation invariant.For higher dimensional signals we can also achieve invariance under the other discussed affine transformations,however then we have tofix more points,depending on the number ofchannels.In our approach the quincunx lattice is used and thereforefixing one approximation sample on scales will immediatelyfix the partitioning of all other samples on the quincunx lattice at scale. As a result thefixed point lifting scheme is invariant under translations,rotations and reflections that leave the quincunx lattice invariant.In the sequel of this chapter we will only discuss the lifting scheme for for the quincunx lattice.Although the proposedfixed point lifting scheme may seem to be a powerful tool for affine invariant lifting,it will be hard to deal with in practice.The problem we will have to face is how to choose afixed point in every image.In other words we have tofind a suitable decision operator that adds to every a unique,itsfixed point,i.e.,If we demand to depend only on and not on the lattice(coordinate free)it will be hard tofind such that is well defined.This independence of the coordinates is necessary for rotation invariances.However, this is not the only difficulty we have to face.Stability of the scheme is an other problem.If for some reason afixed point has been wrongly indicated,for example due to truncation errors,the whole scheme might collapse down.Although we cannot easily solve the problem of determining incorrectfixed points we can increase the stability of the scheme by not imposing that at each scale should be an index number of the coarse scale data after zero padding.Instead of this procedure we rather determine afixed point for both the original signal()and for the coarse scale data(at each scale.Then we impose that should be used for prediction in the th lifting step,for and with.Furthermore,stability may be increased by using decision operators that generate a set offixed points.However,since no stable method (uniform decision operator)is available yet,we will use the redundant lifting scheme in our approach and do not work out the idea offixed point lifting here at this moment.5.M OMENT I NVARIANTSAt the outset of this section we give a brief introduction into the theory of statistical invariants for imag-ing purposes,based on centralized moments.Traditionally,these features have been widely used in pat-tern recognition applications to recognize the geometrical shapes of different objects[11].Here,we will compute invariants with respect to the detail coefficients as produced by the wavelet lifting schemes of Sections2–4.We use invariants based on moments of the coefficients up to third order.We show how to construct a feature vector from the obtained wavelet coefficients at several scales It is followed by proposals for normalization of the moments to keep them in comparable range.5.1Introduction and recapitulationWe regard an image as a density distribution function,the Schwartz class.In order to obtain translation invariant statistics of such we use central moments of for our features.The order central moment of is given by(5.1) with the center of massand(5.2)Computing the centers of mass and of yieldsand bining this with(5.1)showsi.e.,the central moments are translation invariant.We also require that the features should be invariant under orthogonal transformations(rotations).For deriving these features we follow[11]using a method with homogeneous polynomials of order.These are given by(5.3) Now assume that the variables are obtained from other variables under some linear transformation,i.e.,then is an algebraic invariant of weight if(5.4) with the new coefficients obtained after transforming by.For orthogonal transformations we have and therefore is invariant under rotations ifParticularly we have from[11],that if is an algebraic invariant,then also the moments of order have the same invariant,i.e.,(5.5) From this equation2functions of second order can be derived that are invariant under rotations,see[11]. For we have the invariantsandIt was also shown that these two functions are also invariant under reflections,which can be a useful property for identifying reflected images.Since the way of deriving these invariants may seem a bit technical and artificial,we illustrate with straightforward calculus that and are indeed invariant under rotations.The invariance under reflections is left to the reader,since showing this follows the same calculations.We consider the rotated distribution functionand the corresponding invariants and,which are and but now based on moments calculated from.So what we have to show is that and.It follows from(5.1)and(5.2)that if and only ifwith and.Obviously this holds true,considering the trigonometric rule .To do the same for we also have to introduce and.Because we have to take products of integrals that define,we cannot use and in both integrals.As for we can now derive from(5.1)and(5.2)that if and only ifWe simplify the right-hand side term by term.Thefirst term,that is related to becomes The second term(related to)becomesAdding these two terms gives uswhich demonstrates that indeed also is invariant under rotations.Similar calculus shows that invariance under reflections also holds.From Equation(5.5)four functions of third order and one function of both second and third order can be derived that are invariant under both rotations and reflecting,namelyandwithThe last polynomial that is invariant under both rotations and reflections consists of both second and third order moments and is given bywith and as above.To these six invariants we can add a seventh one,which is only invariant under rotations and changes sign under reflections.It is given bySince we want to include reflections as well in our set of invariant transformations we will use instead of in our approach.From now on,we will identify with.We observe that all possible linear combinations of these invariants are invariant under proper orthogonal transformations and translations.Therefore we can call these seven invariants also invariant generators.。
英语测试课程chapter-1

课程简介:
“语言测试”是英语专业双语方向四年级开设的一门理论与 实践兼顾性专业课程,课程主要培养学生运用所学的测试理 论,设计、操作和管理测试(特别是中小学外语测试)的能 力,促进学生树立英语测试的科学意识,形成以测试理论指 导考试实践和教学实践的意识,并为以后开展语言测试研究 打下基础。本课程在介绍语言测试基本理论的基础上,结合 我国英语教学实际及学生的特点,着重讲解考试的宏观、微 观功能,考试总体设计、单项语言能力/技能的测试、命题、 施考,考试分析,考试信息反馈等方面的知识。主要任务是 让学生了解并掌握语言测试的基本原理及具体操作方法,以 便他们在未来教学实践中提高命题水平和考试质量。
课程教育目标:通过本课程的学习,使学生
1. 学会分析试卷的效度、信度、难度、区分度、可行性和后效 作用。 2. 学会选择适当题型,编制高质量的检测学生听、说、读、写、 译等外语技能和词汇、语法等外语知识的试卷。 3. 能制定科学的评分标准,采用科学的评分方法评阅试卷。 4. 学会分析考试成绩,包括考试分数的集中量、差异量,试题 的难易度、区分度等。 成绩评定:平时成绩50%(出勤情况15%,课堂表现15%,课 程作业20%),期末考察成绩50%。
心理生理机制 心理机制本质上是指在语言使用的实施阶段所牵涉的神经的 和生理的过程。我们知道,听和看是不同的,接收和输出也 是不同的。在接收性的语言使用中,我们使用听和看的技能; 而在输出性的语言使用中,我们使用神经肌肉技能(如发音 器官和手指)。例如,在考接收性语言时,考生需要使用眼 睛和耳朵(生理的),而在处理所听和所看的语言时,则需 要使用大脑(神经的或心理的)。同样,在考输出性语言技 能时,考生在考虑说什么和写什么时,需要用大脑,而在说 和写的过程中,则牵涉到发音器官和手指。
The Phase Diagram of Strongly-Interacting Matter
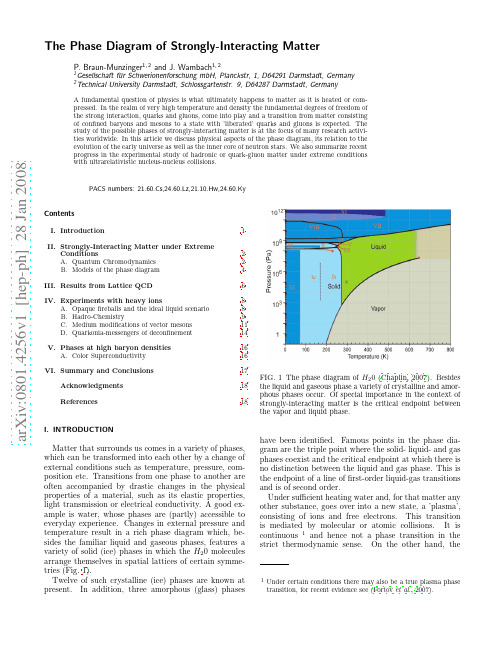
a r X i v :0801.4256v 1 [h e p -p h ] 28 J a n 2008The Phase Diagram of Strongly-Interacting MatterP.Braun-Munzinger 1,2and J.Wambach 1,21Gesellschaft f¨u r Schwerionenforschung mbH,Planckstr,1,D64291Darmstadt,Germany 2Technical University Darmstadt,Schlossgartenstr.9,D64287Darmstadt,GermanyA fundamental question of physics is what ultimately happens to matter as it is heated or com-pressed.In the realm of very high temperature and density the fundamental degrees of freedom of the strong interaction,quarks and gluons,come into play and a transition from matter consisting of confined baryons and mesons to a state with ’liberated’quarks and gluons is expected.The study of the possible phases of strongly-interacting matter is at the focus of many research activi-ties worldwide.In this article we discuss physical aspects of the phase diagram,its relation to the evolution of the early universe as well as the inner core of neutron stars.We also summarize recent progress in the experimental study of hadronic or quark-gluon matter under extreme conditions with ultrarelativistic nucleus-nucleus collisions.PACS numbers:21.60.Cs,24.60.Lz,21.10.Hw,24.60.KyContentsI.Introduction1II.Strongly-Interacting Matter under ExtremeConditions2A.Quantum Chromodynamics 2B.Models of the phase diagram 4III.Results from Lattice QCD6IV.Experiments with heavy ions8A.Opaque fireballs and the ideal liquid scenario 8B.Hadro-Chemistry9C.Medium modifications of vector mesons 11D.Quarkonia-messengers of deconfinement 14V.Phases at high baryon densities16A.Color Superconductivity 16VI.Summary and Conclusions17Acknowledgments 18References18I.INTRODUCTIONMatter that surrounds us comes in a variety of phases,which can be transformed into each other by a change of external conditions such as temperature,pressure,com-position etc.Transitions from one phase to another are often accompanied by drastic changes in the physical properties of a material,such as its elastic properties,light transmission or electrical conductivity.A good ex-ample is water,whose phases are (partly)accessible to everyday experience.Changes in external pressure and temperature result in a rich phase diagram which,be-sides the familiar liquid and gaseous phases,features a variety of solid (ice)phases in which the H 20molecules arrange themselves in spatial lattices of certain symme-tries (Fig.1).Twelve of such crystalline (ice)phases are known at present.In addition,three amorphous (glass)phasesFIG.1The phase diagram of H 20(Chaplin,2007).Besides the liquid and gaseous phase a variety of crystalline and amor-phous phases occur.Of special importance in the context of strongly-interacting matter is the critical endpoint between the vapor and liquid phase.have been identified.Famous points in the phase dia-gram are the triple point where the solid-liquid-and gas phases coexist and the critical endpoint at which there is no distinction between the liquid and gas phase.This is the endpoint of a line of first-order liquid-gas transitions and is of second order.Under sufficient heating water and,for that matter any other substance,goes over into a new state,a ’plasma’,consisting of ions and free electrons.This transition is mediated by molecular or atomic collisions.It is continuous 1and hence not a phase transition in the strict thermodynamic sense.On the other hand,the2plasma exhibits new collective phenomena such as screen-ing and ’plasma oscillations’(Mrowczynski and Thoma,2007).Plasma states can alsobeinduced byhighcompression,whereelectronsare delocalizedfrom their orbitals and form a conducting ’degenerate’quantum plasma.In contrast to a hot plasma there exists in this case a true phase transition,the ’metal-insulator’transition (Gebhard,1997;Mott,1968).A good exam-ple are white dwarfs,stars at the end of their evolution which are stabilized by the degeneracy pressure of free electrons (Chandrasekhar,1931;Shapiro and Teukolsky,1983).One may ask what ultimately happens when matter is heated and compressed.This is not a purely academic question but is of relevance for the early stages of the universe as we go backwards in time in the cosmic evolu-tion.Also,the properties of dense matter are important for our understanding of the composition and properties of the inner core of neutron stars,the densest cosmic objects.Here,the main players are no longer forces of electromagnetic origin but the strong interaction,which is responsible for the binding of protons and neutrons into nuclei and of quarks and gluons into hadrons.In the Standard Model of particles physics the strong in-teraction is described in the framework of a relativistic quantum field theory called Quantum Chromodynamics (QCD),where point-like quarks and gluons are the ele-mentary constituents.The question of the fate of matter at very high tem-perature was first addressed by Hagedorn in a seminal paper in 1965(Hagedorn,1965)and later elaborated by Frautschi (Frautschi,1971).The analysis was based on the (pre-QCD)’bootstrap model’in which strongly-interacting particles (hadrons)were viewed as composite ’resonances’of lighter hadrons.A natural consequence of this model is the exponential growth in the density of mass statesρ(M h )∝M −5/2he M h /T H.(1)This is well verified by summing up the hadronic states listed by the Particle Data Group (Yao et al.,2006).A fit to the data yields T H ∼160−180MeV.It is then easy to see that logarithm of the partition function of such a ’resonance gas’ln ZRG(T )=iln Z RG i +κ∞m 0dM h ρ(M h )M 3/2h e −M h /T(2)and,hence,all thermodynamic quantities diverge when T =T H ,which implies that matter cannot be heated be-yond this limiting ’Hagedorn temperature’.Here,ln Z i is the logarithm of the partition function for all well iso-lated particles with mass m i .Above a certain mass m 0all particles start to overlap and from that point on the sum is converted into an integral over the mass density ρ(m )and all particles can be treated in Boltzmann ap-proximation.For the present argument the explicit valueof the constant κis immaterial.The energy that is sup-plied is used entirely for the production of new particles.This is of course at variance with our present understand-ing of the big bang in which the temperature is set by the Planck scale T ∼M Planck =2In all formulas below we use ¯h =c =13This term was coined by Edward Shuryak (Shuryak,1978a)3of electrons with photons is given byL QED=−14G aµνGµνa+¯qγµ(i∂µ−g sλa4Quarks form a fundamental representation of the Lie group SU(3).which now includes a non-linear term.Its form is en-tirely dictated by the gauge group(which is now SU(3) rather than U(1))through its’structure constants’f abc5. The group structure is also reflected in the quark-gluon coupling through the’Gell-Mann’matricesλa which are the analog of the SU(2)Pauli matrices.The more elab-orate group structure renders QCD much more compli-cated than QED even at the classical level of Maxwell’s equations.6In any relativisticfield theory the vacuum itself be-haves,due to quantumfluctuations,like a polarizable medium.In QED the photon,although uncharged, can create virtual electron-positron pairs,causing partial screening of the charge of a test electron.This implies that the dielectric constant of the QED vacuum obeys7ǫ0>1.On the other hand,because of Lorentz invari-ance,ǫ0µ0=1,i.e.the magnetic permeabilityµ0is smaller than one.Thus the QED vacuum behaves like a diamagnetic medium.In QCD,however,the gluons carry color charge as well as spin.In addition to vir-tual quark-antiquark pairs,which screen a color charge and thus would make the vacuum diamagnetic,the self-interaction of gluons can cause a color magnetization of the vacuum and make it paramagnetic.This effect ac-tually overcomes the diamagnetic contribution from¯q q pairs such thatµc0>1.The situation is somewhat simi-lar to the paramagnetism of the electron gas,where the intrinsic spin alignment of electrons overwhelms the dia-magnetism of orbital motion.Sinceµc0>1it follows thatǫc0<1,so that the color-electric interaction be-tween charged objects becomes stronger as their separa-tion grows(’infrared slavery’).In this sense the QCD vac-uum is an’antiscreening’medium.As the distance r→0, on the other hand,µc0andǫc0→1,and the interaction be-comes weaker(’asymptotic freedom’).This gives rise to a pronounced variation(’running’)of the strong’fine struc-ture constant’αs=g2s/4πwith(space-time)distance or momentum transfer Q.Its mathematical form to lead-ing order was worked out in1973by Gross and Wilczeck and independently by Politzer(Gross and Wilczek,1973; Politzer,1973)and yieldsαs(Q2)=12π5Gauge groups other than U(1)wherefirst discussed by Yang and Mills in1954(Yang and Mills,1954)in the context of SU(2)and the correspondingfield theories are therefore called’Yang-Mills theories’.Since the generators of SU(N)do not commute such theories are also called’non-abelian’.6For instance,the wave equation for the vector potentials A aµis non-linear and its solutions in Euclidean space-time include solitons called’instantons’.7Provided the distance r is large enough so that the virtual cloud around the test charge is not penetrated.This distance is ex-tremely small.scale parameter.As indicated in Fig.2the running ofαs8The situation is analogous to the case of a cavity in a perfectconductor(superconductor)withµ=0,ǫ=∞except that therole ofµandǫare interchanged.baryons or quark-antiquark pairs for mesons and impos-ing appropriate boundary conditions on the quark wavefunctions to prevent leakage of color currents across theboundary,B can be determined from afit to knownhadron masses.For the quark-hadron transition the MIT-Bag modelprovides the following picture:when matter is heated,nuclei eventually dissolve into protons and neutrons(nu-cleons).At the same time light hadrons(preferentiallypions)are created thermally,which increasinglyfill thespace between the nucleons.Because of theirfinitespatial extent the pions and other thermally producedhadrons begin to overlap with each other and with thebags of the original nucleons such that a network of zoneswith quarks,antiquarks and gluons is formed.At a cer-tain critical temperature T c these zonesfill the entire vol-ume in a’percolation’transition.This new state of mat-ter is the quark-gluon plasma(QGP).The vacuum be-comes trivial and the elementary constituents are weaklyinteracting sinceµc0=ǫc0=1everywhere.There is,how-ever,a fundamental difference to ordinary electromag-netic plasmas in which the transition is caused by ioniza-tion and therefore gradual.Because of confinement therecan be no liberation of quarks and radiation of gluonsbelow the critical temperature.Thus a relatively sharptransition is expected.A similar picture emerges whenmatter is strongly compressed.In this case the nucleonsoverlap at a critical number density n c and form a colddegenerate QGP consisting mostly of quarks.This statecould be realized in the inner core of neutron stars andits properties will be discussed later.In the MIT-Bag model thermodynamic quantities suchas energy density and pressure can be calculated as afunction of temperature and quark chemical potential9µqand the phase transition is inferred via the Gibbs con-struction of the phase boundary.Under the simplifyingassumption of a free gas of massless quarks,antiquarksand gluons in the QGP atfixed T andµq one obtains thepressurep QGP(T,µq)=37π22π2−B.(9)To the factor37=16+21,16gluonic(8×2),12quark(3×2×2)and12antiquark degrees of freedom contribute.For quarks an additional factor of7/8accounts for thedifferences in Bose-Einstein and Fermi-Dirac statistics.The temperature dependence of the pressure follows aStefan-Boltzmann law,in analogy to the black-body ra-diation of massless photons.The properties of the physi-cal vacuum are included by the bag constant B,which is a measure for the energy density of the vacuum.By con-struction,the quark-hadron transition in the MIT bag model is offirst order,implying that the phase boundary is obtained by the requirement that at constant chemi-cal potential the pressure of the QGP is equal to that in the hadronic phase.For the latter the equation of state (EoS)of hadronic matter is needed.Taking for simplic-ity a gas of massless pions with pπ(T,µq)=(3π2/90)T4, a simple phase diagram emerges in which the hadronic phase is separated from the QGP by afirst-order transi-tion line.Taking for the bag constant the original MIT fit to hadronic masses,B=57.5MeV/fm3one obtains T c∼100MeV atµq=0andµc∼300MeV at vanishing temperature(Buballa,2005).These results have a number of problems.On the one hand,the transition temperature is too small,as we know in the mean time.We will come back to this in the next section.On the other hand at3µq=µb∼M N(mass of the nucleon M N=939MeV),where homogeneous nu-clear matter consisting of interacting protons and neu-trons is formed,a cold QGP is energetically almost de-generate with normal nuclear matter.Both problems are, however,merely of quantitative nature and can be cir-cumvented by raising the value of B.More serious is the fact that,at largeµq,a gas of nucleons because of its color neutrality is always energetically preferred to the QGP. The biggest problem is,however,that QCD has a number of other symmetries besides local gauge symmetry which it shares with QED.Most notable in the present context is chiral symmetry,which is exact in the limit of vanishing quark masses.For physical up and down quark masses of only a few MeV this limit is well satisfied10.Exact chiral symmetry implies that only quarks with the same helicity or’chirality’interact11,i.e.the left-handed and right-handed world completely decouple.This means in particular that physical states of opposite parity must be degenerate in mass.Similar to a ferromagnet,where rotational symmetry is spontaneously broken at low temperatures through spin alignment,also the chiral symmetry of the strong inter-action is spontaneously broken in the QCD vacuum as a result of the strong increase ofαs at small momenta (Fig.2).Empirical evidence is the absence of parity doublets in the mass spectrum of hadrons.Since mass-less quarksflip their helicity at the bag boundary the MIT-Bag model massively violates chiral symmetry.For100%0%FIG.3Fraction of the effective quark mass generated dy-namically (light-grey)as compared to that from the Higgs mechanism in the electro-weak sector of the Standard Model (dark grey).QCD vacuum.In QCD,mesons emerge as bound states of quark-antiquark pairs with constituent mass.Because of spon-taneous chiral symmetry breaking there appears,how-ever,a peculiarity that is known from condensed matter physics and was first noted by J.Goldstone (Goldstone,1961).For vanishing (bare)quark mass there must be a massless excitation of the vacuum,known as the ’Gold-stone mode’.Such highly collective modes occur e.g.in spin systems.The ferromagnetic ground state has a spon-taneous alignment of all spins.A spin wave of infinite wavelength (λ→∞,k →0)corresponds to a simulta-neous rotation of all spins,which costs no energy 12.In strong interaction physics with two flavors this mode is identified with the pion.The fact that pions are not ex-actly massless is related to the finite bare mass of the up and down quarks.Nevertheless the pion mass with ∼140MeV is significantly smaller than that of the ρ-or the ωmeson (∼800MeV ∼2M q ).In the 1980’s and 1990’s the NJL model was used ex-tensively in theoretical studies of the phase diagram.Since it incorporates spontaneous symmetry breaking and the ensuing mass generation one can address ques-tions of chiral symmetry restoration with increasing T and µq and the corresponding medium modifications of hadron masses.The quark-antiquark condensate ¯q q serves as an order parameter for chiral symmetry break-ing,analogous to the spontaneous magnetization in a spin system.Similar to the Curie-Weiss transition,the order parameter vanishes at a critical temperature T c in the chiral limit.This is the point where chiral symmetry is restored and the quarks become massless 13.Figure 4displays a prediction for the evolution of the chiral con-densate with temperature and quark-chemical potential for physical up and down quark masses obtained in mean-7 and the statistical mechanics of a system with temper-ature T=1/τ.With this method of’lattice QCD’thepartition function of the grand canonical ensembleZ(V,T,µq)= D[A,q]e 1/T0dτ V d3x(L QCD−µq q†q)(11)can be evaluated stochastically via Monte Carlo samplingoffield configurations14.From the partition function,thethermodynamic state functions such as energy densityand pressure can be determined asε≡EV ∂ln Z V;p=T∂ln Z14For vanishingµq the integration measure is always positive defi-nite.This is no longer true forfiniteµq due to the fermion’sign problem’to the QGP.The critical energy densityǫ(T c)is700±300 MeV/fm3which is roughly5times higher than the en-ergy density in the center of a heavy nucleus like208P b. At the same time the chiral condensate ¯q q =∂p/∂m q diminishes rapidly near T c signalling therestoration of broken chiral symmetry.As indicated in Fig.5a sys-tematic discrepancy of about15%between the calcu-lated energy density(and pressure)and the free gas Stefan-Boltzmann limit is observed for T>2T c.Al-though this is roughly consistent with thefirst-order cor-rection from perturbation theory,the perturbation series is poorly convergent and resummation techniques have to be employed(Blaizot et al.,2006)for a quantitative understanding of the high-temperature EoS.The ab-initio numericalfindings support the simple model results for the existence of a QGP transition dis-cussed above.In this connection it should be mentioned, however,that most lattice calculations still have to use unrealistically large values for the light quark masses and rather small space-time volumes.With anticipated high-performance computers in the range of hundreds of Ter-aflop/s these calculations will be improved in the near future.Ultimately they will also provide definite answers concerning the nature of the transition.Among others, this is of importance for primordial nucleosynthesis,i.e. the formation of light elements,such as deuterium,he-lium and lithium.In a stronglyfirst-order quark-hadron transition bubbles form due to statisticalfluctuations, leading to significant spatial inhomogeneities.These would influence the local proton-to-neutron ratios,pro-viding inhomogeneous initial conditions for nucleosyn-thesis(Boyanovsky et al.,2006).Other consequences would be the generation of magneticfields,gravitational waves and the enhanced probability of black-hole forma-tion(Boyanovsky et al.,2006).At present,indications are that forµq=0,relevant for the early universe,the transition is a’cross over’,i.e. not a true phase transition in the thermodynamic sense (Aoki et al.,2006a).Near T c the state functions change smoothly but rapidly as in hot electromagnetic plasmas. For most of the experimental observables to be discussed below this subtlety is,however,of minor relevance.A cross over would wash out large spatialfluctuations and hence rule out inhomogeneous cosmic scenarios.Very recent studies(Aoki et al.,2006b;Cheng et al.,2006)in-dicate that the exact value of the transition temperature is still poorly known.In fact,these investigations have yielded values for T c in the range150-190MeV.This is in part due to difficulties with the necessary extrapola-tion to the thermodynamic(infinite volume)limit and in part due to the general difficulty in providing an absolute scale for the lattice calculations.Progress in this difficult area is expected with simulations on much larger lattices at the next generation computer facilities.While atµq=0the lattice results are relatively pre-cise,the ab-initio evaluation of the phase boundary in the(T,µq)-plane(Fig.4)poses major numerical dif-ficulties.This is basically related to the Fermi-Dirac8statistics of the quarks and is known in many-body physics as the ’fermion-sign problem’.For the integral (11)this implies that the integrand becomes an oscilla-tory function and hence Monte-Carlo sampling methods cease to work.Only recently new methods have been developed (Allton et al.,2003;Fodor and Katz,2002;de Forcrand and Philipsen,2002;Philipsen,2006)to go into the region of finite µq .What can be expected?Considering the phase bound-ary as a line of (nearly)constant energy density,the bag model (Braun-Munzinger and Stachel,1996a)pre-dicts that the critical temperature decreases with increas-ing µq .By construction the bag model describes a first-order phase transition for all chemical potentials.For large values of µq and low temperatures there are indi-cations from various QCD-inspired model studies,chiefly the NJL model (see Fig.4),that the (chiral)phase tran-sition is indeed first order.On the other hand,the lat-tice results discussed above seem to indicate that at very small µq the transition is a cross over.This would im-ply that there is a critical endpoint in the phase dia-gram,where the line of first-order transitions ends in a second-order transition (as in the liquid-gas transition of water).In analogy to the static magnetic suscepti-bility χM =∂M/∂H in a spin system one can define a ’chiral susceptibility’as the derivative of the in-medium chiral condensate ¯q q T,µq wrt the bare quark mass m q or equivalently as the second derivative of the pressure,χm =∂ ¯q q T,µq /∂m q =∂2p/∂m 2q .Here the quark mass m q plays the role of the external magnetic field H .In the Curie-Weiss transition χM diverges.The same should happen with χm at the CEP.On the other hand lat-tice studies and model calculations indicate that also the quark number susceptibility χn =∂n q /∂µq =∂2p/∂µ2q diverges.This implies that in the vicinity of the CEP the matter becomes very easy to compress since the isother-mal compressibility is given by κT =χn /n 2q .It is con-jectured that the critical behavior of strongly-interacting matter lies in the same universality class as the liquid-gas transition of water (Stephanov,2004).The exper-imental identification of a CEP and its location in the (T,µq )plane would be a major milestone in the study of the phase diagram.Although very difficult,there are several theoretical as well experimental efforts un-derway (Proceedings of Science,2006)to identify signals for such a point.For a recent critical discussion concern-ing the existence of a CEP in the QCD phase diagram see (Philipsen,2007).IV.EXPERIMENTS WITH HEAVY IONSThe phase diagram of strongly-interacting matter can be accessed experimentally in nucleus-nucleus collisions at ultrarelativistic energy,i.e.energies/nucleon in the center of mass (c.m.)frame that significantly ex-ceed the rest mass of a nucleon in the colliding nu-clei.After first intensive experimental programs at theBrookhaven Alternating GradientSynchrotron (AGS)and the CERN Super Proton Synchrotron (SPS)the ef-fort is at present concentrated at the Relativistic Heavy-Ion Collider (RHIC)at Brookhaven.A new era of ex-perimental quark matter research will begin in 2008with the start of the experimental program at the CERN Large Hadron Collider (LHC).Here we will not attempt to give an overview over the experimental status in this field (for recent reviews see (Braun-Munzinger and Stachel,2007;Gyulassy and McLerran,2005))but concentrate on a few areas which in our view have direct bearing on the phase diagram.Before doing so we will,however,briefly sketch two of the key results from RHIC,which have led to the discovery that quark-gluon matter in the vicinity of the phase boundary behaves more like an ideal liquid rather than a weakly-interacting plasma.A.Opaque fireballs and the ideal liquid scenarioAt RHIC,Au-Au collisions are investigated at c.m.energies of 200GeV per nucleon pair.In such colli-sions a hot fireball is created,which subsequently cools and expands until it thermally freezes out 15and free-streaming hadrons reach the detector.The spectroscopy of these hadrons (and the much rarer photons,elec-trons and muons)allow conclusions about the state of the matter inside the fireball,such as its temperature and density.The four experiments at RHIC have re-cently summarized their results (Adams et al.,2005b;Adcox et al.,2005;Arsene et al.,2005;Back et al.,2005).For a complete overview see also the proceedings of the two recent quark matter con-ferences (Proc.Quark-Matter 2005Conference,2006;Proc.Quark-Matter 2006Conference,2007).9FIG.6Geometry in the plane perpendicular to the beam di-rection of thefireball in a nucleus-nucleus collision with large impact parameter.The producedfireball has such a high density and tem-perature that apparently all partons(quarks and glu-ons)reach equilibrium very rapidly(over a time scale of less than1fm/c).Initially,the collision zone is highly anisotropic with an almond-like shape,at least for colli-sions with not too small impact parameter.The situa-tion is schematically described in Fig.6.In this equili-brated,anisotropic volume large pressure gradients exist, which determine and drive the hydrodynamic evolution of thefireball.Indeed,early observations at RHIC con-firmed that the data on theflow pattern of the mat-ter follow closely the predictions(Huovinen et al.,2001; Kolb and Heinz,2004;Teaney et al.,2002)based on the laws of ideal relativistic hydrodynamics.By Fourier anal-ysis of the distribution in azimuthal angleΦ(see Fig.6) of the momenta of produced particles the Fourier coef-ficient v2= cos(2Φ) can be determined as a function of the particles transverse momentum p t.These distri-butions can be used to determine the anisotropy of the fireball’s shape and are compared,in Fig.7for various particle species,to the predictions from hydrodynamical calculations.The observed close agreement between data and predictions,in particular concerning the mass or-dering of theflow coefficients,implies that thefireball flows collectively like an liquid with negligible shear vis-cosityη.Similar phenomena were also observed in ultra-cold atomic gases of fermions in the limit of very large scattering lengths,where it was possible,by measuring ηthroughflow data,to establish that the system is in a strongly coupled state(O’Hara et al.,2002).The appli-cation of such techniques are currently also discussed for quark-gluon matter.This liquid-likefireball is dense enough that even quarks and gluons of high momentum(jets)cannot leave without strong rescattering in the medium.This’jet quenching’manifests itself in a strong suppression(by about a factor of5)of hadrons with large momenta transverse to the beam axis compared to expectations from a superposition of binary nucleon-nucleon collisions. The interpretation is that a parton which eventually turns into a hadron must suffer a large energy loss while traversing the hot and dense collision zone.To make matters quantitative one defines the suppression factor R AA as the ratio of the number of events at a given transverse momentum p t in Au-Au collisions to that in proton-proton collisions,scaled to the Au-Au system by the number of collisions such that,in the absence of parton energy loss,R AA=1.Corresponding data are presented in Fig.8.The strong suppression observed by the PHENIX and,in fact,all RHIC collaborations (Adams et al.,2005b;Adcox et al.,2005;Arsene et al., 2005;Back et al.,2005)demonstrates the opaqueness of thefireball even for high momentum partons while pho-tons which do not participate in strong interactions can leave thefireball unscathed.Theoretical analysis ofthese FIG.7The Fourier coefficient v2for pions,kaons,protons andΛbaryons(with masses of140,495,940and1115MeV, respectively)emitted with transverse momentum p t in semi-central Au-Au collisions at RHIC.The data are from the STAR collaboration(Adams et al.,2005a).The lines cor-respond to predictions(Huovinen et al.,2001)from hydro-dynamical calculations with an equation of state based on weakly interacting quarks and gluons.data(Gyulassy and McLerran,2005;Vitev,2006)pro-vides evidence,albeit indirectly,for energy densities ex-ceeding10GeV/fm3in the center of thefireball.There is even evidence for the presence of Mach cone-like shock waves(Casalderrey-Solana et al.,2005;Stoecker,2005) caused by supersonic partons traversing the QGP.Ap-parently both elastic parton-parton collisions as well as gluon radiation contribute to the energy loss but it is fair to say that the details of this mechanism are currently not well understood.The situation is concisely summa-rized in(Gyulassy and McLerran,2005).B.Hadro-ChemistryIn ideal hydrodynamics no entropy is generated dur-ing the expansion and cooling of thefireball,i.e.the system evolves through the phase diagram(essentially) along isentropes,starting in the QGP phase.This can be experimentally verified through the production of a variety of mesons and baryons.The analysis of particle production data at AGS,SPS and RHIC en-ergies has clearly demonstrated(Andronic et al.,2006; Becattini et al.,2004;Braun-Munzinger et al.,2004a) that the measurements can understood to a high ac-curacy by a statistical ansatz,in which all hadrons are produced from a thermally and chemically equilibrated state.This hadro-chemical equilibrium is achieved dur-ing or shortly after the phase transition and leads to abundances of the measured hadron species that can be described by Bose-Einstein or Fermi-Dirac distributions n j=g j。
A SINGLE HEISENBERG-GABOR BASED FIGURE-OF-MERIT BASED ON THE MODULATION TRANSFER FUNCTION O

A SINGLE HEISENBERG-GABOR BASED FIGURE-OF-MERIT BASED ON THEMODULATION TRANSFER FUNCTION OF DIGITAL IMAGING SYSTEMSCorey Manders and Steve MannUniversity of TorontoDept.of Electrical and Computer Engineering10King’s College Rd.Toronto,CanadaABSTRACTWe propose a singlefigure-of-merit measure of resolution of a dig-ital imaging system based on the work of Gabor in communication theory.Gabor’s work was largely inspired by Heisenberg’s de-velopments in quantum theory,most notably his uncertainty theo-rem of quantum mechanics.Gabor’s results look simultaneously at the frequency and spatial domain of a signal,making it ideal for the measure of the modulation transfer function and point-spread function of an imaging system.As opposed to the crude “megapixel”measure which is bantered about in the marketplace, we suggest afigure-of-merit which more accurately represents the resolution of the system.Given that the resolution measure we pro-pose is condensed into a single number rather than a function such as the modulation transfer function or the point spread function,it is our intent to propose this scientific evaluation as a means for typ-ical consumers to fairly judge the resolution of a camera.Finally, we use this measure to compare common digital SLR cameras with varying lenses.1.INTRODUCTION:DESCRIBING A CAMERA’SRESOLUTIONAn unfortunate development for typical consumers buying digital cameras is the evaluation of a particular camera by its measure of megapixels.Often consumers will prefer one camera over another simply because the pixel count is higher.Most engineers and sci-entists realize this measure is not entirely appropriate as a descrip-tor.Among the host of reasons why this is true:megapixel counts do not describe tonal response,they do not take into account the complete imaging system(for example the point spread function of the lens system),and often interpolated pixels are included in the count.Alternatively,engineers,scientists,and learned users of cameras prefer the data offered by the modulation transfer function [1].The calculation of the modulation transfer function will be concisely explained in the following section.Those familiar with the modulation transfer function will undoubtedly understand that the function is a far superior measure than megapixels.However, the downside of a graph of the function is that it is not intuitive. An observer of a plot of the modulation transfer function of a cam-era must approximate at which frequency the function begins to decline,how long the function takes to decline,and the overall rate of decline of the function.General consumers of cameras are bolstered by the simplicity of megapixel counts in a society where bigger means better.Furthermore,modulation transfer functions are often plotted logarithmically,adding to the complexity of read-ing the data.It should be noted that in the previous era offilm based cam-eras,many professional gradefilms came with plots of the tonal re-sponse of thefilm in the form of a set of response curves.Though these plots were obviously only describing the response of thefilm and not the imaging system,these plots were most often thrown away.The common reason for throwing the information away could easily be speculated;the information is presented in a format too complicated for many users,and secondly,even with the infor-mation,the user was not able to accurately use the information in any meaningful way(with a few exceptions).We propose a system of measuring a cameras response by means of a singlefigure-of-merit of the modulation transfer function.This system results in a single number which is appropriate as a measure of both the tonal and spatial resolution of an imaging system.After describing in detail our method offinding thefigure-of-merit of a given imaging system,we measure four imaging sys-tems.Two Nikon digital SLR cameras,the D70and the D2H, with two lenses,an AF-S Nikkor18-70mm1:3.5-4.5G ED DX lens and an AF Nikkor70-300mm1:4-5.6D ED lens.Each sys-tem was tested at the most open fstop(3.5for the18-70mm lens 4for the70-300mm lens).Similarly,the focal length of the two lenses were set to their shortest setting,18mm and70mm respec-tively.It should also be noted that the two cameras use different imaging technology.The lower priced Nikon D70camera uses a 6.1megapixel CCD sensor whereas the professional grade D2H uses a4.1megapixel“LBCast”JFET sensor developed by Nikon.2.THE MODULATION TRANSFER FUNCTIONThe sharpness of a photographic imaging system or of a compo-nent of the system is characterized by a parameter called modu-lation transfer function(MTF).This function is also termed the spatial frequency response and is relatively easy to calculate using a test chart.Several test charts are available,such as the USAF 1951test chart.However,Norman Koren has developed a test chart which is much easier to use and is free to download from his website().The basic pattern of the chart is shown infigure1.It is also common to see this test patternas Fig.1:The basic MTF test pattern,a sine wave of increasing spatial frequency.black and white line pairs as opposed to the sine pattern shown infigure1giving rise to the scale lp/mm(line pairs per millime-ter).However,given that the pattern used in this paper is the sine pattern,the measure cy/mm(cycles per millimeter)is more appro-priate.One may easily recognize this pattern as a visual chirp,the sensor response of which is the basis of our analysis.Most often,the test chart is positioned at a distance from the lens such that the lp/mm or cy/mm correspond to a millimeter of the sensor array.This implies that one knows the size of the sensor array.Even though this is relatively easy tofind for most commer-cially available cameras,using this measure in this regard is not appropriate for the task for which we intend.A user of a digital camera or imaging system usually just wants to know the resolu-tion of the imaging system,regardless of how large the physical sensor is.For this reason,we disregard the cycles per millimeter and rather consider cycles per image height and cycles per image width.2.1.Calculating the MTFIntuitively,the Modulation Transfer Function(MTF)may be de-scribed in the following manner:once the test chart is properly po-sitioned and a test image is taken,we analyse the resulting images. At frequencies where the MTF of an imaging system is100%,the pattern is unattenuated and retains full contrast.At the frequency where MTF is50%,the contrast is half its original value.It should also be noted that all calculations are done on RAW imagefiles. The non-linear range compression(described in detail in[2][3] and[4]),will modify the shape of the resulting ing a linear response output,as is demonstrated in RAW imagefiles, is essential in computing MTFs and resulting resolution parame-ters with consistency between cameras.It is well documented that the range compression applied to raw data internally in imaging system varies from camera manufacturer to camera manufacturer and indeed camera model to camera model.In the case where raw data is is not available from a given camera,the range compression mustfirst be expanded to accurately measure the response.Such a technique is demonstrated in[3],where the resulting photoquanti-metric values are light-linear,appropriate for the task.For added accuracy,the data in this paper was calculated from the uninterpo-lated Bayer pattern data.Let V b be the raw photoquantimetric value(pixel value from the raw data)which is the minimum value observed in the test im-age,likely observed in the low frequency region.Let V w be the raw photoquantimetric value which is the maximum value observed in the test image,also likely to be observed in the low frequency region.Let V min be the minimum luminance for a pattern near spatial frequency f.Correspondingly,let V max be the maximum luminance for a pattern near spatial frequency f.The necessary definitions may then be stated as:C(0)=V w−V bV w+V bthe low frequency(base)contrastC(f)=V max−V minV max+V minis the contrast at spatial frequency fMT F(f)=C(f)C(0)(1)C(0)is the highest contrast found in the image of the test chart.The modulation transfer function at a frequency f(MT F(f)) is normalized by this contrast resulting in a measure in which the highest value is1.0(perfect modulation transfer)and0.0(no mod-ulation transfer).At any horizontal co-ordinate,the test chart and resulting image represents a specific frequency f in cy/mm.For vertical resolution testing,the test chart is rotated90degrees,and consequently vertical co-ordinates represent a specific frequency.2.2.Positioning the testchartThe test charts produced by Norman Koren are scaled such that the scales indicated on the test chart correspond to the test chart being 2.5mm or5mm in length.Rather than millimeters,we consider cycles per image width(cy/iw).Then,if two contiguous lengths of the test chart are imaged,10mm of the test image have been imaged in reference to the test chart scale.Thus,if the scale reads 2cy/mm this becomes20cy/iw,10cy/mm becomes100cy/iw,etc. The fact that the scale is now in image widths allows the measure of resolution to be universal across sensors.To deal with different resolutions in image height,the test image is also imaged in a ver-tical position.A similar position is established for the camera to test chart distance,yielding a test pattern which may be examined in cy/ih(cycles per image height).When we conducted these tests on the cameras,we positioned the camera such that a single test chart was imaged so that the low frequency end started at the edge of the image and ended in the center of the image.This was done in both the vertical and horizontal cases.We chose to image the test chart such that the high frequency signals were largely in the centre of the frame to guard against any distortions(such as bar-rel distortion from the lens)which tend to affect the outer edges of the image more than the centre.Note that this will also result in higher resolution test results than if the image was taken with higher frequencies at the edge of the camera’sfield of view.2.3.Collecting accurate dataWith most cameras,a Bayer pattern is used in collecting red,green, and blue sensor values.Most commonly,these are alternating lines of red,green,red,green,etc.and green,blue,green,blue, etc.These values become interpolated in various manners to pro-duce red,green,and blue pixel values at every pixel location,even though only one pixel colour exists at a specific -ing programs such as David Coffin’s free source program dcraw (available at /∼dcoffin/dcraw/),or else neftoppm(available at /∼corey/code.htm), the raw linear12-bit uninterpolated Bayer pattern data may be col-lected.In the case of dcraw,the code must be modified so that no Bayer interpolation takes place,this will leave the raw sensor val-ues in each of their original locations.The resulting12-bit portable pixmap image(ppm)was then separated into three colour images (red,green,and blue)with NaN in the locations where there is no data.Once the single ppm image was split into three colour images, the relevant data was cropped out of each colour channel’s ppm. The resulting data was averaged down columns in the case of the horizontal test pattern,disregarding NaN values,and across rows in the case of the vertical test pattern,also disregarding NaN val-ues.One should note that in the case of the green channel,the resolution will be higher than that of the blue and red channels due to the number of sensors being equal to the total number of red and blue sensors.From this data,the modulation transfer functions in the vertical and horizontal directions were computed.Average down columns0.00.51.0Linearize x axisFigure−of−meritImage Centre5020020001005001000Compute MTF0 500 1000 1500 2000CalculateHeisenberg-Gabor NumberFig.2:A visual representation of the process used to find the Heisenberg-Gabor figure-of-merit.The initial image of the test pattern is taken such that one pattern begins at one edge of the image and ends in the centre.The Bayer pattern data is then extracted from the raw image file data and appropriately averaged excluding NaNs.From this data the MTF is calculated followed by linearizing the x-axis and applying equation 2.This yields a figure-of-merit for a single colour channel,which may then be linearly combined with other colour channels,producing a single figure-of-merit for a given imaging system.3.PRODUCING A HEISENBERG-GABORFIGURE-OF-MERITUsing Heisenberg’s uncertainty relation[5],Gabor proposes the concept of “effective frequency width”∆f and “the effective dura-Fig.3:The modulation transfer function plotted for both the vertical and horizontal test patterns.The Fourier transform of this measure is the point-spread function of the camera.As expected,the 2-D modulation transfer function is close to being Gaussian,and correspondingly,the point-spread function approaches being Gaussian.tion”∆t of a signal in his 1946paper[6].To measure the modula-tion transfer function (and possibly the corresponding point-spread function of the camera),we propose to use Gabor’s ∆f measure to quantify the resolution of a given camera.As the modulation transfer function may be viewed as a spatial frequency signal,we consider its effective frequency.3.1.Analytic BackgroundTo find the values of ∆f ,the simplest method uses the first and second moments of the signal.Specifically we have,∆f =h2π`f −¯f´2i 12.(2)Note that for ease of calculation,the use of the statistical identity `f −¯f´2=¯f 2+(¯f )2is utilized.Given any signal s (f )and its corresponding quadrature signal σ(f )as in [6]we define a weight functionψ∗ψ=ˆs (f )2˜+ˆσ(f )2˜(3)where the asterisk denotes the complex conjugate of the resultinganalytic signal.The weight function is therefore the square of the absolute value of the signal.This can be considered the “power”of the signal and will be referred to by this name in what follows.Following the logic of Gabor,we do not consider the moments themselves,but rather the moments divided by M 0.For example,in our case we have:¯f =R ψ∗fψd f R ψ∗ψd f ¯f 2=R ψ∗f 2ψdt R ψ∗ψd f .(4)Finally,we note the fact that the spatial frequency signal (the mod-ulation transfer function),and the point spread function are relatedby a Fourier transform.This is what gives rise to the factor of 2πin the definition of ∆t and ∆f .Also,the point spread function may be found simply by taking the discrete Fourier transform of a symmetric version of the modulation transfer function.The sym-metric modulation transfer function is produced by assuming the response of the imaging system will be identical for negative fre-quencies as positive frequencies,therefore enabling us to mirror the MTF around the y-axis.3.2.The∆f measure of resolutionUsing the information presented,one recognizes that in the spatial frequency domain,an imaging system should maximize its fre-quency response.Thus,we wish∆f to be as large as possible. On the contrary,the ideal point spread function is a delta function, thus we wish to minimize the measure of∆t.However,increasing ∆f will under most circumstances decrease∆t.For this reason, we propose∆f as a reasonable measure of resolution in one axis. We must also remember that the measure may be taken in multiple directions and locations on the imaging system.We chose to mea-sure the orthogonal vertical and horizontal directions,given the typical pixel layouts on imaging sensors.The horizontal measure, we choose to label∆f hor and the vertical measure∆f vert.Because we wish to maximize both the vertical and horizontal components of the∆f measure,afinal measure of sensor resolution in one colour channel is proposed which is simply∆f V H=∆f vert×∆f hor(5)3.3.Simultaneously evaluating colour channelsThe previous work in this paper shows how to to derive a sin-glefigure-of-merit(∆f V H)which may be applied to each of the colour channels taken from the uninterpolated Bayer pattern.One possibility is to only test and report the result for the green chan-nel.This certainly makes sense from the perspective that the sen-sor array is populated more densely with green sensors,and the eye is most sensitive to light in the green range.Unfortunately,if the camera suffered from distortions in the red and blue channels,such a measure would be blind to this problem.In most digital cameras and imaging systems,the green channel will have a higher reso-lution which coincides with human perception.For this reason, we are suggesting that a valid measure of the three channels is to perform a YCbCr transformation on the values of the three chan-nels,and take the Y component as a measure of thefinal sensor resolution.We term this measure∆f Y,which may be calculated as:∆f Y=0.299∆f V H(Red)+0.586∆f V H(Green)+0.114∆f V H(Blue)(6) The base results for each colour channel using various camera bod-ies and lens combinations are given in table1,and the resulting single number using equation6is shown infigure2.4.CONCLUSIONGiven our method of combining colour channel resolution mea-sures presented previously,the followingfinalfigures-of-merit are shown in table2.The results are largely as one may predict.The Nikon D70having a higher sample rate(it is a6.1megapixel cam-era as opposed to the4megapixel D2h),does indeed outperform the D2h in terms of the Heisenberg-Gabor rating.Also,chang-ing the lens from the Nikkor18-70mm to the Nikkor70-300mm also reduces the performance.We expect this as the increased fo-cal length should increase the width of the associated point-spread function,effectively convolving a larger blur kernel with the cap-tured scene.There are a few steps that may be taken to improve the accu-racy of the measure.Specifically,aliasing artifacts are present in the data,creating unwanted results in the MTF calculation.ThisGreen ChannelImaging Horizontal Vertical Total System Resolution Resolution Resolution D70,18-70mm lens1678.551491.82 2.504×10⁶ D70,70-300mm lens1883.331313.77 2.474×10⁶ D2h,18-70mm lens1368.391316.65 1.802×10⁶ D2h,70-300mm lens1432.251183.37 1.695×10⁶Blue ChannelD70,18-70mm lens1628.891308.38 2.130×10⁶ D70,70-300mm lens1336.921513.33 2.023×10⁶ D2h,18-70mm lens1531.61776.53 2.721×10⁶ D2h,70-300mm lens1386.021371.71 1.901×10⁶Red ChannelD70,18-70mm lens1532.441307.57 2.004×10⁶ D70,70-300mm lens1451.631473.52 2.138×10⁶ D2h,18-70mm lens1329.641496.46 1.990×10⁶ D2h,70-300mm lens1530.341312.43 2.009×10⁶ Table1:Heisenberg-Gabor(∆f)results for various combinations of Nikon D70and Nikon D2h camera bodies with Nikkor18-70mm and70-300mm lenses.Imaging System Figure-of-merit(∆f Y)Nikon D70,18-70mm lens 2.309×10⁶Nikon D70,70-300mm lens 2.280×10⁶Nikon D2h,18-70mm lens 1.961×10⁶Nikon D2h,70-300mm lens 1.811×10⁶Table2:Resultingfigures of merit for Nikon D70and D2h camera bodies with Nikkor18-70mm and70-300mm lenses.is particularly a problem when calculating the second moments of the MTF where small artifacts in high frequencies result in large perturbations from results which should be around0.This could be overcome by averaging results where each image was taken with small pans(for the horizontal tests)or small tilts(for the vertical tests),and is the topic of ongoing research.5.REFERENCES[1]David Corley and Shirley Li,“Controlling image quality in adigital world,”Journal of the Society of Motion Picture and Television Engineers,pp.293–306,September2004.[2] F.M.Candocia,“A least squares approach for the jointdomain and range registration of images,”IEEE ICASSP, vol.IV,pp.3237–3240,May13-172002,avail.at http://iul.eng.fi/candocia/Publications/Publications.htm.[3] C.Manders,C.Aimone,and S.Mann,“Camera response re-covery from different illuminations of identical subject mat-ter,”in Proceedings of the IEEE International Conference on Image Processing,Singapore,Oct.24-272004,pp.2965–2968.[4]Steve Mann,Intelligent Image Processing,John Wiley andSons,November22001,ISBN:0-471-40637-6.[5]W.Heisenberg,“¨Uber den anschaulichen inhalt der quan-tentheoretischen kinematik und mechanik,”Zeitschrift f¨u r Physik,vol.43,pp.172–198,1927,English translation:J.A.Wheeler and H.Zurek,Quantum Theory and MeasurementPrinceton Univ.Press,1983,pp.62-84.[6] D.Gabor,“Theory of communication,”J.Inst.Elec.Eng.,vol.V ol.93,no.3,pp.429–457,1946.。
Corporate Social Responsibility and Insider Trading

Corporate Social Responsibility and Insider Trading Jinhua Cui•Hoje Jo•Yan LiReceived:23April2013/Accepted:29January2014ÓSpringer Science+Business Media Dordrecht2014Abstract This study examines the impact of corporate social responsibility(CSR)activities on insider trading. While opponents of insider trading claim that the buying or selling of a security by insiders who have access to non-public information is illegal,proponents argue that insider trading improves economic efficiency and fairness when corporate insiders buy and sell stock in their own compa-nies.Based on extensive U.S.data of insider trading and CSR engagement,wefind that both the number of insider transactions and the volume of insider trading are posi-tively associated with CSR activities.We alsofind that legal insider transactions are positively related to CSR engagement even after controlling for potential endoge-neitybias and variousfirm characteristics.Furthermore,our evidence suggests thatfirms perceive adjustment to CSR dimension of product as being efficient,while adjustment to diversity and environmental CSR as being inefficient. Our results of bad and illegal insider trading proxies are consistent with the interpretation thatfirms with high CSR ratings do not attempt to engage in unethical or bad insider trading in a significant bined together,we consider our empirical evidence supportive of the fairness and efficiency explanation,but not the unfairness and inefficiency hypothesis.Keywords Corporate social responsibilityÁInsider tradingÁInsider transactionsÁEfficiency improvement IntroductionNumerous studies examine various beneficial and cost aspects of corporate social responsibility(CSR)andfind evidence that CSR is generally beneficial to thefirm, including lower cost of equity and debt,higher analyst following,more favorable analyst recommendation,lower earnings management,more effective corporate gover-nance,and higherfirm value.Others focus on the cost side, such as immediate cash outflows and a waste of valuable resources due to CSR activities.1While insider trading also plays an important role in the financial market,the ethical aspects of insider trading are a gray area for many investors.Many studies examine the legitimacy issues(fairness),information efficiency aspects (efficiency),and ethical perspectives(morality)of insider trading.2‘‘Insider trading’’is indeed a term subject to many definitions and connotations and it encompasses both legalJ.CuiSchool of Business,Korea University,Seoul,Koreae-mail:kiki4u@korea.ac.krH.Jo(&)Leavey School of Business,Santa Clara University,500El Camino Real,Santa Clara,CA95053-0388,USA e-mail:hjo@Y.LiWorld Bank Singapore,Singapore,Singaporee-mail:seraphjoan@ 1See Chava(2010),El Ghoul et al.(2011),Dhaliwal et al.(2011)for the overview of CSR research.2See Meulbroek(1992),Cornell and Sirri(1992),Healy and Palepu (1995),Chakravarty and McConnell(1997),and Aktas et al.(2007) for the overview of insider trading research,and see McGee(2008, 2009)for ethical perspectives of insider trading.See more the detailed literature review of CSR and insider trading in the next section. Throughout the article,we interchangeably use insider trading and insider transactions following the previous literature(see,for instance,Lakonishok and Lee2001).J Bus EthicsDOI10.1007/s10551-014-2113-zand prohibited activity.Insider trading takes place legally every day,when corporate insiders—officers,directors,or employees—buy or sell stock in their own companies within the confines of company policy and the regulations governing this trading(Newkirk and Robertson1998).3 While the definition of insider trading is often ambiguous and there is a widespread misperception on the part of public about insider trading,SEC considers illegal insider trading as the act of trading,or causing someone to trade,on the basis of material private information in breach of afiduciary duty or other relationship of trust and confidence,while in possession of material,non-public information about the security(As-tarita2011).In contrast,when corporate insiders legally trade in their own securities based on their previous trading-plan report to the SEC,many investors and traders use this infor-mation to identifyfirms with investment potential.If the insiders are buying the stock,it might be a good idea to buy the stock because the insiders must know more about their firm than others.With illegal insider trading cases making the news,however,ethical arguments for both sides of the issue are emerging,andfirms’preference for or against CSR engagement can influencefirms’decisions about insider trading/transactions.Although various roles of CSR in financial markets are extensively studied and the media and academics have discussed various aspects of insider trading, empirical association between CSR engagement and insider trading still remains largely overlooked.Our study attempts to fill the void.In this article,we examine the impact of U.S.firms’CSR activities on insider trading.Specifically,we question whe-therfirms with high social responsibilities refrain from insider trading.We also question whetherfirms with high social responsibilities involve in relatively smaller volume of insider trading.Wefirst examine whether CSR activities influence all insider trading including both legal and illegal insider trans-actions and volume.Next,although it is often challenging,if not impossible,to distinguish bad and illegal insider trading from good and legal ones,we examine the impact of CSR activities on illegal and bad insider trading measured by insider transactions executed within one month before earn-ings announcement because the blackout period(prohibited trading period)is usually1month before earnings announcement,and insiders are typically allowed to trade after the material information about thefirm becomes public.Opponents of insider trading often claim that insider trading could make thefinancial market unfair and less efficient if access to valuable information is confined only to a limited group of insiders(the unfairness and inefficiency hypothesis). In a market rife with insider trading,insiders can exploit private information to take advantage of their opponents.This means that insiders’gain comes at the cost of someone else’s loss;not a loss based on skill,but a loss based on having information that someone else doesn’t have.Abusing this information is mor-ally wrong,because it violates the principals of fairness and efficiency upon which thefinancial market is based.Propo-nents,however,argue that insider trading causes information to be released sooner to public,thus causing stock prices to move in the right direction faster than would otherwise be the case (the fairness and efficiency hypothesis).Whether insiders’private information improves eco-nomic fairness and efficiency or jeopardizes the market efficiency and fairness forfirms engaging in various CSR activities is an open empirical issue that is relatively less explored in the prior literature.To the best of our knowledge, this paper is thefirst to examine whetherfirms with high social responsibility ratings engage in more(or less)number of insider transactions and in higher(or lower)volume of insider transactions.This empirical exercise provides a new and additional empirical insight on the relative importance between the unfairness&inefficiency hypothesis and the fairness&efficiency explanation.We consider this issue important because insider trading is largely perceived by public as unethical and even illegal in U.S.Employing U.S.firms’CSR activities standardized by year and industry based on social ratings from KLD Stats database during the1991–2008for main analysis and the 1991–2011period for some additional tests and insider3Legal trades by insiders are common,as employees of publiclytraded corporations often have stock or stock options.These trades aremade public in the United States through Securities and ExchangeCommissionfilings,mainly Form4.Prior to2001,w-restrictedtrading such that insiders mainly traded during windows when theirinside information was public,such as soon after earnings releases(Stein2001).SEC rule10b5-1clarified that the prohibition againstinsider trading does not require proof that an insider actually usedmaterial non-public information when conducting a trade;possessionof such information alone is sufficient to violate the provision,and theSEC would infer that an insider in possession of material non-publicinformation used this information when conducting a trade.However,SEC rule10b5-1also created for insiders an affirmative defense if theinsider can demonstrate that the trades conducted on behalf of theinsider were conducted as part of a pre-existing contract or writtenbinding plan for trading in the future(Stein2001).For example,if aninsider expects to retire after a specific period of time and,as part ofhis or her retirement planning,the insider has adopted a writtenbinding plan to sell a specific amount of the company’s stock everymonth for two years and later comes into possession of material non-public information about the company,trades based on the originalplan might not constitute prohibited insider trading.On the otherhand,Sects.16(b)and10(b)of the Securities Exchange Act of1934,the rules against insider trading on material non-public information,directly and indirectly address illegal insider trading.We alsointerchangeably use‘‘good’’and‘‘legal’’insider trading as well as‘‘bad’’and‘‘illegal’’insider trading.In fact,the regulation of insidertrading is a relatively recent phenomenon,and the U.S.is thefirstmajor country to enact an insider trading law.As of1990,thirty-fourcountries had insider trading laws restricting or prohibiting insidertrading,and only nine of them had prosecuted anyone for insidertrading(McGee2008).By2000,eighty-seven countries had passedinsider trading laws,and38had prosecuted at least one insider tradingcase(McGee2008).J.Cui et al.transaction data from Thomson Financial during the 1991–2008period that include both legal and illegal insider trading,wefind several empirical regularities.First,we find thatfirms with high social ratings are positively associated with insider transaction frequency as well as insider trading volume after controlling for variousfirm characteristics.In addition,wefind that the positive asso-ciation between CSR engagement and insider transaction frequency and between CSR engagement and insider trading volume remains robust even after controlling for endogeneity bias.Second,corporate managers may adjust CSR up or down when they perceive these insider trans-actions efficient or inefficient.To the extent that high CSR firms choose insider transaction for the fairness and effi-ciency purpose,wefind thatfirms perceive sub-CSR dimensions of product as being efficient,while sub-CSR dimensions of diversity and environment as being ineffi-cient.Third,we expect thatfirms with higher socially responsible ratings take smaller bad insider transactions and fewer insider trading volumes.However,in an attempt to distinguish illegal from legal insider trading,when we examine the insider transaction frequencies and volumes during one month before earnings announcement,which are typically prohibited exercise in practice,wefind that firms with high social ratings do neither increase nor decrease their insider transactions and volumes.Overall,firms with high CSR ratings do not attempt to engage in unethical or bad insider trading in a significant fashion. Taken together,our results are closer to the fairness and efficiency hypothesis than the unfairness and inefficiency hypothesis.The remainder of the article is organized as follows.We briefly discuss the related literature and develop our hypotheses in‘‘Literature Review and Hypotheses Devel-opment‘‘section.We discuss the sample and measurement of CSR and insider trading as well as our research design in ‘‘Sample and Research Design‘‘section.‘‘Empirical Results‘‘section presents the empirical results and addi-tional analyses.‘‘Discussion‘‘section provides a brief discussion on the limitation of this study and potential future research avenue,and the last section summarizes our conclusions.Literature Review and Hypotheses Development Recent studies investigate various beneficial aspects of CSR and suggest that CSR is beneficial to thefirm,such as lower cost of equity(Chava2010;El Ghoul et al.2011; Dhaliwal et al.2011),lower cost of debt(Chava2011; Goss and Roberts2011),higher analyst following(Hong and Kacperczyk2009),more favorable analysts recom-mendation(Ioannou and Serafeim2010),higher analyst forecast accuracy(Dhaliwal et al.,2012),betterfinancial communications to shareholders(Fieseler2011),lower earnings management(Kim et al.2012),more effective corporate governance,and higherfirm value(Waddock and Graves1997;Blazovich and Smith2011;Jo and Harjoto 2011,2012).Others focus on the cost side of CSR engagement.Friedman(1970)views CSR engagement as potential waste of valuable resources if CSR activities reduce shareholders’profits,and therefore,corporate executives have no right to spend company resources to social causes,such as CSR program.Sprinkle and Maines (2010)provide anecdotal evidence for the costs of CSR, i.e.,immediate cash outflows and opportunity cost of spending on CSR.Barnea and Rubin(2010)also maintain that if CSR initiatives do not maximizefirm value,such initiatives are a waste of valuable resources.Insider trading has been around for a long period of time and regardless of its legitimacy,it will continue infinancial market.Insider trading takes place when‘‘insiders’’trade shares of afirm for which they have privileged material, non-public information,and for which they strive to exploit pecuniary or other benefits.Insiders refer to any person or group that can obtain such valuable information about a firm.4Typically,insiders include CEO,CFO,directors, other top managers,or employees of afirm.Insiders also include people who can gain privileged information indi-rectly from such managers or directors in a more intimate capacity,such as friends,family members,relatives,or close but external business associates.Or they can refer to persons who have a contractual or supply linkage to such a firm,such as those who print annual reports or stockbrokers who may inadvertently gain an information advantage. Thus inside information can be obtained from multiple sources from which such material and non-public infor-mation can be exploited forfinancial or other benefits.5 While many previous studies examine the fairness, efficiency aspects,and ethical perspectives of insider trading,the relation between CSR ranking and insider trading has been unclear,and there has been very few serious attempts to explore the relation.Recently,Lopatta et al.(2012),based on event study methodology,investi-gate the relation between asymmetric information of 4Insider trading can also take place for liquidity reasons.For example,insiders unexpectedly need a lot of money,and they have to sell some shares,not necessarily based on their private information. 5Using the comprehensive U.S.insider trading data from1986to 2008,Lee et al.(2011)suggest that there has been a steady increase over time in the proportion of trades by insiders that occur right after quarterly earnings announcements.For example,before the adoption of ITSFEA in1988,approximately35%of insider trades occurred in the month immediately following an earnings announcement.After 2002,over50%of all trades occur in the month following earnings announcements.CSR and Insider Tradinginsider trades and CSR for USfirms andfind that CSR activities appear to reduce abnormal returns and therefore informational asymmetries.Their study,however,is mute regarding the fairness,efficiency,and/or ethical issues of CSR and insider trading.To the extent that CSR activities attempt to reduce conflicts of interest between managers and non-investing stakeholders(Jo and Harjoto2011, 2012),we suspect thatfirms with higher CSR rankings are likely to concern the fairness,efficiency,and ethical issues of insider trading more thanfirms with lower CSR ratings.With regard to market efficiency,Schotland(1967) maintains that insider trading postpones information dis-closure and therefore reduces market efficiency.Salbu (1992)also asserts that insider trading could make the financial market less efficient.He claims thatfinancial markets function less efficiently if access to valuable information is limited only to a small group of insiders. That is also unfair.He further argues that information must be spread among numerous competitors,as opposed to a confined group of insiders,in the marketplace who have equal access to information in order for the market to instantaneously and fully reflect all relevant available information efficiently.Insiders typically have valuable information unavailable to the public.They havefirst hand knowledge of what the company is doing and better information concerning what the future might hold. McKinley(1999)claims that if there are likely problems for thefirm in the future,such as poor earnings,slow growth,or lawsuits,then insiders can sell their stock before these events happen.When this information becomes public,the stock’s price will fall.However,this price decrease occurs after the insider has sold shares,thus avoiding the loss.In this case,the insider beats the market. On the other hand,insiders know when theirfirms have a promising future,high potential earnings,innovative CSR projects being developed,etc.When the future looks promising,insiders can purchase shares before the public knows these facts.The price,later,fully increases to rep-resent the positive information.In both cases,insider managers can use material non-public information for their own use to beat the market and/or to build their own per-sonal reputation building at the cost of shareholders’wealth,making the market less efficient at least in the short run.Opponents of insider trading often claim that unequal access to information is somehow unfair,and therefore insiders who benefit from the use of inside information are violating theirfiduciary duty.They further claim that insider trading based on inside information encourages unethical greed and potential fraud as well(Strudler and Orts1999;McGee2009).Surowiecki(2005)further asserts that‘‘…Ultimately,insider trading is an inefficient way of achieving market efficiency,because insiders earn all their profits on the lag between when they start selling and when the marketfigures out what’s going on.This gives them every reason to hoard information,with the result that stock prices are out of whack for longer than they other-wise would have been.Markets thrive on transparency,but insider trading thrives on opacity…’’.We label this argu-ment as the unfairness and inefficiency explanation of insider trading,and expect the following.Hypothesis1If inside information is only available to a limited group of insiders and makes thefinancial market less efficient and unfair,then we expect thatfirms with higher social responsibility ratings that consider fairness and efficiency pivotal,will take insider trading less fre-quently and lower insider trading volume thanfirms with lower CSR ratings.Proponents of insider trading,on the other hand, emphasize fairness and information-efficiency improve-ment from a very different view-point.Insider trading based on inside information causes information to be released into thefinancial market sooner,thus causing stock prices to move in the ideal direction faster than would otherwise be the case.Manne(1966)is thefirst study that explains that insider trading releases information early into the market and makes prices stick closer to their real value. Through the transactions of insiders,security prices will better and faster reflect the fundamental value by incor-porating the private information.Manne(1992,p.418) further states in his following study:Stock market efficiency,in the sense of prices quickly and accurately reflecting all news that could affect the value of shares,is essential to all of the stock mar-ket’s major functions:the efficient allocation of capital by corporations,and the efficient operation of the market for corporate control.If there were effective enforcement of laws against insider trading, all corrections of price would have to come from individuals who received the information more slowly than insiders and who generally could not evaluate new developments as expertly.Certainly the stock market would be less efficient than it is with no insider trading.Similarly,Vermaelen(1986)suggests that‘‘reduction of insider trading will reduce,rather than increase market efficiency because it will slow down the speed with which information will be reflected in security prices’’.What the efficient market hypothesis(EMH)requires is that a few people like insiders have the relevant information.When a few market participants have the valuable information, stock prices will move as if everyone in the entire market were well informed.Stiglitz(2006)states that‘‘…all it takes is a few people knowledgeable enough to recognizeJ.Cui et al.bargain,and prices will quickly be bid up or down to levels that reflect complete information.And if prices reflect complete information,even uninformed buyers,purchasing at current prices,will reap the benefits’’.Many other economists also support insider trading as efficiency enhancing(Carlton and Fischel1983;Manne1985;Leland 1992;Macey1999;Engelen2005).Leland(1992),for instance,theoretically shows that stock prices reflect rele-vant information(includingfirms’CSR projects)more quickly when insider trading is allowed,and thus makes financial markets more fair.Finance scholars including Meulbroek(1992),Cornell and Sirri(1992),Chakravarty and McConnell(1997),and Aktas et al.(2007)further empirically support this premise.In a related vein,Healy and Palepu(1995)maintain that it is often hard to disclose value-relevant information effectively through public announcements alone.In such cases,insider trading serves as a substitute for public dis-closure,thereby improving fairness and information effi-ciency infinancial markets.Jo and Kim(2007)further indicate that an improved corporate transparency through frequent voluntary disclosure will reduce the information asymmetry between insiders and outsiders,discourage managerial self-dealings,and enhancefirm value.Because CSR provides valuable non-financial information to financial markets(Dhaliwal et al.2011,2012),firms can further engage in CSR to enhance information transpar-ency,fairness and efficiency,and ethical aspects of insider bined together,we label this as the fairness and efficiency argument,and expect the following.6 Hypothesis2If insider trading makes information be released faster and makes thefinancial market more effi-cient and fair,then we expect thatfirms with higher social responsibility ratings that consider fairness and efficiency issues important,will take insider transactions more fre-quently and higher insider trading volume thanfirms with lower CSR ratings.Our null hypothesis of both hypotheses1and2is that insiders do not influence the market information efficiency and fairness.Sample and Research DesignSample Description of CSR and Insider TradingWe use an extensive and combined data set from the Kinder,Lydenberg,and Domini’s(KLD’s)Stats database from1991through2008for our main analysis because of insider trading data availability and the1991–2011for additional tests.KLD’s Stats inclusive social rating criteria covers approximately56strengths and concerns ratings in five major qualitative issue areas including community, diversity,employee relations,environment,and product. Prior to2001,KLD contains data from approximately650firms listed on the S&P500or Domini400Social Indexes as of August of each year.For2001and2002(2003and thereafter),the KLD’s ratings are a summary of strengths and concerns assigned to approximately1,100(3,100)firms listed on the S&P500,the Domini400Social Indexes,or the Russell1,000(Russell2,000)Indexes as of December31st of each year.Since2002,KLD renamed the other category as corporate governance and reassigned the presentation of data in the non-U.S.operations from community category.KLD also has exclusionary screens,such as alcohol, gambling,military,nuclear power,and tobacco.Because KLD’s exclusionary screens differ from the inclusive screens in that only concern ratings,but no strength ratings, are assigned,we only use the inclusive screens in our main tests.We exclude human rights criteria since human rights criteria were added to the KLD Stats in2002.We also exclude corporate governance as it is considered as a dis-tinct construct from CSR(Kim et al.2012).KLD database provides a binary(0,1)indicator for each strength and concern activities.We follow Baron et al. (2011)to construct an aggregate CSR Index.Letting C ijt denote an indicator variable of CSR forfirm i with strength j for year t from Appendix1and C t the maximum number of KLD strengths in year t for anyfirm,the index C it of CSR composite forfirm-year observation it isC it¼PjC ijtCAppendix2provides a detailed explanation of the con-struction of this index.Other variables and data sources are explained in Table1.The insider trading data used in our study also cover the same period from1991to2008,and is based on the com-prehensive insider trading data cleaned and distributed by Thomson Financial.Insiders are required to report their transactions to the Securities and Exchange Commission (SEC)according to Sect.16(a)of the Securities and Exchange Act of1934.Our sample includes companies in the insider trading data that are available on both the CRSP and Com-pustat databases.Insiders include management,large share-holders,and others who are required to report all trades to the SEC.‘‘Management’’refers to CEOs,CFOs,chairman of the board,directors,officers,presidents,and vice presidents.‘‘Large shareholders’’are shareholders who own more than 10%of shares in thefirm,but are not management.6Another argument in favor of insider trading is that inside information is property,and preventing individuals from trading their property violates their property rights(Manne1985).CSR and Insider TradingInsider transactions that we examine relate to open market or private purchases and sales of common stock,as well as the acquisition of stocks through the exercise/ conversion of options,warrants or convertible bonds.As explained in Carpenter and Remmers(2001),before May 1991,insiders were required to hold shares acquired through exercises of options for at least6months to avoid the short-swing rule(Sect.16(b)of the Securities and Exchange Act of1934)under which insiders are required to return any profits made from a round-trip transaction of less than6months.Since May1991,insiders have been free to immediately sell the shares acquired through option exercises.7Thus,to compute insider trading/transactions in this study,we include the number of shares sold,the number of shares purchased,and the number of shares acquired through exercises of options.The intersection of KLD database and insider trading data distributed by Thomson Financial during the sample period of 1991–2008,results in15,761firm-year observations of 2,821firms.Actual sample observations vary depending upon regression purposes.While identifying bad or illegal insider trading is quite difficult,Bettis et al.(2000)suggest that manyfirms responded to the increased regulation of ITSFEA and SERPSRA by adopting explicit black-out periods during which insiders are not allowed to trade without obtaining explicit permission from general counsels.In rare cases, black-out periods are defined relative to dividend announcements,mergers,bankruptcyfilings,board meet-ings,the end of the quarter,other important corporate events,or upon the possession of material non-public information.Out of78%of the respondents with black-out periods in place,the majority define black-out periods in relation to earnings announcements.Jagolinzer et al. (2011)show that80%of their260samplefirms with restrictive policies require all insiders’trades to be pre-approved by the general counsel even when those trans-actions are made during allowed time windows.The mean black-out period is around46days prior to and1day after a quarterly earnings announcement.Following Jagolinzer et al.(2011),we use the possible illegal transaction period as about1month before earnings announcement,and we take bad insider transactions as those that took insider transactions during that period.Research DesignTo gain insights on the relation between CSR and insider trading,we regress the level of insider trading measured by the number of insider transactions(FREQUENCY)as well as the volume of insider transactions(VOLUME)on theTable1Variable definitions and measures[Name]Variable definitionsVariableCSR index[CSRINDEX]An index variable from zero to one that is constructed to measurefirm’s involvement in CSR(see Appendix1and2)Insider tradingfrequency[FREQUENCY]The log of(1?annual number of insider transactions)(source:Thomson Financial)Insider tradingvolume[VOLUME]The log of(1?annual dollar volume of insider transactions)(source:Thomson Financial)Frequency dummy[FREQUENCY_HIGH]This is a dummy,which equals to1if log number of transactions is above(including)median(source:Thomson Financial)Volume dummy[VOLUME_HIGH]This is a dummy,which equals to1if trading volume is above(including)median(source:Thomson Financial)Log total asset[LOGTA]Log of total asset(data6)(source:COMPUSTAT)Log of(1?B/M)[LOGBM]The log of(1?Book-to-Market ratio(B/M ratio is based on the market capitalization at theend of December of the previous calendar year and book equity values in the priorfiscal yearend.This is only forfirms with positive book equity values.))(source:COMPUSTAT,CRSP)Deviation of stockreturns(%)[DEVRET]Standard deviation of daily stock returns during1year before current year(source:CRSP) Debt/total asset[DEBTR]Long-term debt divided by total asset(source:COMPUSTAT)R&D expenditureratio[RNDR]Research and development expense divided by total sales(source:COMPUSTAT)Advertising exp.ratio[ADVR]Advertising expense divided by total sales(source:COMPUSTAT)7/pages/faculty/ken.french/data_library.htmlJ.Cui et al.。
- 1、下载文档前请自行甄别文档内容的完整性,平台不提供额外的编辑、内容补充、找答案等附加服务。
- 2、"仅部分预览"的文档,不可在线预览部分如存在完整性等问题,可反馈申请退款(可完整预览的文档不适用该条件!)。
- 3、如文档侵犯您的权益,请联系客服反馈,我们会尽快为您处理(人工客服工作时间:9:00-18:30)。
(相變化)Qualifying Examination (Phase Transformation)
1. Consider a given volume of liquid at a temperature ∆T below T m with a free energy G 1. If some of the atoms of the liquid cluster together to form a small sphere of solid, the free energy of the system will change to G 2 given by:
SL SL L V L S V S 2γA G V G V G ++=
where V S is the volume of the solid sphere, V L the volume of liquid, A SL is the solid/liquid interfacial area, G v S and G v L are the free energies per unit volume of solid and liquid respectively, and γSL the solid/liquid interfacial free energy. The free energy of the system without any solid present is given by
()L V
L S 1G V V G +=
The excess free energy associated with the solid particle can be minimized by the correct choice of particle shape. If γSL is isotropic this is a sphere of radius r . Write an equation to express the free energy change associated with homogeneous nucleation. Sketch the curves of the free energy change (including volume free energy, interfacial energy, and their summation) versus radius r . Derive an expression for the activation energy for homogeneous nucleation. What is the critical size beyond which the solid particle is stable? Describe the effect of the mould wall on the nucleation and growth mechanism mentioned above.
2. There are certain transformations where there is no barrier to nucleation. One of these is the spinodal mode of transformation. Consider a phase diagram with a miscibility gap as shown in Fig.
5.38a. Answer the following questions.
(a) If an alloy with composition X 0 is solution treated at a high
temperature T 1 and then quenched to a lower temperature T 2 the composition will initially be the same everywhere and its free energy will be G 0 on the G curve in Fig. 5.38b. Explain why the alloy with composition X 0 is unstable and what will happen if the temperature is hold at T 2 for a sufficiently long time?
2 (b) In the other respect, if an alloy with composition X 0' is solution
treated at a high temperature T 1 and then quenched to a lower temperature T 2, the alloy will become metastable. Describe how the transformation will proceed if this alloy is aged at T 2 for a sufficiently long time?
(c) Y ou should describe both decomposition mechanisms in detail
and sketch the composition profiles at increasing times in the alloys, of which the compositions are inside the spinodal region and outside the spinodal region, respectively.。