DDR3信号完整性与电源完整性设计
电源完整性理解与设计

电源完整性理解与设计一、定义:电源完整性(Powerintegrity)简称PI,是确认电源来源及目的端的电压及电流是否符合需求。
电源完整性在现今的电子产品中相当重要。
有几个有关电源完整性的层面:芯片层面、芯片封装层面、电路板层面及系统层面。
在电路板层面的电源完整性要达到以下三个需求:1、使芯片引脚的电压噪声+电压纹波比规格要求要小一些(例如芯片电源管脚的输入电压要求1V之间的误差小于+/-50mV)2、控制接地反弹(地弹)(同步切换噪声SSN、同步切换输出SSO)3、降低电磁干扰(EMI)并且维持电磁兼容性(EMC):电源分布网络(PDN)是电路板上最大型的导体,因此也是最容易发射及接收噪声的天线。
1.1“地弹”:是指芯片内部“地”电平相对于电路板“地”电平的变化现象。
以电路板“地”为参考,就像是芯片内部的“地”电平不断的跳动,因此形象的称之为地弹(groundbounce)。
当器件输出端由一个状态跳变到另一个状态时,地弹现象会导致器件逻辑输入端产生毛刺。
对于任何形式封装的芯片,其引脚必会存在电感电容等寄生参数,而地弹主要是由于GND引脚上的阻抗引起的。
集成电路的规模越来越大,开关速度不断提高,地弹噪声如果控制不好就会影响电路的功能,因此有必要深入理解地弹的概念并研究它的规律。
我们可以用下图来直观的解释一下。
图中开关Q的不同位置代表了输出的“0”“1”两种状态。
假定由于电路状态装换,开关Q接通RL低电平,负载电容对地放电,随着负载电容电压下降,它积累的电荷流向地,在接地回路上形成一个大的电流浪涌。
随着放电电流建立然后衰减,这一电流变化作用于接地引脚的电感LG,这样在芯片外的电路板“地”与芯片内的地之间,会形成一定的电压差,如图中VG。
这种由于输出转换引起的芯片A的输出变化,产生地弹。
这对芯片A的输入逻辑是有影响的。
接收逻辑把输入电压和芯片内部的地电压差分比较确定输入,因此从接收逻辑来看就象输入信号本身叠加了一个与地弹噪声相同的噪声。
高速电路信号完整性分析与设计九--电源完整性分析
第9章高速信号的电源完整性分析在电路设计中,设计好一个高质量的高速PCB板,应该从信号完整性(SI——Signal Integrity)和电源完整性(PI——Power Integrity )两个方面来考虑。
尽管从信号完整性上表现出来的结果较为直接,但是信号参考层的不完整会造成信号回流路径变化多端,从而引起信号质量变差,连带引起了产品的EMI性能变差。
这将直接影响最终PCB板的信号完整性。
因此研究电源完整性是非常必要和重要的。
9.1 电源完整性概述虽然电子设计的发展已经有相当长的历史,但是高速信号是近些年才开始面对的问题,随之出现的电源完整性的许多概念并不为大多数人所了解。
这里,对其中涉及到的一些基本名词做些简单的介绍。
9.1.1 电源完整性的相关概念电源完整性(Power Integrity) :是指系统供电电源在经过一定的传输网络后在指定器件端口相对该器件对工作电源要求的符合程度。
虽然电源完整性是讨论电源供给的稳定性问题,但由于地在实际系统中总是和电源密不可分的,通常把如何减少地平面的噪声也做为电源完整性的一部分讨论。
电源分配网络:电源分配网络的作用就是给系统内所有器件或芯片提供足够的电源,并满足系统对电源稳定性的要求。
同步开关噪声(Simultaneous Switch Noise,简称SSN):是指当器件处于开关状态,产生瞬间变化的电流(di/dt),在经过回流途径上存在的电感时,形成交流压降,从而引起噪声,所以也称为Δi噪声。
同步开关噪声包括电子噪声、地弹噪声、回流噪声、断点噪声等。
它对电源完整性的影响表现为地弹和电源反弹。
地弹噪声:它是同步开关噪声对电源完整性影响的表现之一。
是指芯片上的地参考电压的跳动。
当大量芯片的输出同时开启时,将有一个较大的瞬态电流在芯片与板的电源平面流过,芯片封装与电源平面的电感和电阻会引发电源噪声,这样会在真正的地平面(0V)上产生电压的波动和变化,这个噪声会影响其它元器件的动作。
《信号完整性与电源完整性的仿真分析与设计》
信号完整性与电源完整性的仿真分析与设计1简介信号完整性是指信号在通过一定距离的传输路径后在特定接收端口相对指定发送端口信号的还原程度。
在讨论信号完整性设计性能时,如指定不同的收发参考端口,则对信号还原程度会用不同的指标来描述。
通常指定的收发参考端口是发送芯片输出处及接收芯片输入处的波形可测点,此时对信号还原程度主要依靠上升/下降及保持时间等指标来进行描述。
而如果指定的参考收发端口是在信道编码器输入端及解码器输出端时,对信号还原程度的描述将会依靠误码率来描述。
电源完整性是指系统供电电源在经过一定的传输网络后在指定器件端口相对该器件对工作电源要求的符合程度。
同样,对于同一系统中同一个器件的正常工作条件而言,如果指定的端口不同,其工作电源要求也不同(在随后的例子中将会直观地看到这一点)。
通常指定的器件参考端口是芯片电源及地连接引脚处的可测点,此时该芯片的产品手册应给出该端口处的相应指标,常用纹波大小或者电压最大偏离范围来表征。
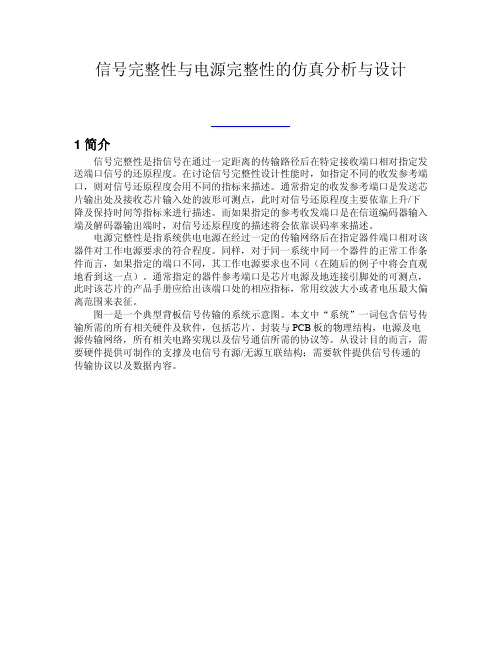
图一是一个典型背板信号传输的系统示意图。
本文中“系统”一词包含信号传输所需的所有相关硬件及软件,包括芯片、封装与PCB板的物理结构,电源及电源传输网络,所有相关电路实现以及信号通信所需的协议等。
从设计目的而言,需要硬件提供可制作的支撑及电信号有源/无源互联结构;需要软件提供信号传递的传输协议以及数据内容。
图1 背板信号传输的系统示意图在本文的以下内容中,将会看到由于这些支撑与互联结构对电信号的传输呈现出一定的频率选择性衰减,从而会使设计者产生对信号完整性及电源完整性的担忧。
而不同传输协议及不同数据内容的表达方式对相同传输环境具备不同适应能力,使得设计者需要进一步根据实际的传输环境来选择或优化可行的传输协议及数据内容表达方式。
为描述方便起见以下用“完整性设计与分析”来指代“信号完整性与电源完整性设计与分析”。
2 版图完整性问题、分析与设计上述背板系统中的硬件支撑及无源互联结构基本上都在一种层叠平板结构上实现。
DDR2与DDR3信号完整性及PCB设计

Signal Integrity and PCB layout considerations for DDR2-800 Mb/s and DDR3 MemoriesFidus Systems Inc.900, Morrison Drive, Ottawa, Ontario, K2H 8K7, CanadaChris Brennan, Cristian Tudor, Eric Schroeter, Heike Wunschmann, and Syed BokhariSession # 8.13AbstractThe paper addresses the challenge of meeting Signal Integrity (SI) and Power Integrity (PI) requirements of Printed Circuit Boards (PCBs) containing Double Data Rate 2 (DDR2) memories. The emphasis is on low layer count PCBs, typically 4-6 layers using conventional technology. Some design guidelines have been provided.1. IntroductionDDR2 usage is common today with a push towards higher speeds such as 800 Mbps [1] and more recently, 1066 Mbps. DDR3 [2] targets a data rate of 1600 Mbps. From a PCB implementation standpoint, a primary requirement is delay matching which is dictated by the timing requirement. This brings into it a number of related factors that affect waveform integrity and delay. These factors are interdependent, but where a distinction can be made, they can be termed PCB layer stackup and impedance, interconnect topologies, delay matching, cross talk, PI and timing. Cadence ALLEGRO™SI-230 and Ansoft’s HFSS™ are used in all computations.Table 1: Comparison of DDR2 and DDR3 requirementsSignals common to both technologies and a general comparison of DDR2 and DDR3 is shown in Table 1. It must be noted that “matching” includes cases where the clock net may be made longer (termed DELTA in ALLEGRO SigXP). We have assumed a configuration comprising a Controller and two SDRAMs in most illustrations that follow.2. PCB Layer stackup and impedanceIn a layer constrained implementation, a 4 layer PCB (Figure 1) is a minimum with all routing on TOP and BOTTOM layers. One of the internal layers will be a solid ground plane (GND). The other internal plane layer is dedicated to VDD. Vtt and Vref can be derived from VDD. Use of a 6-layer PCB makes the implementation of certain topologies easier. PI is also enhanced due to the reduced spacing between power and GND planes. The interconnect characteristic impedance for DDR2 implementation can be a constant. A single-ended trace characteristic impedance of 50 Ohms can be used for all single-ended signals. A differential impedance of 100 Ohms can be used for all differential signals, namely CLOCK and DQS. Further, the termination resistor pulled up to VTT can be kept at 50 Ohms and ODT settings can be kept at 50 Ohms.In the case of DDR3 however, single ended trace impedances of 40 and 60 Ohms used selectively on loaded sections of ADDR/CMD/CNTRL nets have been found to be advantageous. Further, the value of the termination resistor pulled up to Vtt needs to be optimized in combination with the trace impedance through SI simulations. Typically, it is in the range 30 – 70 Ohms. The differential trace impedance can remain at 100 Ohms.Figure 1 : Four and Six layer PCB stackup3. Interconnect TopologiesIn both cases of DDR2 and DDR3, DQ, DM and DQS signals are point-to-point and do not need any topological consideration. An exception is in the case of multi-rank Dual In Line Memory Modules (DIMMs). Waveform integrity is also easily addressed by a proper choice of drive strengths and On Die Termination (ODT). The ADDR/CMD/CNTRL signals, and sometimes the clock signal will involve a multipoint connection where a suitable topology is needed. Possible choices are indicated in Figure 2 for cases involving two SDRAMs. The Fly-By Topology is a special case of a daisy chain with a very short or no stub.For DDR3, any of these topologies will work, provided that the trace lengths are minimized. The Fly-by topology shows the best waveform integrity in terms of an increased noise margin. This can be difficult to implement on a4-layer PCB and the need for a 6-layer PCB arises. The daisy chain topology is easier to implement on a 4 layer PCB. The tree topology on the other hand requires the length of the branch AB to be very close to that of AC (Figure 2). Enforcing this requirement results in the need to increase the length of the branches which affects waveform integrity. Therefore, for DDR3 implementation, the daisy chain topology with minimized stubs proves to be best suited for 4-layer PCBs.For DDR2-800 Mbps any of these topologies are applicable with the distinction between each other being less dramatic. Again, the daisy chain proves to be superior in terms of both implementation as well as SI.Where more than two SDRAMs are present, often, the topology can be dictated by constraints on device placement. Figure 3 shows some examples where a topology could be chosen to suit a particular component placement. Of these, only A and D are best suited for 4-layer PCB implementation. Again, for DDR2-800 Mbps operations all topologies yield adequate waveform integrity. For a DDR3 implementation, in particular at 1600 Mbps, only D appears to be feasible.Vtt RtRtRtTree topology Fly-By topologyFigure 2: ADDR/CMD/CNTRL topologies with 2 SDRAMS(A)Figure 3: ADDR/CMD/CNTRL topologies with four SDRAMS4. Delay matchingImplementing matched delay is usually carried out by bending a trace in a trombone shape. Routing blockage may require layer jumping. Unfortunately, while physical interconnect lengths can be made identical in layout, electrically, the two configurations shown in Figure 4 will not be the same.The case of trombone delay has been well understood, and the case of a via is obvious. The delay of a trombone trace is smaller than the delay of a straight trace of the same center-line length. In the case of a via, the delay is more than that of a straight microstrip trace of length equal to the via length. The problem can be resolved in two different ways. In the first approach, these values can be pre-computed precisely and taken into account while delay matching. This would become a tedious exercise which could perhaps be eased with userRtRtRt(B)(C)(D)Rtdefined constraints in ALLEGRO 16.0. In the second approach, one would use means to reduce the disparity to an acceptable level.Trombone traceStraight traceL 3L 2 L 4 ≠L 1L 5Figure 4: Illustration of Trombone traces and ViasFigure 5: Circuit for estimation of trombone effect and resulting waveforms.≠Straight traceVia cross sectional viewConsider the case of a trombone trace. It is known that the disparity can be reduced by increasing the length of L3 (Figure 4). Details can be found in reference [3]. A simulation topology can be set up in SigXP to represent parallel arms of a trombone trace as coupled lines. A sweep simulation is carried out with L3 (S in Figure 5) as a variable and the largest reasonable value that reduces the delay difference with respect to a reference trace is selected. For microstrip traces, L3 > 7 times the distance of the trace to ground is needed.Delay values are affected in a trombone trace due to coupling between parallel trace segments. Another way to reduce coupling without increasing the spacing is to use a saw tooth profile. The saw tooth profile shows better performance as compared to a trombone although it eventually ends up requiring more space. In either case, it is possible to estimate the effect on delay precisely by using a modified equation for the computation of the effective trace length [3]. This would need to be implemented as a user defined constraint in ALLEGRO. Consider the case of a through hole via on the 6 layer stackup of Figure 2. Ground vias placed close to the signal vias play an important role in the delay. For the illustration, the microstrip traces on TOP and BOTTOM layers are 150 mils long, and 4 mils wide. The via barrel diameter = 8 mils, pad diameter is 18 mils and the anti-pad diameter is 26 mils.Three different cases are considered. In the first case, the interconnect with via does not have any ground vias in its immediate neighborhood. Return paths are provided at the edges of the PCB 250 mils away from the signal via. In the second case, a reference straight microstrip trace of length = 362 mils is considered. The third case is the same as case 1 with four ground vias in the neighborhood of the signal via. Computed s-parameters with 60 Ohm normalization are shown in Figure 6. It can be seen that the use of 4 ground vias surrounding the signal via makes its behavior more like a uniform impedance transmission line and improves the s21 characteristic. In the absence of a return path in the immediate neighborhood, the via impedance increases. For the present purpose, it is important to know the resulting impact on the delay.A test circuit is set up similar to Figure 5. The driver is a linear source of 60 Ohms output impedance and outputs a trapezoidal signal of rise time = fall time = 100 ps and amplitude = 1V. It is connected to each of the 3 interconnects shown in Figure 6 and the far end is terminated in a 60 Ohm load. The excitation is a periodic signal with a frequency of 800 MHz. The time difference between the driver waveform at V = 0.5 V and the waveform at the receiver gives the switched delay.Results are illustrated in Figure 7 where only the rising edge is shown. It can be seen that the delay with four neighboring ground vias differs from that of the straight trace by 3 ps. On the other hand, the difference is 8 ps for the interconnect with no ground vias in the immediate neighborhood.It is therefore clear that increasing the ground via density near signal vias will help. However, in the case of 4 layer PCBs, this will not be possible as the signal traces adjacent to the Power plane will be referenced to a Power plane. Consequently, the signal return path would depend on decoupling. Therefore, it is very important that the decoupling requirement on 4 layer PCBs addresses return paths in addition to meeting power integrity requirements.The clock net is differential in both DDR2 and DDR3. In DDR2, DQS can be either single ended or differential although it is usually implemented as differential at higher data rates. The switched delay of a differential trace is less than that of a single ended trace of identical length. Where timing computations indicate the need, the clock and DQS traces may need to be made longer than the corresponding ADDR/CMD/CNTRL nets and DATA nets. This would ensure that the clock and DQS transitions are centered on the associated ADDR/CMD/CNTRL nets and DQ nets.Since DQ and DM nets run at the maximum speed, it is desirable that all of these nets in any byte lane be routed identically, preferably without vias. Differential nets are less sensitive to discontinuities and where layer jumping is needed, the DQS and CLOCK nets should be considered first.Figure 6: s-parameters of interconnects with vias (60 Ohm normalization)Figure 7: Driver and Receiver waveforms for the 3 cases of Figure 6. (Plot colors correspond)5. CrosstalkCross talk contributes to delay uncertainty being significant for microstrip traces. This is generally reduced by increasing the spacing between adjacent traces for long parallel runs. This has the drawback of increasing the total trace length and therefore a reasonable value must be chosen. Typically the spacing should be greater than twice the trace distance to ground. Again, ground vias play an important role. Near and far end coupling levels are illustrated in Figure 8. Use of multiple ground vias reduces coupling levels by 7 dB. To derive the interconnect budget, a simulation of a victim trace with two aggressors on both sides is adequate. Using a periodic excitation on all nets will yield the cross talk induced jitter. Using a pseudo random excitation on all nets will show the effect of both cross talk as well as data dependencies. Time domain results are not shown here, but it is easily done by setting up a 5 coupled line circuit in SigXP with the spacing between traces set up for sweeping. Reasonable spacing values that keep the jitter in the waveform due to both cross talk as well as pattern dependence at an acceptable level are chosen.Figure 8: s-parameters of coupled traces (60 Ohm normalization)6. Power IntegrityPower Integrity here refers to meeting the Power supply tolerance requirement under a maximum switching condition. Failure to address this requirement properly leads to a number of problems, such as increased clock jitter, increased data dependent jitter, and increased cross talk all of which eventually reduce timing margins.The theory for decoupling has been very well understood and usually starts with the definition of a “target impedance” as [4]CurrentTransient tolerance Voltage Z et t =arg (1)An important requirement here is knowledge of the transient current under worst case switching condition. A second important requirement is the frequency range. This is the range of frequencies over which the decoupling network must ensure that its impedance value is equal to or below the required target impedance. On a printed circuit board, capacitance created by the Power-Ground sandwich and the decoupling capacitors needs to handle a minimum frequency of ~100 kHz up to a maximum frequency of ~100-200 MHz. Frequencies below 100 kHz are easily addressed by the bulk capacitance of the voltage regulator module. Frequencies above 200 MHz should be addressed by the on-die and in some cases on-package decoupling capacitance. Due to the finite inductance of the package, there is no need to provide decoupling on the PCB to handle frequencies greater than 200 MHz. The actual computation of power integrity can be very complex involving IC package details, simultaneously switched signals and the PCB power distribution network. For PCB design, the use of the target impedance approach to decoupling design is simpler and provides a practical solution with very little computational effort.The three power rails of concern are the VDD, VTT and Vref. The tolerance requirements on the VDD rail is ~ 5% and the transient current is determined as the difference between Idd7 and Idd2 as specified by JEDEC [1,4]. This is accomplished by using plane layers for power distribution and a modest number of decoupling capacitors. It is preferable to use decoupling capacitors of 10 different values distributed in the range of 10 nF to 10 uF. Further, the capacitor pad mounting structure should be designed for reduced mounted inductance.The Vref rail has a tighter tolerance, but it draws very little current. Its target impedance is easily met using narrow traces and one or two decoupling capacitors. It is important however that the capacitors be located very close to the device pins.The VTT rail proves to be challenging because it not only has a tighter tolerance, but it also draws a transient current close to that of the VDD rail. The transient current is easily calculated as described in reference [5]. Again, the target impedance requirement can be met using an increased number of decoupling capacitors.On a 4 layer PCB, the planes are too far apart and consequently the advantage of inter-plane capacitance is lost. The number of decoupling capacitors needs to be increased and higher frequency capacitors with values less than 10 nF may be needed. These computations are easily done using ALLEGRO SI Power Integrity option.7. TimingTiming computation is carried out as described in reference [6]. A table needs to be setup for the following eight cases: 1. 2. 3. 4. 5. 6. 7. 8. Write Setup analysis DQ vs. DQS Write Hold analysis DQ vs. DQS Read Setup analysis DQ vs. DQS Read Hold analysis DQ vs. DQS Write Setup analysis DQS vs. CLK Write Hold analysis DQS vs. CLK Write Setup analysis ADDR/CMD/CNTRL vs. CLK Write Hold analysis ADDR/CMD/CNTRL vs. CLKAn example is shown for the case of Write setup analysis in Table 2. Actual numbers have been omitted as they are not precisely known yet for DDR3. These numbers are obtained from data sheets of Controller and memory manufacturers. The numbers in the interconnect section are determined by SI simulations. All the eight cases need to be analyzed for DDR2. For DDR3, 5 and 6 are not needed due to its write leveling feature. In the PCB implementation, length match tolerances must ensure that the total margin is positive. ElementControllerSkew Componenta.)DQ vs. DQS skew at transmitter output b.) Data / Strobe PLL jitter a+b Setup requirement (tDSb @ Vih/Vil level) DQ slew rate DQS slew rateSetupUnitsps ps ps psCommentsFrom controller design data Used if not included in transmitter skewTotal Controller SDRAM (or DIMM)V/ns V/ns psTotal SDRAM setup requirement InterconnecttDSb + slew rate adjustmentFrom SDRAM datasheet; this number is to be adjusted based on DQ and DQS slew rates Measured as per JEDEC specification from SI simulation results Measured as per JEDEC specification from SI simulation results Includes slew rate adjustmenta.) Data Xtalk b.) DQS Xtalk c.) Length matching tolerance d.) Characteristic impedance mismatch Total Interconnect Min. Total Setup Budget Setup margin Interconnect skew (a + b + c + d) 0.24*tckps ps ps ps2 aggressors (one each side of the victim); victim – repetitive; aggressor- PRBS 2 aggressors (one each side of the victim); victim – repetitive; aggressor- PRBS Extracted from SI simulation results longest data net, worst case PVT corner can be omitted if routing of DQ and corresponding DQS signals are done on same layerps ps From SDRAM datasheet (includes clock duty cycle variation) Must be positiveMin. Total Setup Budget – (Total Controller + Total SDRAM + Total Interconnect )psTable 2: Illustration of DDR3 Write Setup timing analysis summary for DQ vs. DQS8. PCB LayoutImplementation on a PCB involves a number of tradeoffs to meet SI requirements. Often, the question is how far does one need to go? PCB layout tasks are facilitated using the following approach: 1. Set up topology and constraints in ALLEGRO Constraint Manager. 2. Design Controller BGA breakout. A controller pin arrangement with ADDR/CMD/CNTRL pins in the middle and DQ/DQS/DM byte lanes on either side is best suited. Within these groups, individual pins may need to be swapped to ensure routing with minimum cross-over. 3. Attempt routing with reduced stub length and a minimum trace spacing as obtained from cross talk simulation. Often, most stubs can be eliminated but it will not be possible for all the pins. One may try two traces between BGA pads of the memory devices. This would require narrow PCB traces which can increase manufacturing cost. Yet, it will not be possible for all signals unless micro via and via-in-pad technology is used. Complete routing with coarse length matching tolerances. 4. Place Vref decoupling capacitors close to the Vref pins. Vtt decoupling can be placed at the far end of the last SDRAM and will not come in the way of routing. VDD decoupling can be placed close to devices where possible without blocking routing channels. The smaller valued capacitors should be placed closer to the devices. With a proper decoupling design, it will not be necessary to cram all capacitors close to the devices. All decoupling capacitors should use a fan out for the footprint designed for reduced inductance. This is typically two short wide traces perpendicular to the capacitor length. This can be automated by using a user defined capacitor footprint that can be attached to all the decoupling capacitors in the schematic. 5. Implement fine length matching and insert multiple ground vias where signal traces jump layers. It is better to use the delay matching option in ALLEGRO and one must include z-axis delay. Typically, P and N nets of differential pairs should be matched with a tolerance of +/- 2ps and the tolerance for all other matched nets can be +/- 10 ps or more based on the timing margin computation.9. DIMMConsiderations described above apply to the case of PCBs containing one or more DIMMs. The only exception is that the decoupling requirement for the memories can be relaxed as it is already accounted for on the DIMM PCB. SI analysis of registered DIMMs is also much simpler where the DIMM is treated as a single load. While the routing topology for ADDR/CMD/CNTRL nets is usually a daisy chain with reduced stubs, tree topologies can also be used for registered DIMMs. Analysis of un-buffered DIMMs can become tedious as the timing requirement at all the SDRAMs must be analyzed. DIMM routing on 4-layer PCBs is relatively simpler compared to the case of SDRAMs.10. ExamplesThe detail described above has been used in the implementation of a DDR2 PCB, a DDR3 PCB and a DDR3 – DIMM PCB. The controller is from MOSAID [7] which is designed to provide both DDR2 as well as DDR3 functionality. For the SI simulations, IBIS models have been used. Models for the memories are from MICRON Technology, Inc [8]. The IBIS models for the DDR3 SDRAMs were available at 1333 Mbps speed. These were used at 1600 Mbps. For the unbuffered DDR3 DIMM (MT_DDR3_0542cc) EBD models from Micron Technology were used. All waveforms are for the typical case and are computed at the SDRAM die. The 6 layer PCB stackup of Figure 2 is used with routing on TOP and BOTTOM layers only. The memory consists of 2 SDRAMsrouted as a daisy chain. In the case of the DIMM, a single unbufferred DIMM is used. TOP/BOTTOM layer routing and Signal Integrity waveforms are shown in Figures. 9-11.Snapshots ofFigure 9: Illustration of TOP and BOTTOM layers of a DDR3 PCB with computed waveforms at the farthest SDRAM. Waveform on left is an ADDRESS net compared to that of the CLOCK net. Waveform on the right is a DATA net compared to that of a DQS net. Clock frequency = 800 MHz and data rate is 1600 Mbps.Figure 10: Illustration of TOP and BOTTOM layers of a DDR2 PCB with computed waveforms at the farthest SDRAM. Waveform on left is an ADDRESS net compared to that of the CLOCK net. Waveform on the right is a DATA net compared to that of a DQS net. Clock frequency = 400 MHz and data rate is 800 Mbps.Figure 11: Illustration of TOP and BOTTOM layers of a DDR3 – DIMM PCB with computed waveforms at the 8th (last) SDRAM on DIMM. Waveform on left is an ADDRESS net compared to that of the CLOCK net. Waveform on the right is a DATA net compared to that of a DQS net.Lastly, Figure 12 shows a comparison of computed and measured DATA eye patterns of an 800 Mbps DDR2. In all cases waveform integrity can be seen to be excellent.Figure 12: Computed (Red) and Measured (blue) waveforms of a data net of an 800 Mbps DDR2 PCB.11. ConclusionIn this paper, all aspects related to SI, and PI of DDR2 and DDR3 implementation have been described. Use of Constraint Manager in ALLEGROTM makes implementation easy. While a four layer PCB implementation of 800 Mbps DDR2 and DDR3 appears to be feasible, DDR3-1600 Mbps will prove to be challenging. It will become clearer as the memory devices become available and one has a good handle on timing numbers.References[1] DDR2 SDRAM Specification, JEDEC JESD79-2B, January 2005. [2] DDR3 SDRAM Standard, JEDEC JESD79-3, June 2007. [3] Syed Bokhari, “Delay matching on Printed Circuit Boards”, Proceedings of the CDNLIVE 2006, San Jose. [4] Larry D Smith, and Jeffrey Lee, “Power Distribution System for JEDEC DDR2 memory DIMM, Proc. IEEE EPEP conference, Princeton, N.J., pp. 121-124, October 2003. [5] Hardware and layout design considerations for DDR2 SDRAM Memory Interfaces, Freescale semiconductor Application Note, Doc. No. AN2910, Rev. 2, 03/2007. [6] DDR2 design guide for 2 DIMM systems, Technical Note, Micron Technology Inc. TN-47-01, 2003. [7] /corporate/products-services/ip/SDRAM_Controller_whitepaper_Oct_2006.pdf [8] /products/dram/ddr2/partlist.aspx?speed=DDR2-800 [9] /products/dram/ddr3/partlist.aspx?speed=DDR3-1066。
DDR设计检讨思路
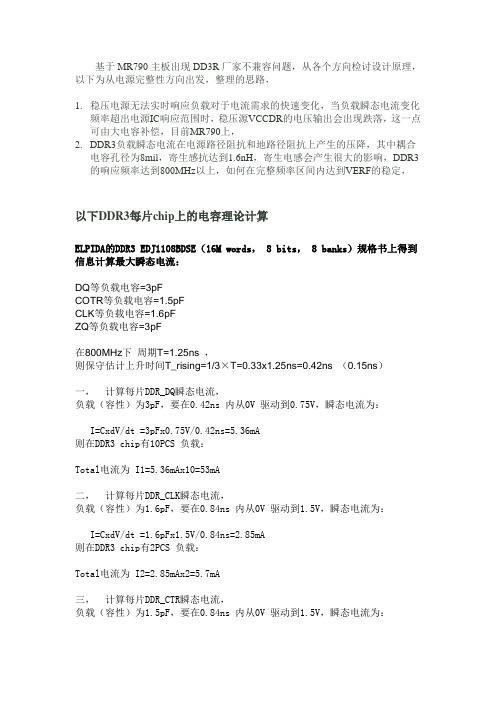
基于MR790主板出现DD3R厂家不兼容问题,从各个方向检讨设计原理,以下为从电源完整性方向出发,整理的思路,1.稳压电源无法实时响应负载对于电流需求的快速变化,当负载瞬态电流变化频率超出电源IC响应范围时,稳压源VCCDR的电压输出会出现跌落,这一点可由大电容补偿,目前MR790上,2.DDR3负载瞬态电流在电源路径阻抗和地路径阻抗上产生的压降,其中耦合电容孔径为8mil,寄生感抗达到1.6nH,寄生电感会产生很大的影响,DDR3的响应频率达到800MHz以上,如何在完整频率区间内达到VERF的稳定,以下DDR3每片chip上的电容理论计算ELPIDA的DDR3 EDJ1108BDSE(16M words, 8 bits, 8 banks)规格书上得到信息计算最大瞬态电流:DQ等负载电容=3pFCOTR等负载电容=1.5pFCLK等负载电容=1.6pFZQ等负载电容=3pF在800MHz下周期T=1.25ns ,则保守估计上升时间T_rising=1/3×T=0.33x1.25ns=0.42ns (0.15ns)一,计算每片DDR_DQ瞬态电流,负载(容性)为3pF,要在0.42ns 内从0V 驱动到0.75V,瞬态电流为:I=CxdV/dt =3pFx0.75V/0.42ns=5.36mA则在DDR3 chip有10PCS 负载:Total电流为 I1=5.36mAx10=53mA二,计算每片DDR_CLK瞬态电流,负载(容性)为1.6pF,要在0.84ns 内从0V 驱动到1.5V,瞬态电流为:I=CxdV/dt =1.6pFx1.5V/0.84ns=2.85mA则在DDR3 chip有2PCS 负载:Total电流为 I2=2.85mAx2=5.7mA三,计算每片DDR_CTR瞬态电流,负载(容性)为1.5pF,要在0.84ns 内从0V 驱动到1.5V,瞬态电流为:I=CxdV/dt =1.5pFx1.5V/0.84ns=2.67mA则在DDR3 chip有26PCS 负载:Total电流为 I3=2.67mAx26=69.6mA同理ZQ pin 上容抗3pF ,则电流近似为5.36mA总共每片DDR3需要瞬间电流Imax=I1+I2+I3=53.6+5.7+69.6+5.36=134.26mA再来DDR电源1.5V,SPEC允许波动电压为5% ,保守定义为2.5%。
针对DDR和DDR的CB信号完整性设计入门介绍

针对DDR2-800和DDR3的PCB信号完整性摘要本文章主要涉及到对DDR2和DDR3在设计印制线路板(PCB)时,考虑信号完整性和电源完整性的设计事项,这些是具有相当大的挑战性的。
文章重点是讨论在尽可能少的PCB 层数,特别是4层板的情况下的相关技术,其中一些设计方法在以前已经成熟的使用过。
1.介绍目前,比较普遍使用中的DDR2的速度已经高达800Mbps,甚至更高的速度,如1066Mb ps,而DDR3的速度已经高达1600Mbps。
对于如此高的速度,从PCB的设计角度来讲,要做到严格的时序匹配,以满足波形的完整性,这里有很多的因素需要考虑,所有的这些因素都是会互相影响的,但是,它们之间还是存在一些个性的,它们可以被分类为PCB叠层、阻抗、互联拓扑、时延匹配、串扰、电源完整性和时序,目前,有很多EDA工具可以对它们进行很好的计算和仿真,其中CadenceALLEGROSI-230和Ansoft’sHFSS使用的比较多。
表1:DDR2和DDR3要求比较表1显示了DDR2和DDR3所具有的共有技术要求和专有的技术要求。
2.PCB的叠层(stackup)和阻抗对于一块受PCB层数约束的基板(如4层板)来说,其所有的信号线只能走在TOP和BO TTOM层,中间的两层,其中一层为GND平面层,而另一层为VDD平面层,Vtt和Vref在VDD平面层布线。
而当使用6层来走线时,设计一种专用拓扑结构变得更加容易,同时由于Power层和GND层的间距变小了,从而提高了PI。
互联通道的另一参数阻抗,在DDR2的设计时必须是恒定连续的,单端走线的阻抗匹配电阻50Ohms必须被用到所有的单端信号上,且做到阻抗匹配,而对于差分信号,100Ohms 的终端阻抗匹配电阻必须被用到所有的差分信号终端,比如CLOCK和DQS信号。
另外,所有的匹配电阻必须上拉到VTT,且保持50Ohms,ODT的设置也必须保持在50Ohms。
ddr3 电路设计
ddr3 电路设计
DDR3是一种双数据速率(Double Data Rate)的SDRAM(同步
动态随机存取存储器),它具有高速、高密度和低功耗的特点。
在
进行DDR3电路设计时,需要考虑以下几个方面:
1. 时序设计,DDR3内部时序非常严格,需要精确的时钟控制
和信号同步。
在电路设计中,需要确保时钟信号的准确性和稳定性,同时要考虑数据和控制信号的延迟和对齐。
2. 信号完整性,DDR3的高速传输需要考虑信号完整性,包括
信号的传输线路设计、阻抗匹配、信号串扰和噪声抑制等方面。
在
电路设计中需要合理布局PCB,减小信号传输路径的长度,采用差
分信号传输等方法来提高信号完整性。
3. 电源和接地设计,DDR3需要提供稳定的电源和接地,以确
保芯片的正常工作。
在电路设计中需要考虑电源线和接地线的布局
和连接方式,减小电源噪声和提高电源供电的稳定性。
4. 自校准和时序校准,DDR3内部具有自校准和时序校准的功能,可以校正时钟和数据信号的偏移和延迟。
在电路设计中需要考
虑这些校准功能的实现和控制。
5. 热管理,DDR3在高速运行时会产生较多的热量,需要考虑散热设计,包括散热片的设计和散热风扇等。
总之,DDR3电路设计需要全面考虑时序、信号完整性、电源和接地、自校准和时序校准、热管理等多个方面,以确保DDR3芯片的正常工作和高速稳定传输。
DDR3高速并行总线的信号与电源完整性分析的开题报告
DDR3高速并行总线的信号与电源完整性分析的开题报告Title: Signal and Power Integrity Analysis of DDR3 High-SpeedParallel BusIntroduction:DDR3 (Double Data Rate 3) is a type of synchronous dynamic random-access memory (SDRAM) that is widely used in many electronicdevices such as computers, smartphones, and gaming consoles. DDR3uses a high-speed parallel bus to transfer data between the memory controller and memory modules. The signal and power integrity of thisbus are critical for system performance, reliability, and stability.Therefore, it is important to analyze and optimize the DDR3 bus designto ensure proper signal and power integrity.Objectives:The objectives of this project are to analyze the signal and powerintegrity of DDR3 high-speed parallel bus using simulation and measurement techniques, and to optimize the bus design for improved performance, reliability, and stability. Specific objectives include:1. Analyze the signal integrity of the DDR3 bus using simulationsoftware such as HyperLynx, to identify signal reflections, crosstalk, andother impairments that can cause signal degradation and errors.2. Analyze the power integrity of the DDR3 bus using simulationsoftware such as PowerSI or RedHawk, to identify power distributionnetwork (PDN) and power noise issues that can cause voltage drops,ground bounces, and other power-related problems.3. Conduct measurements of the DDR3 bus using a high-speed oscilloscope and other measurement tools, to validate the simulation results and identify real-world issues that may affect signal and power integrity.4. Optimize the DDR3 bus design based on simulation and measurement results, by adjusting layout, component selection, termination schemes, and other parameters to improve signal and power integrity.Methods:This project will follow the following methods and approach:1. Literature review of DDR3 memory and high-speed bus design principles, including signal and power integrity requirements, simulation techniques, and measurements.2. Simulation of the DDR3 bus using software tools such as HyperLynx and PowerSI or RedHawk, to analyze signal and power integrity issues and optimize the bus design.3. Measurements of the DDR3 bus using a high-speed oscilloscope and other measurement tools, to validate the simulation results and identify real-world issues.4. Optimization of the DDR3 bus design based on simulation and measurement results, using layout, component selection, termination schemes, and other parameters.Expected outcomes:The expected outcomes of this project are:1. Improved understanding of DDR3 memory and high-speed bus design principles, including signal and power integrity requirements, simulation techniques, and measurements.2. Identification of signal and power integrity issues in the DDR3 bus design using simulation and measurement techniques.3. Optimization of the DDR3 bus design for improved signal and power integrity, by adjusting layout, component selection, termination schemes, and other parameters.4. Recommendations for future DDR3 bus designs, based on the findings of this project.Conclusion:The signal and power integrity of DDR3 high-speed parallel bus are critical for system performance, reliability, and stability. This project will analyze and optimize the DDR3 bus design using simulation and measurement techniques, to improve signal and power integrity and provide recommendations for future DDR3 bus designs.。
信号完整性与电源完整性的仿真分析与设计.doc
信号完整性与电源完整性的仿真分析与设计信号完整性是指信号在通过一定距离的传输路径后在特定接收端口相对指定发送端口信号的还原程度。
在讨论信号完整性设计的性能时,如果指定不同的收发参考端口,就要用不同的指标来描述信号还原程度。
通常情况下指定的收发参考端口是发送芯片输出处及接收芯片输入处的波形可测点,此时,主要使用上升/下降及保持时间等指标来描述信号还原程度。
当指定的参考收发端口是信道编码器输入端及解码器输出端时,就要用误码率来描述信号还原程度。
电源完整性是指系统供电电源在经过一定的传输网络后在指定器件端口相对该器件对工作电源要求的符合程度。
同样,对于同一系统中的同一个器件,如果指定的端口不同,那么对正常工作的电源要求也不同。
通常情况下指定的器件参考端口是芯片电源及地连接引脚处的可测点,此时该芯片的手册中应给出该端口处的相应指标,常用的有纹波大小或电压最大偏离范围。
一个典型背板信号传输的系统示意图如图1所示。
本文中系统一词包含信号传输所需的所有相关硬件及软件,包括芯片、封装与PCB板的物理结构,电源及电源传输网络,所有相关电路实现以及信号通信所需的协议等。
在设计时,需要硬件提供可制作的支撑及电信号有源/无源互联结构;需要软件提供信号传递的传输协议以及数据内容。
但是,由于这些支撑与互联结构会对电信号的传输呈现出一定的频率选择性衰减,因此,会对信号及电源的完整性产生影响。
同时,在相同的传输环境下,不同传输协议及不同数据内容的表达方式具有不同的适应能力,因此,需要进一步根据实际的传输环境来选择或优化可行的传输协议及数据内容表达方式。
图1 背板信号传输的系统示意图版图完整性问题、分析与设计上述背板系统中的硬件支撑及无源互联结构基本上都在一种层叠平板结构上实现。
这种层叠平板结构可以由3类元素组成:正片结构、负片结构及通孔。
正片结构有时也被称为信号层,该层上的走线大多为不同逻辑连接的信号线或离散的电源线,在制版光刻中所有的走线都会以相同图形的方式出现;负片结构有时也被称为平面层(细分为电源平面层和地平面层),该层上基本是相同逻辑的一个或少数几个连接(通常是电源连接或地连接),用大面积敷铜的方式实现,在光刻工艺中用相反图形来表示;通孔用来进行不同层之间的物理连接。
DDR3与FPGA接口的高速电路板信号完整性分析
writing data of DDR3 SDRAM,the signal integrity problems of reflection and crosstalk in high⁃speed PCB design are elaborated.
With the SPECCTRAQuest simulator made by Cadence Company as the simulation tool,the method of suppressing the reflection
(1. School of Communication and Information Engineering,Xi’an University of Posts and Telecommunications,Xi’an 710061,China;
2. The Fourth Research Institute of China Aerospace Science and Technology Corporation,Xi’an 710121,China)
中图分类号:TN911.6⁃34;TN919
文章编号:1004⁃373X(2017)22⁃0010⁃04
文献标识码:A
Signal integrity analysis of high⁃speed circuit board interconnecting DDR3 and FPGA
JIN Shuai1,HAN Liangang2,XIE Xihai1
计以及信号完整性分析。
1
硬件平台组成
本 文 主 要 研 究 的 硬 件 平 台 是 通 过 FPGA 控 制 器 来
实现对 DDR3 SDRAM 进行数据读写的 PCB 板。
- 1、下载文档前请自行甄别文档内容的完整性,平台不提供额外的编辑、内容补充、找答案等附加服务。
- 2、"仅部分预览"的文档,不可在线预览部分如存在完整性等问题,可反馈申请退款(可完整预览的文档不适用该条件!)。
- 3、如文档侵犯您的权益,请联系客服反馈,我们会尽快为您处理(人工客服工作时间:9:00-18:30)。
DesignCon 2011Signal and Power Integrity for a 1600 Mbps DDR3 PHY in Wirebond Package June Feng, Rambus Inc.[Email: jfeng@]Ralf Schmitt, Rambus Inc.Hai Lan, Rambus Inc.Yi Lu, Rambus Inc.AbstractA DDR3 interface for a data rate of 1600MHz using a wirebond package and a low-cost system environment typical for consumer electronics products was implemented. In this environment crosstalk and supply noise are serious challenges and have to be carefully optimized to meet the data rate target. We are presenting the signal and power integrity analysis used to optimize the interface design and guarantee reliable system operation at the performance target under high-volume manufacturing conditions. The resulting DDR3 PHY was implemented in a test chip and achieves reliable memory operations at 1600MHz and beyond.Authors BiographyJune Feng received her MS from University of California at Davis, and BS from Beijing University in China. From 1998 to 2000, she was with Amkor Technology, Chandler, AZ. She was responsible for BGA package substrate modeling and design and PCB characterization. In 2000, she joined Rambus Inc and is currently a senior member of technical staff. She is in charge of performing detailed analysis, modeling, design and characterization in a variety of areas including high-speed, low cost PCB layout and device packaging. Her interests include high-speed interconnects modeling, channel VT budget simulation, power delivery network modeling and high-frequency measurements.Ralf Schmitt received his Ph.D. in Electrical Engineering from the Technical University of Berlin, Germany. Since 2002, he is with Rambus Inc, Los Altos, California, where he is a Senior Manager leading the SI/PI group, responsible for designing, modeling, and implementing Rambus multi-gigahertz signaling technologies. His professional interests include signal integrity, power integrity, clock distribution, and high-speed signaling technologies.Hai Lan is a Senior Member of Technical Staff at Rambus Inc., where he has been working on on-chip power integrity and jitter analysis for multi-gigabit interfaces. He received his Ph.D. in Electrical Engineering from Stanford University, M.S. in Electrical and Computer Engineering from Oregon State University, and B.S. in Electronic Engineering from Tsinghua University in 2006, 2001, and 1999, respectively. His professional interests include design, modeling, and simulation for mixed-signal integrated circuits, substrate noise coupling, power and signal integrity, and high-speed interconnects.Yi Lu is a senior systems engineer at Rambus Inc. He received the B.S. degree in electrical engineer and computer science from U.C. Berkeley in 2002 with honors. In 2004, he received the M.S. degree in electrical engineering from UCLA, where he designed and fabricated a 3D MEMS microdisk optical switch. Since joining Rambus in 2006, he has been a systems engineer designing various memory interfaces including XDR1/2 and DDR2/3.IntroductionThe memory bandwidth requirement of multimedia consumer electronic products like HDTV systems is constantly increasing, driven by the adoption of advanced features like frame rate up-scaling and 3D projection. At the same time, consumer electronic products remain very cost sensitive, targeting low-cost package and system environment to reduce the overall bill of materials. This creates the need for high-speed memory interfaces implemented in low-cost system environments. In order to address this need we have designed a 1600 Mbps DDR3 memory interface PHY in a wirebond package targeting a low-cost system environment with a 4-layer PCB stack-up typical for cost-optimized consumer electronic products.Designing a DDR3 memory interface for such a high data rate is not trivial. The memory device itself requires more than 40% of the bit time for internal timing, leaving little more than half of the bit time for all channel and PHY timing errors. Meeting these requirements in a wirebond package, using a 4-layer PCB stackup, is a serious challenge. Bond wire coupling in the package and coupling in the PCB routing, which only allows a microstrip routing in a 4-layer stackup, lead to increased crosstalk in the interface system. Additionally, the bond wire inductance leads to higher supply noise, causing power supply induced jitter (PSIJ) as well as simultaneous switching output (SSO) noise in the interface system. The interface design therefore requires a careful optimization of signal and power integrity in the entire system, from the controller PHY to the DRAM component pin.In this paper we will present the signal and power integrity analysis used to optimize the interface design and assuring reliable operation at the target data rate in a low-cost system environment. First we will present the analysis of power supply induced jitter. For this, we analyzed the supply noise spectrum generated in the system and the sensitivity of the system to this noise. With this analysis we were able to predict and optimize the jitter in the PHY, making sure the PHY will meet the tight jitter requirements of the DRAM device.Next we analyze the channel margin loss due to ISI, crosstalk, and SSO. Special emphasize is given to crosstalk and SSO noise, since these are the major contribution to margin loss in the channel timing. A careful optimization of PHY floor plan, package design, and PCB routing was implemented to minimize the margin loss due to crosstalk and SSO.Finally, the system timing was verified for the full range of process variations of the controller PHY and channel parameter variations for low-cost system environments typical for cost-sensitive consumer electronics products. This analysis provides the confidence that the final system will meet the target performance with high yield under High-Volume Manufacturing conditions.The DDR3 PHY was implemented on a test chip and achieves reliable memory operation for a data rate of 1866 Mbps using DDR3 memories of a 1600 Mbps speed grade.I.System Environment and SI/PI ChallengesThe design target of the DDR3 PHY described in this paper are high-performance consumer electronic systems with a bandwidth requirement of up to 6.4GB/s in a low-cost system environment. This bandwidth is achieved using a x32 PHY running at a data rate of 1600Mbps.In order to support a low system cost implementation, the PHY was designed in a 4-layer wirebond package. Such a package is significantly less expensive than flip-chip packages, however it poses challenges for signal and power integrity especially at higher data rates. Additionally, the PHY is designed for a PCB with only 4 layers, further reducing the final system cost. Finally, silicon area, pad count, and decoupling requirements are carefully optimized to minimize total system cost for the memory subsystem.The goal for this design effort was to achieve a PHY implementation that will reliable achieve the targeted data rate under high volume manufacturing (HVM) conditions using any DDR3 DRAM meeting the JEDEC spec at the targeted data rate. In order to meet this goal it was not enough to design and analyze the PHY alone. Instead, the PHY had to be analyzed in the targeted system environment, optimizing system and PHY implementation concurrently. Closing the voltage and timing budget on the system level resulted in PHY design requirements necessary to achieve the targeted interface system performance in the final implementation using a low-cost system environment.Creating a cost-efficient high-speed memory interface requires careful analysis of power and system integrity [1]. The bond wires in a wirebond package contribute significantly to the inductance of the power distribution network (PDN) of the interface. Inductance in the supply path causes supply noise when the current dissipation of the PHY is changing. This supply noise causes voltage distortions and timing variations, generating timing jitter on interface signals as well as internal PHY signals. The contribution of bond wires to the supply inductance can be reduced by adding additional supply pads to the design, but this would increase the PHY width and ultimately increase the PHY cost and is therefore not advisable. Instead, the number and placement of supply bond wires has to be carefully optimized to achieve the necessary supply noise targets in the design.Bond wires also lead to crosstalk between different signal lines. This is a severe signal integrity challenge especially at higher data rate as targeted for this design. Routing the signaling channel on a 4-layer PCB only allows for microstrips instead of striplines, which adds further crosstalk to the signaling channel. As a result, crosstalk is a major signal integrity challenge for the implementation of a high-speed DDR3 interface in this low-cost system environment, and the PHY design has to meet tight timing and voltage requirements to allow for the distortions added in the package and the PCB routing channel.II.Power Integrity AnalysisII.1.Power Integrity ChallengesPower Integrity is an important design consideration for high-speed interfaces. Supply noise in the PHY causes waveform distortions and delay variations, resulting in jitter, on interface signals and internal signals inside the PHY. Designing a high-speed interface system in a low-cost 4-layer wirebond package is particular challenging, since the supply inductance of such packages is comparably high and the bond wires allow rail-to-rail coupling between noisy digital supplies and very noise sensitive analog supplies. In order to achieve a high data rate it is therefore necessary to carefully analyze supply noise and its impact on the PHY circuits and interface characteristics.In general, there are two Power Integrity challenges in the design of high-speed interface systems that are best analyzed separately.The first power integrity challenge in high-speed interfaces is the distortion of signal quality and timing of the interface signals during Simultaneous Switching Outputs (SSO) events. SSO noise is a common problem in interface systems using single-ended signaling like DDR3 and it is discussed in detail in previous works [5]. Since the impact of SSO is strongly influenced by the interaction of the interface PHY with the external channel implementation in package and PCB, we will discuss SSO impact as part of the channel analysis. It is analyzed using a signal and power integrity co-simulation model described in a later chapter.The second challenge is the supply noise inside the PHY cause by the circuit activity of the PHY itself. This activity generates noise on all supply rails inside the PHY, including sensitive analog supplies, due to self-induced current changes or noise coupling from other system elements. This supply noise affects the performance of circuits inside the PHY, and in particular, it creates jitter in the timing circuits controlling the internal and channel timing of the interface system. The impact of power supply induced jitter (PSIJ) on the system margin of the interface has to be carefully analyzed and optimized to ensure reliable operation at the target data rate.In a DDR3 interfaces the timing on the DQ data bus is most critical, since these signals are transmitted at the full (double) data rate. The critical timing parameters on this bus are defined relative to data strobe signals, DQS. As a result, jitter that is shared between the DQ data signals and the DQS strobe signal is not affecting the system timing margin. This is particularly helpful during WRITE access, when both the DQ and DQS signals are generated in the PHY. Only PSIJ components due to DQ and DQS mismatches have to be taken into consideration for this operation. This mismatch can be minimized with a careful design of the timing paths inside the PHY.The clock signal, CK, generated by the PHY acts as a timing reference source for the internal DRAM timing and has to meet various jitter requirements defined in the DRAM specification. It also acts as timing reference for the control and address signals on the CA bus, but timing requirements on this bus are less critical since the CA bus only operates at half the data rate of the DQ bus. Meeting the jitter requirements of the DRAM specification, however, is not necessarily sufficient to operate the DDR3 interface at highdata rates. Jitter on the CK signal increases the output hold time parameter tQH of the DRAM device, reducing system margin during READ operations. It is therefore advisable to keep jitter on the CK signal very low, if possible even lower than required by the DRAM specification, to gain system margin during READ access. In the following chapter we will present a detailed PSIJ analysis for the CK signal path inside the PHY. II.2.Power Supply Model and Simulation ResultsThe prediction of power supply noise plays a vitally important role in defining the voltage and timing budget for this low-cost wirebond DDR3 PHY design targeting at 1600Mbps up to 1866Mbps. Besides the common concern on the dynamic range of the supply noise, it is also crucial to understand the supply noise impact on the system timing jitter, or, power supply noise induced jitter (PSIJ). Previously, a systematic approach for predicting PSIJ by combining the supply noise spectrum and the clocking circuit jitter sensitivity has been developed [2]. The methodology flow is shown in Figure 1. In order to estimate the supply noise impact on jitter, this method seeks to obtain the jitter spectrum, J(f), which in turn can be obtained by multiplying the supply noise spectrum, V(f), and jitter sensitivity profile, S(f), all in frequency domain. The jitter sensitivity profile is solely determined by the circuit realization and independent of the circuit activity. On the other side, the supply noise spectrum is determined by both the power delivery network and the current profile, a variable depending on different circuit activity and data pattern. The following sections will first describe the supply noise analysis to obtain V(f) and then discuss the jitter sensitivity results of S(f) so that the final prediction of PSIJ in the DDR3 system can be evaluated. Four supplies are used in the implemented DDR3 test system, including VDDP, VDDA, VDDIO, and VDDR. The PLL is supplied by the dedicated VDDP supply. The clock distribution circuits operate on VDDA. The I/O circuits use VDDIO. The rest of the circuits, mainly the digital logic circuits for the data path, operate on VDDR. Since the entire clocking circuits are on VDDP, VDDA, and VDDR, it is expected that the main jitter contribution comes from the noise on these three supplies. The following discussions will focus on these three supplies, which are highly jitter sensitive.Figure 1. Methodology for predicting supply noise impact on jitter (PSIJ) [2].VOff-Chip PDN On-Chip PDN Current ProfileFigure 2. Power supply model for pre-layout supply noise simulation.Figure 2 shows the power supply model topology used for the supply noise analysis. As shown in the figure, three components are required including off-chip PDN, on-chip PDN, and supply current profile. The off-chip PDN is modeled by passive RLC components resulting from voltage regulator, PCB, and package parasitics as well as low and medium frequency decoupling capacitors. The on-chip PDN represents the physical power grids from die pads to rest of the chip, typically includes RC parasitics and very importantly, on-chip decaps. The third component is the current profile, which is extracted from the circuit simulation and applied as the stimulus to the PDN. In order to evaluate both the worst-case switching noise and the steady state supply noise, it is desired to have the current profile extracted under the DDR3 PHY operating condition for bus turn-around. Figure 3 shows the data waveform under a WRITE-NOP-READ bus turn-around condition as well as the corresponding current profiles for VDDR, VDDA, and VDDP supplies. As can be seen from the figure, the VDDA and VDDP current profiles are independent of the operation modes while average VDDR current shifts significantly between the active WRITE/READ mode and the NOP mode.WRITEREAD NOP avg=21mApeak=32mA avg=163mApeak=638mA avg=102mApeak=599mA avg=165mA peak=655mAavg=102mA peak=596mAavg=21mA peak=32mAavg=21mA peak=32mA avg=115mA peak=622mA avg=102mA peak=597mA 80 back-to-back PRBS, BL=4~300ns 80 back-to-back PRBS, BL=4~300nsFigure 3: Supply current profiles for bus turn-around, representing 300ns of continuous WRITE and 300nsof continuous READ with 150ns NOP in between.vddr 10.2 mV pp 10.4 mV pp 18.8 mV pp ~20mV DC shift 4.4 mV pp 18.7 mV pp4.2 mV ppDue to Standby/ActivePower Mode TransitionvddavddpWRITEREAD NOPFigure 4: Overview of VDDR, VDDA, and VDDP supply noise for the DDR test system.The power supply noise analysis is performed by applying the above current profiles to the power supply model shown in Figure 2. The overview of the supply noise simulation results are summarized in Figure 4. As the dedicated supply to PLL alone, the VDDP noise , independent of the activity mode, is around 5mVpp and. Comparing to the VDDP noise, the VDDA noise is significantly higher at around 19mVpp due to the strong switching activity generated by the clock buffers in the clock distribution circuits. The VDDA noise is also independent of activity mode and it remains stable as long as the clock distribution stays on. The VDDR noise exhibits strong dependence on mode of operation. The VDDR supply experiences significant DC IR shift between the active WRITE/READ mode and the non-active NOP mode. What matter the most are the switching noise during the transitions between the active and non-active operation modes and the steady state noise during the normal active modes for continuous WRITE or READ operation. The former usually leads to the worst-case supply voltage collapse and the latter determines how much net jitter impact it has on the timing budget of the system. As shown by the figure, the bus turn-around switching noise is as high as 25mVpp and the steady state noise is around 10mVpp. As will be discussed shortly, VDDP has the highest jitter sensitivity followed by VDDA and VDDR while its supply noise is relatively small. The net jitter contributions from the supply noise on each of these domains are discussed in the following sections.Figure 5-7 shows the details of the simulated supply noise in time-domain and frequency-domain under WRITE and READ conditions. The VDDR simulation results are shown in Figure 5, where the time-domain results indicate that the peak-to-peak noise is around 10mV. The noise spectrum results show that the major component is at the 1066MHz data rate, with sub-harmonic at 533MHz, and its higher-order harmonics. The obtained noise spectrum will be used to compute the PSIJ impact. Similarly, the VDDA simulation results in Figure 6 show that the swing is around 19mV with major frequency components are at 533MHz and 1066MHz. The VDDP noise simulation results are shown in Figure 7. The peak-to-peak noise is around 5mV and the frequency components are the PLL reference clock, its output clock and their higher-order harmonics.10.2 mVpp 8.2 mVpp10.4 mVpp(a) (b)Data rate @1066MHz TX/RX CLK@533MHzLF/MF noise Data rate @1066MHzTX/RX CLK@533MHz LF/MF noise(c) (d) Figure 5: Simulation results of VDDR supply noise. (a)Supply noise during WRITE, (b)Supply noise during READ, (c)Spectrum of supply noise during WRITE, and (d)Spectrum of supply noise during READ. 18.8 mVpp 18.7 mVpp(a) (b) TX/RX CLK@533MHz LF/MF noise Data rate@1066MHz HF Data rate @1066MHzTX/RX CLK @533MHz LF/MF noiseHF(c) (d)Figure 6. Simulation results of VDDA supply noise. (a)Supply noise during WRITE, (b)Supply noise during READ, (c)Spectrum of supply noise during WRITE, and (d)Spectrum of supply noise duringREAD.4.4 mVpp 4.2 mVpp(a) (b) half CK freq@266MHzLF/MF noise VCO freq harmonicsREFCLK @133MHzCK@533MHzhalf CK freq@266MHzLF/MF noiseVCO freqharmonicsREFCLK@133MHzCK@533MHz (c) (d)Figure 7. Simulation results of VDDP supply noise. (a)Supply noise during WRITE, (b)Supply noise during READ, (c)Spectrum of supply noise during WRITE, and (d)Spectrum of supply noise duringREAD.II.3.Jitter Sensitivity and Jitter SpectrumPSIJ sensitivity is defined in frequency domain as the system jitter response to sinusoidal supply noise. Its magnitude profile represents how much jitter is induced by the supply noise with one unit of swing. Its phase profile represents how much phase difference between the supply noise and its induced jitter sequence in the steady state. The PSIJ sensitivity is solely determined by the circuit implementation and is independent of different circuit activity. Therefore, it is a system transfer function for characterizing the jitter impact induced by the supply noise. It serves as a key linking parameter between the supply noise as the stimulus and the jitter impact as the output response. The PSIJ sensitivity extraction methodology has been previously reported in [2]. It is applied here to extract the CK PSIJ sensitivity profiles for the DDR3 test system. The PSIJ sensitivity results for VDDR, VDDA, and VDDP are shown in Figure 8(a)-(c), respectively. As seen in the figure, the PSIJ sensitivity of VDDR and VDDA are relatively lower than that of VDDP. This is expected since the most sensitive block in the entire clocking path is the PLL circuit, which is solely supplied by VDDP. The VDDP sensitivity, as shown in Figure 8(c), exhibits a band-pass behavior with its peak of about 1ps/mV at around 10MHz, which roughly corresponds to the PLL loop bandwidth. The VDDA sensitivity, as shown in Figure 8(b), exhibits a low-pass behavior. This is also expected because VDDA supplies the entire clock distribution circuitry, where the major jitter sensitivity characteristic is due to the clock buffer delay change caused by the supply voltage variation, up to the circuit bandwidth.(a) (b) (c)Figure 8: Simulated DDR3 PSIJ sensitivity profiles for (a)VDDR, (b)VDDA, and (c)VDDP The final PSIJ is derived by combing the PSIJ sensitivity, S(f), and the supply noise spectrum, V(f). Each of these two required components has been addressed as above. One can compute the jitter spectrum J(f) as follows:SfJ(Eq. 1)(ffV))(()The above jitter spectrum is a comprehensive characterization on the supply noise impact on jitter. It reveals magnitude and location of all the jitter components and relates their sources to the supply noise frequency components. It quantifies what frequency components of the supply noise make the most significant contribution to the final jitter impact. Moreover, the jitter spectrum serves as the basis to derive many important aspects of the jitter. For example, the time-domain jitter sequence is computed as follows:SVfifftft j(Eq. 2)ifftJ)]))(f)](([([By applying the above procedure, the jitter induced by the supply noise is derived to estimate the PSIJ contribution to the total jitter in the test DDR3 system. The results are summarized in Figures 9-11. Figure 9 shows the VDDR PSIJ prediction results for continuous WRITE and READ modes. Figure 9(a) is the simulated jitter spectrum due to the VDDR noise during WRITE, showing that the major jitter components are at the CK frequency and the data rate. The corresponding time-domain jitter sequence is computed by using Eq.2 and is shown in Figure 9(c). From the figure, the peak-to-peak jitter is found to be around 3.3ps. Figure 9(e) further shows the histogram of the jitter sequence so that the PSIJ statistical property can be revealed, e.g., distribution form, peak-to-peak value, and deviation, etc. Similarly, the VDDR PSIJ results under READ condition in terms of jitter frequency-domain spectrum, time-domain sequence, and statistical histogram are shown in Figure 9(b)(d)(f). The peak-to-peak jitter for READ is found to be around 2.9ps, which is slightly less than that in WRITE. Figure 10(a)-(f) show the VDDA PSIJ results. Although it is expected that the results are independent on WRITE or READ, the results under these two conditions are shown in the figure as a sanity check. As seen from the figure, the major jitter components are at the CK frequency at 533MHz and its 2nd harmonic at 1066MHz. The peak-to-peak jitter is found to be around 2.4ps for WRITE and 2.2ps for READ. Figure 11(a)-(f) show the VDDP PSIJ results. Although the VDDP has the highest jitter sensitivity, the noise in its supply domain is not as big as those in VDDR or VDDA. As a result, the peak-to-peak jitter due to VDDPnoise is found to be about 1.8ps for WRITE and 2.0ps for READ. The major jitter contribution comes from the PLL reference clock at 133MHz as well as its 2nd and 3rd harmonics.(a) (b)(c) (d)(e) (f)Figure 9: Simulated vddr PSIJ results for continuous WRITE and READ. (a) Spectrum of jitter induced by VDDR noise during WRITE, (b)Spectrum of jitter induced by vddr noise during READ, (c)VDDR PSIJ jitter sequence during WRITE, (d)VDDR PSIJ sequence during READ, (e) VDDR PSIJ histogram duringWRITE, and (f)VDDR PSIJ histogram during READ.(a) (b)(c) (d)(e) (f)Figure 10: Simulated vdda PSIJ results for continuous WRITE and READ. (a) Spectrum of jitter induced by VDDA noise during WRITE, (b)Spectrum of jitter induced by VDDA noise during READ, (c)VDDA PSIJ jitter sequence during WRITE, (d)VDDA PSIJ sequence during READ, (e) VDDA PSIJ histogram during WRITE, and (f)VDDA PSIJ histogram during READ.(a) (b)(c) (d)(e) (f)Figure 11: Simulated vddp PSIJ results for continuous WRITE and READ. (a) Spectrum of jitter induced by VDDA noise during WRITE, (b)Spectrum of jitter induced by VDDA noise during READ, (c)VDDA PSIJ jitter sequence during WRITE, (d)VDDA PSIJ sequence during READ, (e) VDDA PSIJ histogram during WRITE, and (f)VDDA PSIJ histogram during READ.Although the above PSIJ results represent the steady state activity mode for continuous WRITE or READ, it is also important to estimate the worst-case pathological jitter impact. Since neither VDDA nor VDDP noise should be dependent on the activity mode, the major variable in noise source is the VDDR noise. However, the basis to construct such cases is not the supply noise spectrum itself. Instead, the determining factor is the peak jitter sensitivity frequency location. As suggested by the VDDR PSIJ sensitivity shown in Figure 8(a), the peaking occurs at 5~10MHz with about 0.5ps/mV. Therefore, the worst-case VDDR PSIJ should occur when the VDDR supply noise has major components at 5~10MHz. Such case can be emulated by stitching the active mode current profile with the non-active mode current profile with a repetition rate of 5MHz. Figure 12 shows the PSIJ results under such conditions. Figure 12(a) and (b) show the VDDR supply noise waveforms for pathological WRITE-NOP and READ-NOP cases. The DC shift is about 20mV between the active and non-active mode and the peak-to-peak noise is about 25mV. The corresponding PSIJ jitter spectrum are plotted in Figure 12(c) and (d), showing jitter components as high as 10ps in magnitude at 5MHz. The resulting jitter sequences are plotted in Figure 12(e) and (f), where the significant 5MHz jitter component as well as its 10MHz harmonics can be clearly seen. Recall that the peak-to-peak supply noise for active mode is about 19mV during normal continuous WRITE or READ and the resulting PSIJ is about 3.3ps. In the pathological case, the peak-to-peak supply noise is about 25mV, which is 1.3x larger than that in the normal active mode. But the resulting jitter is about 34ps, which is 10x higher than that in the normal active mode. The constructed pathological case is thus useful to estimate the worst-case or upper bound of the PSIJ impact in the system.。