(完整版)FURUNOECDISMultipleChoiceTest古野电子海图题库测试题
气相色谱仪电子捕获检测器(ECD)使用手册
气相色谱仪电子捕获检测器(ECD)使用手册1 结构电子捕获检测器组块为一个独立的整体,可以拆换。
它和快速进样汽化室组合,可以实现全玻璃系统。
检测器采用单极输入、输出方式,即脉冲极化电压经信号线加在离子室阳极上。
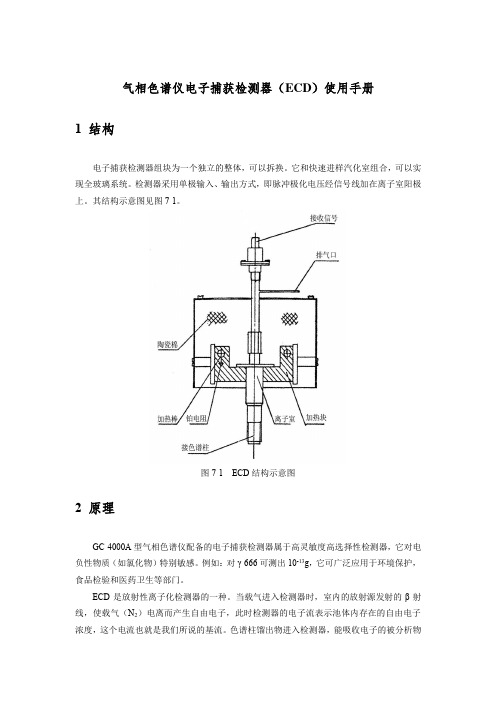
其结构示意图见图7-1。
图7-1 ECD结构示意图2 原理GC-4000A型气相色谱仪配备的电子捕获检测器属于高灵敏度高选择性检测器,它对电负性物质(如氯化物)特别敏感。
例如:对γ-666可测出10-13g,它可广泛应用于环境保护,食品检验和医药卫生等部门。
ECD是放射性离子化检测器的一种。
当载气进入检测器时,室内的放射源发射的β射线,使载气(N2)电离而产生自由电子,此时检测器的电子流表示池体内存在的自由电子浓度,这个电流也就是我们所说的基流。
色谱柱馏出物进入检测器,能吸收电子的被分析物和池内自由电子复合,形成负离子,这时池内的自由电子就明显减少,这种基流的变化经放大器放大后,在记录仪或数据处理机上记录下来。
3 主要技术数据放射源:63Ni(活度为3.7×10⁸Bq)电极型式:圆筒对称电极离子室容积:约0.8ml最高使用温度:350℃敏感度:5×10-13g/ml(γ-666)线性范围:约103基流:大于1×10-9A基线漂移:在30min内,波动范围不超过0.2mV4 安装4.1 安装条件本ECD采用了63Ni 放射性同位素,仪器操作者应具有这方面的基本知识,方能安装操作。
载气通常使用氮气,它的纯度应高于99.999%,如果纯度不够,将使基流降低,噪声加大,稳定性变坏,线性范围变窄。
载气中的含氧和水量最好在1μl/L以下。
4.1.1 色谱柱的活化ECD是属于高灵敏度、选择性检测器,未经活化或活化不完全的色谱柱接入检测器是很危险的,轻者使噪声增加,灵敏度降低,严重污染会使基流很小,甚至没有基流。
另外ECD在选择色谱柱时,应尽量选用使用温度高的固定液,并且在满足分析要求的情况下,应使用较低的柱温,否则温度波动、载气流的波动都会引起固定液的蒸汽压的变化,造成基线噪声增加和基线的大幅度漂移。
FURUNO FA-100 Class-A Universal AIS 产品说明书

Automatic Identification SystemClass-A Universal AISCatalogue No. N-848cRModel FA-100FURUNO DEEPSEA WORLDThe AIS improves the safety of navigation by assisting in the efficient navigation of ships,protection of the environment,and operation of Vessel TrafficServices by satisfying the following functional requirements:s ship-to-ship mode for collisionavoidances a means for littoral states toobtain information about a ship and its cargos VTS tool, i.e., ship-to-shoretraffic managements Class-A Universal AIS complying with IMO MSC.74(69) Annex 3, IEC 61993-2, ITU-R M.1371-1s Target ship's CPA/TCPA, COG/SOG, name on the basic scrolled LCDdisplays Extensive AIS target data on radar;target symbols complying with IMOSN/Circ.217s Interfaces for radar, ECDIS, PC. Future expansion - LAN and Long Range AISoperation s Built-in GPS receiver for UTCsynchronization and backup positionfixings Heading information by GPS compass SC-60/120 or gyrocompasss Existing radars FR-15x5 MK3, FR-21x5 and FAR-28x5 series can be upgraded for AIS target view by retrofitting theRP cardThe FA-100 is a universal shipborne AIS capable of exchanging navigation and ship data between own ship and other ships or coastal stations. It complies with IMO MSC.74(69) Annex 3, A.694, ITU-R M.1371-1 and DSC ITU-R M.825. It also complies with IEC 61993-2 (Type testing standard), IEC 60945 (EMC and environmental conditions).The FA-100 consists of VHF/GPS antennas, a transponder unit and several associated units.The transponder contains a VHF transmitter, two TDMA receivers on two parallel VHF channels, a DSC channel 70 receiver, interface, communication processor, LCD display, and internal GPS receiver. The internal 12-channel all-in-view GPS receiver with a system synchronization toeliminate clash among amultiple users. It alsogives position, COG andSOG when the externalGPS fails.The LCD panel displaysall required informationabout Static data, Dynamic data, Voyage related data and Short safety-related messages. The information and messages are automatically updated according to the ITU-R M.1371-1, e.g., static information every 6 min and on request, dynamic information every 10 s on ship faster than 3 kt and 3.3 s when changing courseGraphic modeFURUNO AIS on standalone transAIS Target information on radar image(by simulation)sponder display , on radar , on ECDISSleeping AIS Targetdata is read in the AIS data cellLost TargetThe AIS enhances detection of other ships and AtoN (aids to navigation) on radar screen.q AIS targets are visible even if they are behind large ships, islands or points.q AIS is not obscured by the sea clutter and rain clutter.q Possible to predict course change of large ships by displaying ROT at tip of COG/SOG vector.The AIS target symbols can be overlaid on the radar FAR-28x5 series (with RP-340),FR-21x5 series (with RP-250) and FR-15x5 series (with RP-180). The new RP radar plotting modules provide practically unlimited number of AIS targets together with ARPA symbols.Operational concept is common to all RP-modules. Place the cursor on an AIS target of interest and hit the AIS Data key, and the relevant data is visible on the data area below the ARPA data cell. If multiple AIS symbols mask the ARPA and radar picture, you can sleep the AIS targets.The triangle symbols get smaller for positive The AIS target symbols appear as defined by the SN/Circ.217 as follow: AIS COG/SOG vector changes its length with speed and adjustable in cycle time.ROT mark is viewable at the COG/SOG vector tip when a target ship is equipped with a Furuno GPS compass SC-60 or 120.The Automatic Identification System (AIS) wasoriginally developed to aid the Vessel Traffic Services (VTS) by use of VHF transponder working on Digital Selective Call (DSC) at VHF Channel 70 and is still in use along the UK coastal areas and others. Afterward the IMO developed a Universal AIS using the new sophisticated technology called Self-Organized Time Division Multiple Access (SOTDMA) based on a VHF Data Link (VDL).This system is synchronized with GPS time to avoid conflict among multiple users (IMO minimum 2000reports per minute and IEC requires 4500 reports on two channels).The system operates in 3 modes - autonomous (continuous operation in all areas), assigned (data transmission interval remotely controlled by authority in traffic monitoring service) and polled (in response to interrogation from a ship or authority). The VHF channels 87B and 88B are commonly used and in addition there are local AIS frequencies. Theshipborne AIS transponders exchange various data as specified by the IMO and ITU on either frequency automatically set up by the frequency management telecommand received by the DSC receiver on ship.VHF transmit power is also set up for 12.5 W or 2 Wautomatically.System OverviewSystem OverviewAll ships broadcast Static and Dynamic information (autonomous and continuous mode).If OS wants to know information about ship 1, OS shall send an interrogation in polling mode;then ship 1 will transmit her response on the same VHF channel without operator intervention.s Static DataMMSI (Maritime Mobile Service Identity)IMO number (Where available)Call sign & name Length and beam Type of shipLocation of position-fixing antenna on the ships Dynamic dataShip’s position with accuracy indication and integrity status UTCCourse over ground (COG)Speed over ground (SOG)HeadingNavigation status (manual input)Rate of turn (where available)Update rates Dependent on speed and course alternation (2 s – 3 min)s Voyage related data Ship’s draughtHazardous cargo (type)Destination and ETA (at masters discretion)Implementation schedule(MSC.73 adopted 5 December 2001 and Amendments adopted 13 December 2002 by the Conference of Contracting Governments to the SOLAS 1974)1New building on and after 1 July 2002: .1All ships of ≥300 GT on int'l voyages.2Cargo ships ≥500 GT not on int'l voyages .3Passenger ships irrespective of size on all voyages 2Ships on int'l voyages constructed before 1 July 2002.1Passenger ships: before 1 July 2003.2Tankers: before first survey of safety equipment after 1 July 2003.3Ships, other than passenger and tankers, ≥50,000GT: before 1 July 2004.4Ships, other than passenger and tankers, ≥300GT but <50,000 GT: before first survey of safety equipment after 1 July 2004 or before 31December 2004, whichever occurs earlier 3Ships not on int'l voyages constructed before 1 July 2002: before 1 July 2008GENERALStandards I MO MSC.74(69) Annex 3,IEC 61993-2, ITU-R M.1371-1 Ship reporting capacity2000 reports per minute, 4500 reports per minute ontwo channelsTDMA TransmitterTX Frequency:156.025 MHz - 162.025 MHz,manual/automatic setting Transmitter Power: 2 W, 12.5 W manual/automaticselectionTDMA ReceiverRX Frequency:156.025 MHz-162.025 MHz by2 channelsRX1:Default CH87B (161.975 MHz),manual/automatic setting RX2:Default CH88B (162.025 MHz),manual/automatic setting Channel Spacing:25 kHz and 12.5 kHzDSC ReceiverRX Frequency: CH70 (156.525 MHz)Internal GPS ReceiverType:GN-79N5A-N, 12 CHAccuracy:10 m (GPS), 5 m (DGPS withoptional beacon receiver)UTC Synchronization Jitter (time between slot start andtransmitter on): ±100 µsExternal GPS ReceiverGP-80, GP-500 MK 2, SC-60/SC-120 (if approved by Administrations)Navigational dataCOG/SOG, ROT, POS, Heading from external sources DisplayText (meets IMO minimum requirements) scrolled on LCD screen 95 x 65 mmGraphical (optional) on Radar model FR-15x5 MK 3Series (with RP-180 module), FR-21x5 Series (withRP-250 module), FAR-28x5 Series (with RP-340module)Existing radars can be upgraded for AIS target viewwith one of these RP cards.INTERFACEInput ABM, ACA, ACK, AIR, BBM, DTM, GBS,GGA, GLL, GNS, HDT, OSD, SSD, RMC,ROT, VBW, VSD, VTG, LRF, LRIOutput ABK, VDO, VDM, ACA, ACS, ALR, LRF,LR1, LR2, LR3, TXTPOWER SUPPLY12-24 VDC, 7-3.5 A, 115/230 VAC with rectifier ENVIRONMENTIEC 60945 for EMC, Vibration, TemperatureEQUIPMENT LISTStandard1.Transponder Unit 1 unit2.GPS Antenna Unit GSC-001 orGPS/VHF Combined Antenna Unit GVA-100with Distribution Box DB-1 1 unit3.Junction Box CB-100 1 unit4.Installation Materials 1 set Optional1.VHF Antenna Unit 150M-W2VN with bracket2.GPS/VHF Combined and GPS Antenna Cable kitTNC-PS-3D-15 (15 m), CP20-01700 (30 m),CP20-01710 (50 m)3.Antenna Base No. 13-QA330, No. 13-QA310,No. 13-RC51604.Software for PC (under developing)5.DGPS Beacon Receiver GR-806.Pilot plug7.Flush Mount Kit A and B8.Power Supply Unit PR-240Note: IMO requires the AIS operates on ship's mains (115/230 VAC) and alternative source, then a PR-240 is required. Check with your authorities for alternative power as it can be an emergency source (ACgenerator) or reserve source (batteries).SPECIFICATIONS SUBJECT TO CHANGE WITHOUT NOTICE03015N Printed in JapanFURUNO U.S.A., INC.Camas, Washington, U.S.A.Phone: +1 360-834-9300 Telefax: +1 360-834-9400 FURUNO (UK) LIMITEDDenmead, Hampshire, U.K.Phone: +44 2392-230303 Telefax: +44 2392-230101FURUNO DANMARK ASHvidovre, DenmarkPhone: +45 36 77 45 00 Telefax: +45 36 77 45 01 FURUNO NORGE A/SÅlesund, NorwayPhone: +47 70 102950 Telefax: +47 70 127021。
USP-88-生物实验

88BIOLOGICAL REACTIVITY TESTS, IN VIVOThe following tests are designed to determine the biological response of animals to elastomerics, plastics, and other polymeric material with direct or indirect patient contact, or by the injection of specific extracts prepared from the material under test. It is essential to make available the specific surface area for extraction. When the surface area of the specimen cannot be determined, use 0.1 g of elastomer or 0.2 g of plastic or other material for every mL of extraction fluid. Also, it is essential to exercise care in the preparation of the materials to be injected or instilled to prevent contamination with microorganisms and other foreign matter. Three tests are described. The Systemic Injection Test and the Intracutaneous Test are used for elastomeric materials, especially to elastomeric closures for which the appropriate Biological Reactivity Tests, In Vitro 87 have indicated significant biological reactivity. These two tests are used for plastics and other polymers, in addition to a third test, the Implantation Test, to test the suitability of these materials intended for use in fabricating containers and accessories thereto, for use in parenteral preparations, and for use in medical devices, implants, and other systems.These three tests are applied to materials or medical devices, if there is a need for classification of plastics and other polymers based on in vivo biological reactivity testing.For the purpose of this chapter, these definitions apply: the Sample is the specimen under test or an extract prepared from such a specimen. A Blank consists of the same quantity of the same extracting medium that is used for the extraction of the specimen under test, treated in the same manner as the extracting medium containing the specimen under test. A Negative Control1is a specimen that gives no reaction under the conditions of the test.CLASSIFICATION OF PLASTICSSix Plastic Classes are defined (see Table 1). This classification is based on responses to a series of in vivo tests for which extracts, materials, and routes of administration are specified. These tests are directly related to the intended end-use of the plastic articles. The choice of extractants is representative of the vehicles in preparations with which the plastics are likely to be in contact. The Table 1 classification facilitates communication among suppliers, users, and manufacturers of plastics by summarizing the tests to be performed for containers for injections and medical devices if a need for classification exists.Table 1. Classification of PlasticsPlastic Classes a Tests to be ConductedI II III IV V VI Test Material Animal Dose Procedure bx x x x x xExtract of Sample inSodium ChlorideInjection Mouse50 mL/kg A (IV)x x x x x x RabbitorGuineaPig0.2 mL/animalat each of 10 or6 sites B (IC)x x x x xExtract of Sample in1 in 20 Solution ofAlcohol in SodiumChloride Injection Mouse50 mL/kg A (IP)x x x x x RabbitorGuineaPig0.2 mL/animalat each of 10 or6 sites B (IC)x x xExtract of Sample inPolyethylene Glycol400Mouse10 g/kg A (IP)x x RabbitorGuineaPig0.2 mL/animalat each of 10 or6 sites B (IC)x x x xExtract of Sample inVegetable Oil Mouse50 mL/kg A (IP)x x x RabbitorGuineaPig0.2 mL/animalat each of 10 or6 sites B (IC)x x Implant strips ofSample Rabbit 4 strips/animal CPlastic Classes a Tests to be ConductedI II III IV V VI Test Material Animal Dose Procedure bx x Implant Sample Rat2Samples/animal Ca Tests required for each class are indicated by “x” in appropriate columns.b Legend: A (IP)—Systemic Injection Test (intraperitoneal); B (IC)—Intracutaneous Test (intracutaneous); C—Implantation Test (intramuscular or subcutaneous implantation).With the exception of the Implantation Test, the procedures are based on the use of extracts that, depending on the heat resistance of the material, are prepared at one of three standard temperatures: 50, 70, and 121. Therefore, the class designation of a plastic must be accompanied by an indication of the temperature of extraction (e.g., IV-121, which represents a class IV plastic extracted at 121, or I-50, which represents a class I plastic extracted at 50).Plastics may be classified as USP Plastic Classes I–VI only on the basis of the response criteria prescribed in Table 1.This classification does not apply to plastics that are intended for use as containers for oral or topical products, or that may be used as an integral part of a drug formulation. Table 1 does not apply to natural elastomers, which are to be tested in Sodium Chloride Injection and vegetable oils only.The Systemic Injection Test and the Intracutaneous Test are designed to determine the systemic and local, respectively, biological responses of animals to plastics and other polymers by the single-dose injection of specific extracts prepared from a Sample. The Implantation Test is designed to evaluate the reaction of living tissue to the plastic and other polymers by the implantation of the Sample itself into animal tissue. The proper preparation and placement of the specimens under aseptic conditions are important in the conduct of the Implantation Test.These tests are designed for application to plastics and other polymers in the condition in which they are used. If the material is to be exposed to any cleansing or sterilization process prior to its end-use, then the tests are to be conducted on a Sample prepared from a specimen preconditioned by the same processing.Factors such as material composition, processing and cleaning procedures, contacting media, inks, adhesives, absorption, adsorption and permeability of preservatives, and conditions of storage may also affect the suitability of a material for a specific use. Evaluation of such factors should be made by appropriate additional specific tests to determine the suitability of a material for its intended use.USP R EFERENCE S TANDARDS 11—USP High-Density Polyethylene RS.Extracting Media—SODIUM CHLORIDE INJECTION (see monograph). Use Sodium Chloride Injection containing 0.9% of NaCl.1 IN 20 SOLUTION OF ALCOHOL IN SODIUM CHLORIDE INJECTION.POLYETHYLENE GLYCOL 400 (see monograph).VEGETABLE OIL—Use freshly refined Sesame Oil (see monograph) or Cottonseed Oil (see monograph) or other suitable vegetable oils.DRUG PRODUCT VEHICLE (where applicable).WATER FOR INJECTION (see monograph).NOTE—The Sesame Oil or Cottonseed Oil or other suitable vegetable oil meets the following additional requirements. Obtain, if possible, freshly refined oil. Use three properly prepared animals, and inject the oil intracutaneously in a dose of 0.2 mL into each of 10 sites per animal, and observe the animals at 24, 48, and 72 h following injection. Rate the observations at each site on the numerical scale indicated in Table 2. For the 3 rabbits or guinea pigs (30 or 18 injection sites), at any observation time, the average response for erythema is not greater than 0.5 and for edema is not greater than 1.0, and no site shows atissue reaction larger than 10 mm in overall diameter. The residue of oil at the injection site should not be misinterpreted as edema. Edematous tissue blanches when gentle pressure is applied.Table 2. Evaluation of Skin Reactions aErythema and Eschar Formation ScoreNo erythema0 Very slight erythema (barely perceptible)1 Well-defined erythema2 Moderate to severe erythema3 Severe erythema (beet-redness) to slight eschar formation(injuries in depth)4 Edema Formation b ScoreNo edema0 Very slight edema (barely perceptible)1 Slight edema (edges of area well defined by definite raising)2 Moderate edema (raised approximately1 mm)3 Severe edema (raised more than 1 mm and extending beyond the areaofexposure)4a Draize JH, Woodward G, Calvery HO. Methods for the study of irritation and toxicity of substances applied topically to the skin and mucous membranes. J Pharmacol Exp Ther 1944;82:377–390.b Excludes noninflammatory (mechanical) edema from the blank or extraction fluid.Apparatus— The apparatus for the tests includes the following. AUTOCLAVE— Use an autoclave capable of maintaining a temperature of 121 ± 2.0, equipped with a thermometer, a pressure gauge, a vent cock, a rack adequate to accommodate the test containers above the water level, and a water cooling system that will allow for cooling of the test containers to about, but not below, 20 immediately following the heating cycle.OVEN— Use an oven, preferably a forced-circulation model, that will maintain operating temperatures of 50 or 70within ±2.EXTRACTION CONTAINERS— Use only containers, such as ampuls or screw-cap culture test tubes, of Type I glass. If used, culture test tubes are closed with screw caps having suitable elastomeric liners. The exposed surface of the elastomeric liner is completely protected with an inert solid disk 0.05–0.075 mm in thickness. A suitable disk may be fabricated from a polytef resin.Preparation of Apparatus—Cleanse all glassware thoroughly with chromic acid cleansing mixture, or if necessary, with hot nitric acid, followed by prolonged rinsing with water. Clean cutting utensils by an appropriate method (e.g., successive cleaning with acetone and methylene chloride) prior to use in subdividing a specimen. Clean all other equipment by thorough scrubbing with a suitable detergent and prolonged rinsing with water.Render containers and equipment used for extraction, and in transfer and administration of test material, sterile and dry by a suitable process. [NOTE—If ethylene oxide is used as the sterilizing agent, allow adequate time for complete degassing. ]Procedure—PREPARATION OF SAMPLE— Both the Systemic Injection Test and the Intracutaneous Test may be performed using the same extract, if desired, or separate extracts may be made for each test. Select and subdivide into portions a Sample of the size indicated in Table 3. Remove particulate matter, such as lint and free particles, by treating each subdivided Sample or Negative Control as follows. Place the Sample into a clean, glass-stoppered, 100-mL graduated cylinder of Type I glass, and add about 70 mL of Water for Injection. Agitate for about 30 s, and drain off the water. Repeat this step, and dry those pieces prepared for the extraction with Vegetable Oil in an oven at a temperature not exceeding 50. [NOTE—Donot clean the Sample with a dry or wet cloth or by rinsing or washing with an organic solvent, surfactant, etc. ]Table 3. Surface Area of Specimen To Be Used aForm ofMaterial Thickness Amount of Sample for each 20mL of Extracting Medium Subdivided intoFilm or sheet<0.5 mm Equivalent of 120 cm2 totalsurface area (both sidescombined)Strips of about5 × 0.3 cm0.5–1 mm Equivalent of 60 cm2 total surface area (both sides combined)Tubing <0.5 mm(wall)Length (in cm) = 120 cm2/(sumof ID and OD circumferences)Sections ofabout5 × 0.3 cm 0.5–1 mm(wall)Length (in cm) = 60 cm2/(sumof ID and OD circumferences)Slabs, tubing,and moldeditems>1 mm Equivalent of 60 cm2 totalsurface area (all exposedsurfaces combined)Pieces up toabout 5 × 0.3cmElastomers>1 mm Equivalent of 25 cm2 totalsurface area (all exposedsurfaces combined)Do notsubdivide ba When surface area cannot be determined due to the configuration of the specimen, use 0.1 g of elastomer or 0.2 g of plastic or other polymers for every 1 mL of extracting fluid.b Molded elastomeric closures are tested intact.PREPARATION OF EXTRACTS— Place a properly prepared Sample to be tested in an extraction container, and add 20 mL of the appropriate extracting medium. Repeat these directions for each extracting medium required for testing. Also, prepare one 20-mL blank of each medium for parallel injections and comparisons. Extract by heating in an autoclave at 121 for 60 min, in an oven at 70 for 24 h, or at 50 for 72 h. Allow adequate time for the liquid within the container to reach the extraction temperature. [NOTE—The extraction conditions should not in any instance cause physical changes such as fusion or melting of the Sample pieces, which result in a decrease in the available surface area. A slight adherence of the pieces can be tolerated. Always add the cleaned pieces individually to the extracting medium.If culture tubes are used for autoclave extractions with Vegetable Oil, seal screw caps adequately with pressure-sensitive tape. ]Cool to about room temperature but not below 20, shake vigorously for several minutes, and decant each extract immediately, using aseptic precautions, into a dry, sterile vessel. Store the extracts at a temperature of 20–30, and do not use for tests after 24 h. Of importance are the contact of the extracting medium with the available surface area of the plastic and the time and temperature during extraction, the proper cooling, agitation, and decanting process, and the aseptic handling and storage of the extracts following extraction.SYSTEMIC INJECTION TESTThis test is designed to evaluate systemic responses to the extracts of materials under test following injection into mice. Alternate routes of injection may be used with justification.Test Animals— Use healthy, not previously used albino mice weighing 17–23 g. For each test group use only mice of the same source. Allow water and food, commonly used for laboratory animals and of known composition, ad libitum.Procedure—[NOTE—Agitate each extract vigorously prior to withdrawal of injection doses to ensure even distribution of the extracted matter. ] Inject each of the five mice in a test group with the Sample or the Blank as outlined in Table 4, except to dilute each g of the extract of the Sample prepared with Polyethylene Glycol 400, and the corresponding Blank, with 4.1 volumes of Sodium Chloride Injection to obtain a solution having a concentration of about 200 mg of polyethylene glycol per mL.Table 4. Injection Procedure—Systemic Injection TestExtract or Blank Dose per kg Route a Sodium Chloride 50 mL IVExtract or Blank Dose per kg Route a Injection1 in 20 solution ofAlcohol in Sodium Chloride Injection50 mL IV Polyethylene Glycol 40010 g IP Drug product vehicle (where applicable)50 mL IV50 mL IP Vegetable Oil50 mL IPa IV = intravenous (aqueous sample and blank); IP = intraperitoneal (oleaginous sample and blank).Observe the animals immediately after injection, again 4 h after injection, and then at least at 24, 48, and 72 h. If during the observation period none of the animals treated with the extract of the Sample shows a significantly greater biological reactivity than the animals treated with the Blank, the Sample meets the requirements of this test. If two or more mice die, or if abnormal behavior such as convulsions or prostration occurs in two or more mice, or if a body weight loss greater than 2 g occurs in three or more mice, the Sample does not meet the requirements of the test. If any animals treated with the Sample show only slight signs of biological reactivity, and not more than one animal shows gross symptoms of biological reactivity or dies, repeat the test using groups of 10 mice. On the repeat test, all 10 animals treated with the Sample show no significant biological reactivity above the Blank animals during the observation period.INTRACUTANEOUS TESTThis test is designed to evaluate local responses to the extracts of materials under test following intracutaneous injection into rabbits or guinea pigs.Test Animals— Select healthy, rabbits or guinea pigs with fur that can be clipped closely and skin that is free from mechanical irritation or trauma. In handling the animals, avoid touching the injection sites duringobservation periods, except to discriminate between edema and an oil residue.Procedure—[NOTE—Agitate each extract vigorously prior to withdrawal of injection doses to ensure even distribution of the extracted matter. ] On the day of the test, closely clip the fur on the animal's back on both sides of the spinal column over a sufficiently large test area. Avoid mechanical irritation and trauma. Remove loose hair by means of vacuum. If necessary, swab the skin lightly with diluted alcohol, and dry the skin prior to injection. More than one extract from a given material can be used per rabbit or guinea pig, if it is determined that the test results will not be affected. For each Sample use two animals and inject each intracutaneously, using one side of the animal for the Sample and the other side for the Blank, as outlined in Table 5. [NOTE—Dilute each g of the extract of the Sample prepared with Polyethylene Glycol 400, and the corresponding Blank, with 7.4 volumes of Sodium Chloride Injection to obtain a solution having a concentration of about 120 mg of polyethylene glycol per mL. ]Table 5. Intracutaneous TestExtract or Blank Number of Sites(per animal)Dose(µL per site)Sample5200Blank5200Examine injection sites for evidence of any tissue reaction such as erythema, edema, and necrosis. Swab the skin lightly, if necessary, with diluted alcohol to facilitate reading of injection sites. Observe all animals at 24, 48, and 72 h after injection. Rate the observations on a numerical scale for the extract of the Sample and for the Blank, using Table 2. Reclip the fur as necessary during the observation period. The average erythema and edema scores for Sample and Blank sites are determined at every scoring interval (24, 48, and 72 h) for each rabbit or guinea pig. After the 72-hour scoring, all erythema scores plus edema scores are totalled separately for each Sample and Blank. Divide each ofthe totals by 12 (2 animals × 3 scoring periods × 2 scoring categories) to determine the overall mean score for each Sample versus each corresponding Blank. The requirements of the test are met if the difference between the Sample and the Blank mean score is 1.0 or less. If at any observation period the average reaction to the Sample is questionably greater than the average reaction to the Blank, repeat the test using three additional rabbits or guinea pigs. The requirements of the test are met if the difference between the Sample and the Blank mean score is 1.0 or less.IMPLANTATION TESTThe implantation test is designed for the evaluation of plastic materials and other polymeric materials in direct contact with living tissue. Of importance are the proper preparation of the implant strips and their proper implantation under aseptic conditions. The intramuscular implantation test requires healthy adult New Zealand rabbits. The test specimens are placed into needles as the delivery system for implantation. Although most materials lend themselves readily to this method, there are a number of materials that are unsuitable for intramuscular implantation. For materials with physical characteristics unsuitable for routine intramuscular implantation, the subcutaneous rat implantation model is a viable alternative.Intramuscular Implantation in RabbitsPrepare for implantation 8 strips of the Sample and 4 strips of USP High-Density Polyethylene RS. Each strip should measure not less than 10 × 1 mm. The edges of the strips should be as smooth as possible to avoid additional mechanical trauma upon implantation. Strips of the specified minimum size are implanted by means of a hypodermic needle (15–19 gauge) with intravenous point and a sterile trocar. Use either presterilizedneedles into which the sterile plastic strips are aseptically inserted, or insert each clean strip into a needle, the cannula and hub of which are protected with an appropriate cover, and then subjected to the appropriate sterilization procedure. [NOTE—Allow for proper degassing if agents such as ethylene oxide are used. ]Test Animals— Select healthy, adult rabbits weighing not less than 2.5 kg, and with paravertebral muscles that are sufficiently large in size to allow for implantation of the test strips. Do not use any muscular tissue other than the paravertebral site. The animals must be anesthetized with a commonly used anesthetic agent to a degree deep enough to prevent muscular movements, such as twitching. See the Association for Assessment and Accreditation of Laboratory Animal Care (AAALAC) guidelines. Procedure— Perform the test in a clean area. On the day of the test or up to 20 h before testing, clip the fur of the animals on both sides of the spinal column. Remove loose hair by means of vacuum. Swab the skin lightly with diluted alcohol, and dry the skin prior to injection. Implant four strips of the Sample into the paravertebral muscle on one side of the spine of each of two rabbits, 2.5–5 cm from the midline and parallel to the spinal column, and about 2.5 cm apart from each other. In a similar fashion implant two strips of USP High-Density Polyethylene RS in the opposite muscle of each animal. Insert a sterile stylet into the needle to hold the implant strip in the tissue while withdrawing the needle. If excessive bleeding is observed after implantation of a strip, place a duplicate strip at another site.Keep the animals for a period of not less than 120 h, and sacrifice them at the end of the observation period by administering an overdose of an anesthetic agent or other suitable agents. Allow sufficient time to elapse for the tissue to be cut without bleeding. Examine macroscopically the area of the tissue surrounding the center portion of each implant strip.Use a magnifying lens and auxiliary light source. Observe the Sample and Control implant sites for hemorrhage, necrosis, discolorations, and infections, and record the observations. Measure encapsulation, if present, by recording the width of the capsule (from the periphery of the space occupied by the implant Control or Sample to the periphery of the capsule) rounded to the nearest 0.1 mm. Score encapsulation according to Table 6.Table 6. Evaluation of Encapsulation in the Implantation TestCapsule Width ScoreNone 0Up to 0.5 mm10.6–1.0 mm21.1–2.0 mm 3Greater than 2.0 mm4Calculate the differences between average scores for the Sample and Control sites. The requirements of the test are met if the difference does not exceed 1.0, or if the difference between the Sample and Control mean scores for more than one of the four implant sites does not exceed 1 for any implanted animal.Subcutaneous Implantation in RatsPrepare for implantation 10 sample specimens and 10 control specimens. The size and shape of the control specimens shall be as similar to that of the test specimens as practically possible. For example, specimens made of sheeting material shall be 10–12 mm in diameter and from 0.3–1 mm in thickness. The edges of the specimens should be as smooth as possible to avoid additional mechanical trauma upon implantation.Test Animals—Select healthy albino rats weighing 225–350 g at the time of implantation.Procedure— Perform the test in a clean area. Anesthetize (see AAALAC guidelines) the animal until a surgical plane is achieved. Clip the fur of the animals on both sides of the spinal column. Remove loose hair bymeans of vacuum. Clean the clipped area with povidone–iodine solution. Using aseptic technique, make two midline incisions (approximately 1.0 cm long) through the skin at the cranial and caudal regions on the dorsal surface. Using blunt dissection, separate the fascia connecting skin to muscle to form a pocket underneath the skin lateral to each side of the incision (base of pocket approximately 20 mm from the line of implant). Insert a sterile sample into each pocket, and close the incision with wound clips or sutures. Implant two test samples and two control samples in each of five rats. Keep the animals for a period of at least seven days, and sacrifice them at the end of the observation period by CO2induced hypoxia or administering an overdose of an anesthetic agent. Allow sufficient time to elapse for the tissue to be cut without bleeding. Cut the skin (dorsal surface) longitudinally and lay back. Carefully examine macroscopically the area of the tissue surrounding the implant. Cut the sample in half and remove for close examination of the tissue in direct contact with the sample. Use a magnifying lens and auxiliary light source, if appropriate. Observe the Sample and Control implant sites for hemorrhage, necrosis, discolorations, and infections, and record the observations. Measure encapsulation, if present, by recording the width of the capsule (from the periphery of the space occupied by the implant Control or Sample to the periphery of the capsule) rounded to the nearest 0.1 mm. Score encapsulation according to Table 6. Calculate the differences between average scores for the Sample and Control sites. The requirements of the test are met if the difference does not exceed 1.0.SAFETY TESTS—BIOLOGICALSThe safety test set forth here is intended to detect in an article any unexpected, unacceptable biological reactivity. This in vivo test is provided for the safety assessment of biotechnology-derived products.Safety TestSelect five healthy mice not previously used for testing, weighing 17–23 g, unless otherwise directed in the individual monograph or elsewhere in this chapter, and maintained on an adequate balanced diet. Prepare a test solution as directed in the individual monograph. Unless otherwise directed in the individual monograph or elsewhere in this chapter, inject a dose of 0.5 mL of the test solution into each of the mice, using a 26-gauge needle of suitable length, or of the length specified below as applicable. Observe the animals over the 48 h following the injection. If, at the end of 48 h, all of the animals survive and not more than one of the animals shows outward symptoms of a reaction not normally expected of the level of toxicity related to the article, the requirements of this test are met. If one or more animals die or if more than one of the animals shows signs of abnormal or untoward toxicity of the article under test, repeat the test using at least another 10 mice similar to those used in the initial test, but weighing 20 ± 1 g. In either case, if all of the animals survive for 48 h and show no symptoms of a reaction indicative of an abnormal or undue level of toxicity of the article, the requirements of the test are met. Body weights of mice before and at the end of the test should be obtained to detect any untoward effects. Animals that show signs of toxicity should be grossly necropsied and subjected to histopathology if necessary.For biologics, perform the test according to the procedures prescribed in the Code of Federal Regulations, Section 610.11.1 USP High-Density Polyethylene RS.contacting USP.Topic/Question Contact Expert CommitteeGeneral Chapter Desmond G. Hunt, (GCPS2010) General Chapters -Topic/Question Contact Expert CommitteePh.D.Senior ScientificLiaison(301) 816-8341Packaging Storage and DistributionReference Standards RS Technical Services1-301-816-8129 rstech@USP38–NF33 Page 158Pharmacopeial Forum: Volume No. 38(2)。
在线富集毛细管电泳法与荧光法测定四种兽药残留的开题报告

在线富集毛细管电泳法与荧光法测定四种兽药残留的开题报告一、研究目的本研究旨在建立一种可同时测定四种兽药残留的在线富集毛细管电泳法(online concentration capillary electrophoresis,ocCE)和荧光法测定方法。
二、研究背景兽药是为了治疗、预防或控制动物疾病而使用的药品。
但如果动物体内药物残留量过高,又将对人体健康带来威胁。
因此,对动物产品中的兽药残留进行监测和控制就显得尤为重要。
传统的兽药残留检测方法包括高效液相色谱法、气相色谱法等,这些方法在分离、测定精度等方面具有很高的水平。
然而这些方法也存在一些不足,如分析速度较慢、需大量的实验室设备和抽提物等。
为解决这些问题,毛细管电泳作为一种高效和灵敏的分析技术,被广泛应用于兽药残留检测领域。
而在线富集毛细管电泳法则是通过在线实现样品前富集方式提高检测灵敏度的方法,应用范围更加广泛。
三、研究内容与方法1. 研究内容本研究将首先使用在线富集毛细管电泳法对四种兽药进行分离和测定,并比较在线富集毛细管电泳法与常规毛细管电泳法的检测效果。
随后,采用荧光探针(如纳米金荧光标记试剂)将在线富集毛细管电泳法与荧光探针结合,建立一种同时测定四种兽药残留的荧光法测定方法,并对比两种方法的测定效果。
2. 研究方法(1)在线富集毛细管电泳法在线富集毛细管电泳法采用溶胶迁移模式,首先对样品进行在线富集,然后在毛细管中通过电场力将富集的物质铺展成带状,从而实现样品的分离和检测。
在线富集毛细管电泳法的操作流程包括:①在毛细管管道中输入胶体缓冲液;②在在线富集器中输入检测物质的样品溶液,通过注入电压驱动溶液进入负载预处理柱,对样品进行富集和前处理;③通过极化电压,对样品进行分离和检测。
(2)荧光法测定方法通过将纳米金荧光探针与目标分子结合制成药物检测体系,并进一步进行在线富集毛细管电泳分离和检测。
荧光法测定方法的流程包括:①制备药物检测体系:将纳米金荧光探针与目标兽药结合制成药物检测体系;②在线富集毛细管电泳分离:将药物检测体系输入在线富集毛细管电泳仪进行在线富集毛细管电泳分离;③检测:通过荧光探测器检测药物检测体系中的荧光强度,获得对目标兽药的定量结果。
高效液相色谱法测定食用菌中福美双残留量

高效液相色谱法测定食用菌中福美双残留量摘要:建立食用菌中福美双残留量的高效液相色谱(HPLC)检测方法。
新鲜食用菌子实体样品粉碎后经二氯甲烷超声(53 Hz)提取20 min,离心(3320 g、5 min), 二氯甲烷经氮气吹干,甲醇定容后用HPLC测定。
以等体积甲醇和0.1%甲酸水溶液为流动相,1 mL/min等度洗脱,在0.05~10 μg/mL范围内,福美双的峰面积与其浓度呈线性相关,R≥0.999,方法检出限为0.02 mg/kg,添加回收率为79.4%~90.2%,变异系数为1.15% ~7.51%%。
关键词:福美双;食用菌;子实体; 高效液相色谱福美双(Thiram)是一种脊椎动物趋避剂、杀菌剂,对葡萄孢菌、黑星病菌、疫霉菌等都有活性,在我国是在蔬菜和食用菌中登记使用的农药。
福美双防治食用菌病害效果显著,因此被广大菇农使用[1]。
福美双对水生物和野生鸟类及哺乳动物存在危险,因此其残留危害不容忽视。
对于福美双的测定,主要有液相色谱法[2-7],气相色谱法[8],紫外分光光度法[9]。
气相色谱法的分析原理是将福美双经过酸分解产生二硫化碳,然后通过测定二硫化碳来计算福美双的含量,该测定方法的检出限能达到0.01 mg/kg ,但是有机硫杀菌剂,例如代森锌、代森锰、福美锌等均可被无机酸分解生成二硫化碳,无法区分实际使用的是哪种农药; 紫外分光光度法,其仪器测定的灵敏度和定性的准确度较差,较难满足目前对于农产品检测的苛刻要求; 本研究旨在建立食用菌中福美双残留量的高效液相色谱测定方法,给相关部门对于福美双残留量的监测提供参考。
1 材料与方法1.1材料香菇(Lentinus edodes)、柱状田头菇(Agrocybe cylindracea)、金针菇(Flammulina velutipes)、草菇(V olvariella volvacea)、双孢蘑菇(Agaricus bisporus)和刺芹侧耳(Pleurotus eryngii), 来源于上海市农业科学院食用菌研究所。
Extech CD Regulated Power Supply Modelos 382203 y

Manual del usuarioFuente de poder CD regulada con tres salidas Modelos 382203 (Análogo) y 382213 (Digital)IntroducciónFelicitaciones por seleccionar la Fuente de poder CD regulado Modelos 382203 (análogo) o 382213 (digital) de Extech. Los modelos 382203 y 382213 son fuentes de poder reguladas de estado sólido y compactos, apropiadas para muchas aplicaciones incluyendo pruebas de banco, servicio de campo, equipo de telecomunicaciones y diversión.Descripción del medidor1. Pantallas LCD Voltaje y Corriente2. LED indicador de estado de límite de corriente3. Interruptor de encendido con LED de estado4. Terminales de salida 5V y 12V fijo5. Terminales de salida alimentación variable6. Perillas de ajuste de voltaje y corriente variableNota: El Modelo 382213 (escalas LCD) se muestra arriba. El Modelo 382203 (mostrado en la portada) usa escala análoga.Operación1. La Fuente de poder debe ser alimentada con voltaje de línea nominal (110V ó 220V) dentro de+ 5%.2. Antes de encender, retire todas las cargas conectadas y fije la perilla de ajuste de voltajetotalmente contrarreloj (salida 0V CD).3. Para operar la fuente de alimentación como fuente de corriente constante, la salida de corrientedebe fijarse entre 10% y 100% del valor nominal (3A). El indicador de limitación de corriente se iluminará al activarse el circuito limitador de corriente.4. Use las perillas para ajuste de corriente y voltaje para fijar las salidas variables de corriente yvoltaje respectivamente. Use las terminales de salida variable para conexiones.5. Para las salidas de 5VCD y 12VCD, use las terminales de salida fija.6. Las pantallas análoga o digital indicaran las salidas reales de corriente y voltaje.7. Mantenga libre de obstrucciones las rejillas de ventilación del medidor (arriba y lados) paraprevenir sobrecalentamiento.Especificaciones382203382213Indicador Análogo doble conescalas Pantalla LCD doble de 3dígitosSalida de voltaje, CD0-30VSalida de corriente, CD0 - 3 amperiosIndicador de límite decorrienteLED de estadoPrecisión ± 7% de la escala total ± 1% de la escala total + 2dígitosOndulación y Ruido< 5mVRegulación de línea< 0,05% + 10mVVoltaje fijo de salida5V / 0,5A (Continuo); 1A (máx.)12V / 0,5A (Continuo); 1A (máx.)Tensión110/220VCA 50/60Hz (conmutable) Dimensiones152 x 142 x 242mm(6 x 5,6 x 9,5") (WxHxD)Peso4,5 kg (10 lbs.)Copyright (c)2012 Extech Instruments Corporation (a FLIR company) Reservados todos los derechos, incluyendo el derecho de reproducción total o parcial en cualquier medi o.。
EcoCult 缓冲猕猴胆水说明书

Technical Data SheetEcoCult®Buffered Peptone Wateracc. ISO 6579, ISO 6887, ISO 21528, ISO 22964, FDA-BAM and EPOrdering numbers: 1.40141.0500 / 1.40141.5000 /1.40141.9010For the preliminary non-selective enrichment of bacteria, particularly pathogenic Enterobacteriaceae such as Salmonella and Cronobacter spp., from food, animal feed, water and other materials and for the dissolving, suspending and diluting of test samples from food, animal feed and other materials. Buffered Peptone Water is also known as BPW and Buffered Peptone Medium.This culture medium complies with the specifications given by EN ISO 6579-1/-2, EN ISO 6887(all parts), EN ISO 19250, EN ISO 21528-1, EN ISO 22964, FDA-BAM Medium M192, APHA andEP 2.6.31.Mode of ActionThe broth is rich in nutrients and produces high resuscitation rates for sublethal injured bacteria and intense growth. The phosphate buffer system prevents bacterial damage caused by changes in the pH of the medium. Peptone acts as a source of carbon, nitrogen, vitamins and minerals whilst sodium chloride maintains the osmotic balance.Typical CompositionSpecified byISO 6579-1/-2,ISO 6887-1,ISO 19250,ISO 21528-1, ISO 22964, EP 2.6.31Specified byFDA-BAM MediumM192EcoCult®Buffered Peptone Wateracc. ISO 6579, ISO 6887,ISO 21528, ISO 22964,FDA-BAM and EPPeptone 10 g/l Peptone 10 g/l Peptone 10 g/l NaCl 5 g/l NaCl 5 g/l NaCl 5 g/lNa2HPO4 x 12 H2O orNa2HPO4 anhydrous*9 g/lor3.57 g/lNa2HPO4 * 3.5 g/lNa2HPO4anhydrous* 3.57 g/lKH2PO4 1.5 g/l KH2PO4 1.5 g/l KH2PO4 1.5 g/lWater 1000 ml/l Water 1000 ml/l Water n/apH at 25 °C 7.0 ±0.2 pH at 25 °C 7.0 ± 0.2 pH at 25 °C 7.0 ± 0.2* 3.57 g Na HPO anhydrous is equivalent to 9.0 g of Na HPO x 12 H O.PreparationDissolve 20.0 g in 1 l of purified water. If desired dispense into smaller vessels and autoclave 15 min at 121 °C.The dehydrated medium is a powder with light yellow colour.The prepared medium is clear and yellowish. The pH value at 25 °C is in the range of 6.8 – 7.2. Experimental Procedure and EvaluationDepend on the purpose for which the medium is used.For use as diluent, prepare the initial suspension and further dilutions according to ISO 6887-1 or other appropriate part of EN ISO 6887. To avoid damage to microorganisms by sudden changesin temperature, the temperature of the BPW shall be approximately the same as the laboratory ambient temperature, except where otherwise specified in the appropriate standard.For use as pre-enrichment medium, incubate the inoculated broth under aerobic conditions, e.g.- acc. to ISO 6579-1 and ISO 22964 between 34 °C and 38 °C for (18 ± 2 h);- acc. ISO 21528-1 at (37 ± 1 °C) or at (30 ± 1 °C) for (18 ± 2 h);- acc. to FDA-BAM Chapter No. 5 at (35 ± 2 °C) for (24 ± 2 h);- acc. to FDA-BAM Chapter No. 29 at (36 ± 1 °C) for (24 ± 2 h);- acc. to ISO 19250 at (36 ± 2 °C) for (18 ± 2 h);- acc. to EP 2.6.31 at (30 - 35 °C) for (18 - 24 h).For pre-enrichment of large quantities (e.g. 1 l or more), it is recommended to pre-warm the BPW before mixing it with the test portion, e.g. to 34 °C to 38 °C depending on the pre-enrichment temperature given by the specific standard.Transfer material from the resulting culture to a selective enrichment medium or a solid selective medium following the method given by the appropriate standard.According to EN ISO 6579-1, it is permissible to store the pre-enriched sample after incubation at (5 ± 3 °C) for a maximum of 72 h before transferring to the selective enrichments.StorageStore at +10 °C to +30 °C, dry and tightly closed. Do not use clumped or discolored medium. Protect from UV light (including sun light). For in vitro use only.According to ISO 6579-1/-2, ISO 21528-1 and ISO 22964, self-prepared BPW can be stored in closed containers at (5 ± 3 °C) in the dark and protected against evaporation for up to six months.Merck, Millipore, and Sigma-Aldrich are trademarks of Merck KGaA, Darmstadt, Germany or itsaffiliates. Detailed information on trademarks is available via publicly accessible resources.Quality ControlFunction Control strains Incubation ReferencemediumMethod ofcontrolExpectedresultsProductivitySalmonellaTyphimuriumATCC® 14028[WDCM 00031](18 ± 2 h)at(37 ± 1 °C)aerobic-Qualitativeaspre-enrichmentmediumGrowth(good to verygood turbidity) SalmonellaEnteritidisATCC® 13076[WDCM 00030]Escherichia coliATCC® 25922[WDCM 00013]Escherichia coliATCC® 8739[WDCM 00012]CronobactersakazakiiATCC® 29544[WDCM 00214](18 ± 2 h)at(34 - 38 °C)aerobicCronobactermuytjensiiATCC® 51329[WDCM 00213]Salmonella AbonyNCTC 6017[WDCM 00029](18 - 24 h)at(30 - 35 °C)aerobicDilution Escherichia coliATCC® 25922(WDCM 00013)(45 min to 1 h)atlaboratoryambienttemperature)(18 - 27 °C)Tryptic SoyAgar (TSA)Quantitativeasdilutionmedium± 30 % oforiginal count(70-130 %) Escherichia coliATCC® 8739(WDCM 00012)StaphylococcusaureusATCC® 25923(WDCM 00034)Please refer to the actual batch related Certificate of Analysis.The performance test is in accordance with the current version of EN ISO 11133, EN ISO 6887-1, EN ISO 21528-1, EN ISO 22964 and EP 2.6.31.Merck, Millipore, and Sigma-Aldrich are trademarks of Merck KGaA, Darmstadt, Germany or itsaffiliates. Detailed information on trademarks is available via publicly accessible resources.LiteratureAPHA (2015) Compendium of Methods for the Microbiological Examination of Foods. 5th ed. American Public Health Association, Washington, D.C.Edel, W. and Kampelmacher, E. H. (1973): Comparative studies on the isolation of …sublethally injured” Salmonellae in nine European laboratories. Bull. WHO 48: 167-174.European Directorate for the Quality of Medicines and Healthcare (2019): The European Pharmacopoeia. 10th Ed. Chapter 2.6.31 Microbiological examination of herbal medicinal products for oral use and extracts used in their preparation. Strasbourg, France.FDA-BAM (2020): Chapter No. 5: Salmonella. U.S. Food and Drug Administration - Bacteriological Analytical Manual.FDA-BAM (2018): Chapter No. 29: Cronobacter. U.S. Food and Drug Administration - Bacteriological Analytical Manual.FDA-BAM (2018): Media Index for BAM - BAM Media M192: Buffered Peptone Water (BPW). Food and Drug Administration - Bacteriological Analytical Manual.ISO International Standardisation Organisation. Microbiology of the food chain - Horizontal method for the detection, enumeration and serotyping of Salmonella - Part 1: Horizontal method for the detection of Salmonella spp. + Amendment 1. EN ISO 6579-1:2017/Amd1:2020.ISO International Standardisation Organisation. Microbiology of the food chain - Horizontal method for the detection, enumeration and serotyping of Salmonella – Part 2: Enumeration by a miniaturized most probable number technique. EN ISO/TS 6579-2:2012.ISO International Standardisation Organisation. Microbiology of the food chain - Preparation of test samples, initial suspension and decimal dilutions for microbiological examination. EN ISO 6887 (all parts).ISO International Standardisation Organisation. Microbiology of the food chain - Preparation of test samples, initial suspension and decimal dilutions for microbiological examination - Part 1: General rules for the preparation of the initial suspension and decimal dilutions. EN ISO 6887-1:2017.ISO International Standardisation Organisation. Microbiology of food, animal feed and water - Preparation, production, storage and performance testing of culture media + Amendment 1 + Amendment 2. EN ISO 11133:2014/Amd1:2018/Amd2:2020.ISO International Standardisation Organisation. Water quality - Detection of Salmonella spp. EN ISO 19250:2010.ISO International Standardisation Organisation. Microbiology of food chain - Horizontal methods for the detection and enumeration of Enterobacteriaceae - Part 1: Detection of Enterobacteriaceae. EN ISO 21528-1:2017.ISO International Standardisation Organisation. Microbiology of the food chain - Horizontal method for the detection of Cronobacter spp. EN ISO 22964:2017.Mooijman, K.A. (2012): Culture media for the isolation of Salmonella. In: Handbook of Culture Media for Food and Water Microbiology. (Corry, J.E.L., Curtis, G.D.W. and Baird, R.M. eds). pp. 261-286. Royal Society of Chemistry, Cambridge, UK.Merck, Millipore, and Sigma-Aldrich are trademarks of Merck KGaA, Darmstadt, Germany or itsaffiliates. Detailed information on trademarks is available via publicly accessible resources.©Ordering InformationProduct Cat. No. Pack size EcoCult® Buffered Peptone Water1.40141.0500 500 g acc. ISO 6579, ISO 6887, ISO 21528, ISO 22964,FDA-BAM and EPEcoCult® Buffered Peptone Water1.40141.5000 5 kg acc. ISO 6579, ISO 6887, ISO 21528, ISO 22964,FDA-BAM and EPEcoCult® Buffered Peptone Water1.40141.9010 10 kg acc. ISO 6579, ISO 6887, ISO 21528, ISO 22964,FDA-BAM and EPGranuCult® Buffered Peptone Water acc. ISO 6579,1.07228.0500 500 g ISO 6887, ISO 21528, ISO 22964, FDA-BAM and EPGranuCult® Buffered Peptone Water acc. ISO 6579,ISO 6887, ISO 21528, ISO 22964, FDA-BAM and EP 1.07228.5000 5 kg GranuCult® Buffered Peptone Water acc. ISO 6579,ISO 6887, ISO 21528, ISO 22964, FDA-BAM and EP 1.07228.9010 10 kgGranuCult® Buffered Peptone Water acc. ISO 6579,1.07228.9025 25 kg ISO 6887, ISO 21528, ISO 22964, FDA-BAM and EPReadybag® Buffered Peptone Water acc. ISO 6579,1.00901.0001 60 bags ISO 21528, ISO 22964, FDA-BAM and EP, 29 g, irradiatedReadybag® Buffered Peptone Water acc. ISO 6579,1.00908.0001 35 bags ISO 21528, ISO 22964, FDA-BAM and EP, 86 g, irradiatedMerck, Millipore, and Sigma-Aldrich are trademarks of Merck KGaA, Darmstadt, Germany or itsaffiliates. Detailed information on trademarks is available via publicly accessible resources.© 2018 Merck KGaA, Darmstadt, Germany and/or its affiliates. All Rights Reserved.。
高效液相色谱法测定复方氨基丁酸维E胶囊中谷维素含量
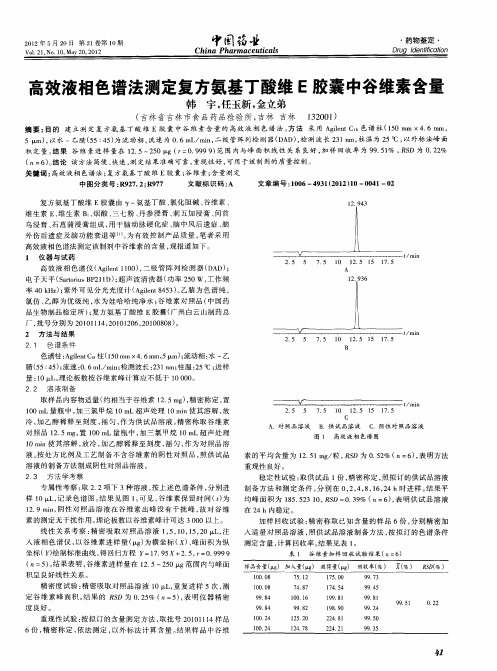
t m i / n
A.对 照 品 溶 液 B .供 试 品 溶 液 C .阴性 对 照 品 溶 液
图 1 高效 液 相 色谱 图
1 a n使其溶解 , 0r i 放冷 , 乙醇稀释至刻度 , 匀 , 加 摇 作为对照品溶
21 0 2年 5月 2 日 第 2 0 1卷第 1 0期
Vo . 1 No 1 , a 0 2 1 1 2 , . 0 M y2 , 0 2
Chi a Ph r a e tc s n a m c u ial
中 l茜
・
药 物鉴 定 ・
D u d nic t n r g Ie t a i i f o
积 定 量 。 果 谷 维 素 进 样 量 在 1. 结 2 5~20 g( =09 99 范 围 内与 峰 面 积 线 性 关 系 良好 , 样 回 收 率 为 9 . 1 , S 为 0 2 % 5 r .9 ) 加 95% RD .2
( 6可靠, 测 重现性好 , 可用于该制 剂的质量控制。
2 2 溶 液制 备
取 样 品 内容 物 适 量 ( 相 当于 谷 维 素 l . g , 密称 定 , 约 2 5m )精 置 10m 0 L量 瓶 中 , 三 氯 甲烷 1 加 0mL超 声处 理 1 an使 其 溶 解 , 0r i 放 冷 , 乙 醇 稀 释 至 刻 度 , 匀 , 为 供 试 品 溶 液 。 密 称 取 谷 维 素 加 摇 作 精 对 照 品 1. g 置 10mL量 瓶 中 , 三 氯 甲烷 1 L超 声 处 理 2 5m , 0 加 0m
复方氨基丁酸维 E胶囊 由 ^一氨基丁酸 、 y 氯化胆碱 、 谷维 素 、
- 1、下载文档前请自行甄别文档内容的完整性,平台不提供额外的编辑、内容补充、找答案等附加服务。
- 2、"仅部分预览"的文档,不可在线预览部分如存在完整性等问题,可反馈申请退款(可完整预览的文档不适用该条件!)。
- 3、如文档侵犯您的权益,请联系客服反馈,我们会尽快为您处理(人工客服工作时间:9:00-18:30)。
1. Which operation can you perform on the FURUNO ECDIS? ( B )a. I can play back my ship’s past track on the ECDISb. I can record my position manually on the RNCs.c. I can create Notes from my Voyage Log to document a voyage on the charts.d. I can set the ECDIS to include engine log information into the Voyage Log automatically.2. Which operation can you perform on the FURUNO ECDIS? ( A )a. I can record my position manually on the ENCs.b.I can set the ECDIS to automatically choosing a Safety contour based on my setting of ship’smaximum draft.c. I can set Ship’s maximum height to enable chart alerts from areas in the charts where there isnot sufficient air draft.d. I can send a copy of my Route Plan to an AIS target as a Safety Message.3. Which operation can you perform on the FURUNO ECDIS? ( C )a. I can record target ship’s position in the Voyage log automatically.b. I can record a position fix manually by using just one distance and one bearing.c. I can playback my past voyage track on the charts.d. I can send my Route Plan and User Chart to a FURUNO GPS for display on the GPS.4. Which operation can you perform with the FURUNO ECDIS? ( D )a. I can send my Route Plan and User Chart to any RADAR for display on the RADAR.b. I can send my Route Plan and User Chart to any AIS for display on the AIS.c. I can send my Route Plan and User Chart to any GPS for display on the GPS.d. I can send my Route Plan and User Chart to a FURUNO RADAR for display on the RADAR.5. Which operation can you perform during a voyage? ( A )a. I can use the Event function to record special events in the Event Log.b. I can create a User Chart from the Alert Log and save it to a USB memory device.c. I can create a User Chart from the Chart Usage Log and save it to a USB memory device.d. I can create a User Chart from the Voyage Log and save it to a USB memory device.6. Which operation can you perform after completion of a voyage? ( D )a. I can add additional records of manual positions to the Voyage Log adding further details tothe past voyage.b. I can create a User Chart from the monitored Route Plan and save it to a USB memory device.c. I can create a backup copy of the Voyage log on a USB memory device.d. I can view and print a copy of the Chart Usage Log.7. Which operation can you perform during a voyage or after completion of a voyage? ( B )a. I can use the Event function to record special events in the Details Log.b. I can view and print a copy of the Voyage Log. (或更换为Details Log)c. I can create a backup copyof Own Ship’s past track (120 minutes max.) on a USB memorydevice and keep the copy in a safe location for future reference.d. I can reset the Chart Usage Log after creating a backup copy.8. What is a Manual Update? ( B )a. A Manual Update is an update applied using the Manual function in Load & Update Charts.b. A Manual Update is an update to the charts created by the operator from information receivedfrom the Pilot–a Navtex message–a VHF broadcast etc.c. A Manual Update is an update applied to the charts by an official representative of the chartproducer.d. A Manual Update is a chart created using the digitizer function of the FURUNO ECDIS.9. When do you use Manual Update? ( B )a. Always when I have to update my charts.b. When I receive information which must be displayed on my ECDIS and this is not yetincluded in the official weekly updates.c. I should never use Manual Updates.d. When I have to update the software of the ECDIS.10. Where can Manual Updates be displayed? ( D )a. Only on ENCs.b. Only on RNCs.c. Only on Vector Charts.d. On all types of charts in the ECDIS.11. How can you see if a chart object is created using Manual Updated? ( D )a. The Manual Update will be larger than any other chart objects.b. It is always shown in red.c. It will have a special orange marker.d. There is no way I can see if a chart object is created using Manual Updates.12. Can you copy your Manual Updates from one FURUNO ECDIS to another? ( A )a. No.b. Yes-by using the Backup and Restore dialogue to transfer the Manual Updates to a USB.c. Yes-by sending the Manual updates via an email.d. No-but I can transfer them to another manufacturer’s type of ECDIS.13. Can you create a Manual Update from an AIS Safety Message shown on the ECDIS? ( A )a. Yes-by manually creating the object.b. Yes-by letting the ECDIS create the object automatically.c. Yes-either by creating it manually or letting the ECDIS create it automatically.d. No.14. Can you create a Manual Update from an Navtex Message shown on the ECDIS? ( A )a. Yes-by manually creating the object.b. Yes-by letting the ECDIS create the object automatically.c. Yes-either by creating it manually or letting the ECDIS create it automatically.d. No.15. What should you remember to set up before planning a route? ( D )a. The setting for the Voyage Log.b. The Alarm Level in the Operation submenu.c. The Conning Display in Installation Parameters.d. The Chart Viewing Dates.16. What should you do if you have to leave your planned route duringa voyage? ( D )a. Switch off the FURUNO ECDIS and concentrate on the RADAR.b. Disable the route monitoring on the FURUNO ECDIS.c. Change the display of the FURUNO ECDIS to IMO All Other.d. Configure and enable the Check Area function to assist me in scanning the ENCs for dangerto navigation and hazardous objects.17. How do you record Own Ship’s position on the ECDIS charts when you have aRange/Bearing observation from your RADAR? ( B )a. I cannot record own ship’s position manually on the FURUNO ECDIS.b. I record LOP in the Record function of the Event Log.c. I press the [CTRL] & [ACQ/ACT] button on the Control Unit.d. I select [Record] [Event Log] and [User Event] from the Instant Access bar and insert theobservation in the Record User Event window.18. How do you document your previous voyage on the FURUNO ECDIS? ( D )a. I use my paper Logbook as documentation.b. I use my paper Logbook and my VDR or SVDR as documentation.c. I use the tracking function in the symbol display.d. I show a playback of my past voyage track on the charts.19. Where can you find a list of the Manual Updates that have been applied to the FURUNOECDIS? ( B )a. In the Chart Legend.b. In the Manual Update Window.c. In the Chart Catalogue.d. In the Chart Display menu.20. Which color scheme is used for Manual update on the FURUNO ECDIS? ( B )a. Blue ENC symbols.b. Standard ENC symbols.c. Orange ENC symbols.d. Red ENC symbols.21. Where do you change the Target past position density? ( C )a. In the Quick Access bar.b. In Chart Display.c. In the symbol display.d. In the Status bar.22. Where do you change the Tracked Target size? ( C )a. In the Quick Access bar.b. In Chart Display.c. In the symbol display.d. In the Status bar.23. What does the alert number 495 indicate? ( A )a. Anchor watch errorb. Track control stopped.c. Steering parameter errord. Filter: Init. Error24. What does the alert number 635 indicate? (A)a. No official datab. Log errorc. Dual axis log (WT) errord. Dual axis log (BT) error25. What does the alert number 257 indicate? ( D )a. Heading sensor not availableb. Prg track: Need higher speedc. Prg track: Use radius Ctrld. Gyro 3 COM error26. What does the alert number 450 indicate? ( D )a. Route: Illegal To WPTb. RADAR comm. errorc. LAN adapter version errord. Heading sensor not available27. What does the alert number 640 indicate? ( B )a. Datum mismatchb. Chart align: Over 30 min.c. RADAR antenna ID errord. Gyro error (Trackpilot)28. Where do you set the Shallow Contour? ( C )a. In Chart Legendb. In Symbol Displayc. In Chart Alertd. In Chart Display29. Where do you set the Shallow Pattern? ( C )a. In Chart Displayb. In Symbol Displayc. In Basic Settingd. In chart catalogue30. Where do you set the Deep Contour? ( C )a. In Chart Legendb. In Symbol Displayc. In Chart Alertd. In Chart Display31. Where do you control the AIO? ( C )a. In Chart Legendb. In Symbol Displayc. In Chart Displayd. In Chart Catalogue32. When an ENC is outlined in Green in the Chart Catalogue–it means? ( A )a. License is valid–chart is up-to-dateb. License is valid–chart is NOT up-to-datec. License is available–chart not installedd. License is not available or has expired33. When an ENC is outlined in Yellow in the Chart Catalogue–it means? ( C )a. License is valid–chart is up-to-dateb. License is available–chart not installedc. License is valid–up-to-date status doubtfuld. License is not available or has expired34. Which information can you find in the Raster Chart Legend? ( D )a. Magnetic Variationb. Safety Contour settingc. Quality of datad. T&P Notice35. Which information can you find in the Raster Chart Legend? ( C )a. Edition numberb. Last displayed updatec. Edition dated. Update issue date36. Which information can you find in the Raster Chart Legend? ( B )a. Shallow Contourb. Chart Namec. Chart Viewing dated. Deep Contour37. Where can you find information concerning the charts stored on the HDD? ( C)a. On the Internetb. The Chief Officer will know.c. In the chart catalogued. In the Chart Display menu38. Which recording function is available in the FURUNO ECDIS? ( A )a. Danger Targets Logb. Engine Logc. Speed Logd. GPS Log39. Which recording function is available in the FURUNO ECDIS? ( C )a. AIS Logb. Engine Logc. Voyage Logd. RADAR Log40. Where do you set system priority of multiple GPS connected to the ECDIS? ( A)a. In the Sensor dialogueb. In Basic Settingc. In Ship and Route Parametersd. In Nav Tools41. Where do you find information on the software version of the FURUNO ECDIS? ( C )a. In the Voyage Logb. In the System dialogue of the Menuc. In the About dialogued. In the S52 Presentation Library42. Which ECDIS setting is adjusted in Ship and Route Parameters? ( D )a. Position offsetb. Safety Contourc. Alarm volumed. Ship’s maximum speed43. Which printing option is available for the User Chart? ( B )a. Circle Reportb. Full Reportc. System Reportd. Detailed Report44. What is the maximum limit of the Check Area? ( B )a. No limitb. 240min + 20NM + 5km + 999mc. 120min + 10NM + 3km + 500md. 999min + 999NM + 999km + 999m45. How do you hide (not delete) a Manual Update object? ( C )a. I select Clear from the Manual Updates menub. I select Undo Last from the Manual Updates menuc. I deselect that general type of chart object in the Chart Display dialogued. I deselect the option from the Symbol Display dialogue46. Can you set the overall maximum speed for a route plan? ( A )a. Yes in the Ship and Route parameters of the Menub. Yes in Chart Displayc. Yes in Optimization parametersd. Yes in the route planning tool47. Can you monitor a route even though it indicates an active Alert when you have completed theRoute Plan Check? ( A )a. Yes–the only thing preventing me from monitoring would be an impossible Turn message inthe WPT tab.b. Yes–if I enter the Service Safety Passwordc. Nod. It depends on the type of Alert generated (Safety Contour–Restricted Area–Caution Area etc.)48. How are loaded ENCs converted into SENCs when updating? ( A )a. The FURUNO ECDIS will normally convert the ENCs to SENCs automaticallyb. I must use the conversion tool from the Menuc. I cannot convert ENCs into SENCsd. I load the new Permit file using the file named ENC. PMT and then I use the S52 presentationLibrary from the System menu in the Chart Menu to convert the ENCs into SENCs.49. How do you manually record Own Ship’s current position in the Logs? ( D)a. By opening the Voyage Log and entering the current position.b. By right clicking on own ship icon on the user interface.c. By pressing the Record button on the Control Unit..d. By using the record position event function of the Event Log.50. How do you add navigational chart objects to the FURUNO ECDIS when you are required to doso byNotice To Mariners? (或改为a Navtex message / information received via VHF broadcast) ( B )a. I cannot add any chart objects to the ECDIS unless they are included in the weekly updateCDs.b. I use the Manual Updates function.c. I use the User Chart function.d. I use the Chart Edit function.51. Which of these setting generate an alarm from the Chart Alert setting?( C )a. Shallow Contourb. Safety Depthc. Safety Contourd. Deep Contour52. Can you plan a route while you monitor another route? ( C )a. Nob. Yes but only if I have two ECDISc. Yes the route planning function is independent from the route monitoring function.d. Yes but I must select the same Safety Contour for both route plans.53. How do you save your route to the Hard Disc Drive when it has been edited? ( B )a. I don’t. The route is automatically saved to the hard disc drive whenever changes are applied.b. I click on Save or Save As in the Route Planning tool.c. I select Save in the Backup and Restore dialogue.d. I click New in the Route Planning tool.54. What is the purpose of Kalman Filter? ( C )a. The Kalman filter is the Antivirus software running on the FURUNO ECDIS.b. The filter is used to calculate an astronomical position from several astronomical observationsentered by the operator.c. The filter continuously monitors the position given by each individual position sensor todetermine if the sensor is reliable or not.d. The filter is used to verify the quality of data on the Base and Update CDs.55. How do you switch the Kalman filter on or off? ( B )a. The Kalman filter is always switched on when a route is put into monitor mode and switchedoff when there is no route being monitored.b. The Kalman filter is always on so I never have to switch it on or off.c. The Kalman filter is switched on or off in the Sensor menu on the Position tab.d. The Kalman filter is switched on when steering is switched to Autopilot.56. How do you update your vector charts on the Furuno ECDIS using the ENC update CD? ( A )a. I use the AutoLoad function.b. I create a Manual Update from the information on the CD.c. I create a User chart.d. I import the information using the Chart Details function in the Chart Catalogue.57. Which setting can be changed in Sensors? ( A )a. Log stabilization mode.b. Safety Contour setting.c. Safety Depth setting.d. Kalman Filter setting.58. How do you open the User Chart planning tool? ( A )a. I selec t “Planning” and then “User Chart” in the Quick Access bar when in Plan mode.b. I select “Planning” and then “User Chart” in the Quick Access bar when in Navi mode.c. I select Manual Update from the Menu in Charts mode.d. I left click on User Chart in the information sidebar–then I select Plan.59. Where do you select the color Palette used to display the charts? ( C )a. In Chart Legend.c. In Quick Access Bar.d. In Chart Catalogue.60. Where do you control the settings and visibility of the chart layers? ( C )a. In Chart Legendb. In Symbol Displayc. In Chart Displayd. In Basic Setting61. Where do you control the visibility of the user overlays (User Chart–Route–etc.)? ( B )a. In Chart Legendb. In Symbol Displayc. In Chart Displayd. In Chart Catalogue62-1. Where do you change the visibility of your User Chart (或改为monitored route / plannedroute/circles)? ( B )a. In Chart Legendb. In Symbol Displayc. In Chart Displayd. In Chart Catalogue62-2. Where do you change the Ship Outlines (或改为Velocity Vectors style)? ( C )a. In the Quick Access barb. In Chart Displayd. In the Status bar63. How are regular T&Ps updated on the ECDIS? ( C )a. T&Ps must always be created as manual Updates.b. I create a Manual Update containing the T&Ps using the Manual function in the Load &Update function of the Chart Menu.c. Most T&Ps are included in the weekly update CD and these are updated automaticallytogether with the other updates on the CD.d. I can not update T&Ps on the FURUNO ECDIS.64. Where can you update the ENCs? ( A )a. In the Chart Manager (Individual Update).b. In the Update function of chart displayc. In the Update function of the System settings.d. In the Update function of the Chart Legend.65. How can you reset the odometer? ( A )a. I can reset the odometer from the Voyage tab of the Menu.b. I can reset the odometer from the Sensor setting dialogue.c. I can reset the odometer from the Symbol Display dialogue.d. I can reset the odometer from the Quick Access sidebar.66. When the software of the FURUNO ECDIS is being updated–it is important that? ( C )a. The software should be loaded from a USB memory device.b. The FURUNO ECDIS is put in standby mode before updating.c. You create backup copies of all critical info in the ECDIS before updating.d. The ECDIS is disconnected from the RADRA.67. What should you remember to set up first when planning a route? ( C )a. The setting for the Voyage Log.b. The Alarm Level in the Operation submenu.c. The safety Contour in the route planning tool.d. The Radar overlay.68. Where can you enter information notes on Pilot data (VHF channels etc.) to be used duringmonitoring in the FURUNO ECDIS? ( D )a. In the Voyage Log.b. In the Pilot Data.c. In the User Event function.d. In the User Chart.69. How do you start the route planning tool? ( D )a. I press Plan on the Control Unit.b. I click on the Route icon in the Status bar.c. I select Route Plan from the Menu dialogue.d. I click on Route in the Quick Access bar.70. How do you modify an existing Manual Update object? ( D )a. I use the ENC tab of the Chart maintenance function.b. I use the Mainer tab of the Symbol Display function.c. I cannot modify a Manual Update–only delete it.d. I use the List tab of manual Update tool function.71. Where do you find information on the presentation library used in the FURUNO ECDIS? ( D )a. In the Basic Setting of the Menu.b. In the Record function of the Quick Access bar.c. In the System dialogue of the Menud. In the About dialogue72-1. How can you verify which route is being monitored? ( B )a. The name of the route will be displayed on my own ship vector.b. The name of the route will be displayed in the Route Information box.c. By right clicking on own ship icon.d. I cannot get information on the route which is being monitored.72-2. How can you verify which route is being monitored? ( C )a. By clicking on “Route” and then on “Route Info” in the Quick Access Sidebar in Plan mode.b. The name of the route will be displayed in the Status Bar.c. By clicking on “Route” and then on “Route Info” in the Quick Access Sidebar in Navi mode.d. I cannot get information on the route which is being monitored.73. How can you verify which User Chart is being monitored? ( D )a. The name of the User Chart will be displayed in the top right corner of the ECDIS screen.b. The name of the User Chart will be displayed in the information sidebar.c. By clicking on “Route” and then on “Route Info” in theQuick Access Bar when in Plan moded. By clicking on “Route” and then on “Route Info” in the Quick Access Bar when in Navimode74. How can you tell if your FURUNO ECDIS is displaying an ENC? ( D )a. There is an “ENC Data available” indication in the Own Ship Funct ion Box.b. There is an “RNC Data” indication in the Own Ship Function Box.c. The FURUNO ECDIS will give an audible alarm if I am not viewing an ENC.d. There is no special indication in the Own Ship Function Box.75. Where do you set up the chart watch sector to scan the ENCs for problems along own ship’sheading line? ( D )a. In Chart Display settingsb. In Chart Alert settingsc. In Basic settings.d. In Check Area settings.76. Which Manual Update objects can be hiden from view by operator selection? ( B )a. Only the Manual Updates Special Areas (from the Chart Display dialogue)b. All Manual Updates objects (from the Chart Display dialogue)c. Only the Manual Updates Buoys (from the Chart Display dialogue)d. Only the Manual Updates Soundings (from the Chart Display dialogue)77. Where can you change the setting of the Safety Contour which is used during planning of a route?( D )a. Nowhere–because I must never change the setting for the Safety Contour.b. In the Settings menu and I can only change the setting if I have the service passwordc. In chart alertd. In the route planning tool78. Where do you offset own ship chart position on the FURUNO ECDIS? ( D )a. In symbol displayb. In chart displayc. In chart menud. In own ship function box79. Where do you control the Safety Contour displayed on the charts on FURUNO ECDIS? ( A )a. In Chart Alertb. In the route planning tool–on the Alerts tabc. In Chart Displayd. No where–it is set up automatically80. Where do you find information on magnetic Variation in the ENCs on the FURUNO ECDIS?( D )a. In Chart Displayb. In Chart Cataloguec. In Chart Alertd. In Chart Legend81. Can you edit a route without removing it from the route monitoring function? ( A )a. Nob. Yes but I must copy it to another ECDIS where it can be edited without interfering with themonitoring function of the FURUNO ECDIS.c. Yes if I create a copy of the route plan in ANTS format on a USB and edit the file on anormal office PCd. Yes if I select copy from monitor in the Route plan menu and edit the copy. When copying iscompleted I select-Exchange with monitor in the Route Plan Menu82. What is the name of category of charts generated by the user to draw up contingency areas–NoGo areas–clearing lines etc.? ( C )a. Private Chartb. Pilot Datac. User Chartd. Non HO Chart83. Where can you display your planned or monitored User Charts on the FURUNO ECDIS? ( B )a. Only on official chartsb. On all chartsc. Only on vector chartsd. Only on raster charts84. How do you select which User Chart to monitor? ( A )a. By linking it to the monitored Route Plan in the route planning tool.b. By clicking Display–User Chart in the Quick Access Bar.c. By right clicking on the chart area.d. By left clicking on the chart area.85. How do you get information on an ENC object (Buoy-Beacon-Berth etc.) on the FURUNOECDIS? ( C )a. I right click on the User Chart function in the route planning tool.b. I click on the Chart Info in the Instant Access Bar.c. I center click on the object.d. I right click on the object.86. How can you reset the trip counter? ( B )a. I can reset the Trip Counter by resetting the Voyage Log in the Reset submenu of the Recordmenu.b. I can reset the Trip Counter by resetting the Voyage tab of the Menu.c. I cannot reset the Trip Counter.d. The Trip Counter can be reset by deleting it using the Backup and Restore dialogue.87. What is a Point in the User Chart? ( B )a. A point is used to create a Manual Update from a chart object.b. A point is used to denote/highlight the position of a chart object with the User Chart.c. A point is the end of a User Chart.d. A point is used to connect the User Chart with a route plan.88. Where do you switch between Multicolor and Two Color setting for the charts? ( C )a. In Chart Legend.b. In Symbol Display.c. In Basic Settingd. In Chart Display89. How do you change the User Chart being used for monitoring? ( A )a. I move the monitored route plan to planning mode and edit the Linked User Chart setting.b. I select a different user chart from the Menu to monitor.c. I select User Chart from the planning sidebar and then I select Monitor for the desired userchart.d. I left click on User Chart in the Status Bar and then I select Plan.90. How do you enter information notes in the User Chart? ( A )a. I select Note as an option for the Area Line or Circle where the information should bedisplayed.b. I select Note as an option for the Tidal Label or Clearing Line where the information shouldbe displayed.c. I select User Chart from the Main menu and then I select Plan and enter the note to bedisplayed.d. I left click on Route in the Quick Access Bar and then I select Monitor91. What is the recommended loading sequence when you receive new charts-updates and permits?( D )a. There is no recommended sequence.b. #1:Base CDs#2: Update CD #3: Permitc. #1: Permit #2: Update CD #3: Base CDsd. #1: Permit #2: Base CDs #3: Update CD92. Can you edit the User Chart when the ECDIS is in Navi mode? ( D )a. Yesb. Only if the User Chart is not linked to a route plan.c. Yes if the User Chart contains no tidal information.d. No.93. When the software of the FURUNO ECDIS is being updated–it is important that? ( A )a. The software is updated by a FURUNO Service Engineer.b. The software is updated by the Captain.c. The software is updated by the Ship’s Electrical Engineerd. The software is updated by an IMO representative.When an ENC is outlined in Magenta in the Chart Catalogue - it means? CA. License is valid - chart is up-to-date.B. License is valid - chart is NOT up-to-dateC. License is available - chart not installedD. License is valid - up-to-date status doubtful.What does the alert number 257 indicate? DA. Heading sensor not availableB. Prg track: Need higher speedC. Prg track: Use radius CtrlD. Gyro 3 COM errorWhat does the alert number 470 indicate? DA. WGS 84 not usedB. Different geodetic datumC. Sentence syntax errorD. Datum changeWhat does the alert number 031 indicate? BA. Sensor adapter 1 COM timeoutB. Sensor adapter 2 COM timeoutC. Sensor adapter 3 COM timeoutD. Sensor adapter 4 COM timeout单选题] What does the alert number 640 indicate? BA. Datum mismatchB. Chart align: Over 30 min.C. RADAR antenna ID errorD. Gyro error (Trackpilot)What does the alert number 635 indicate? AA. No official dataB. Log errorC. Dual axis log (WT) errorD. Dual axis log (BT) errorWhat does the alert number 380 indicate? CA. Route: File read errorB. User chart: File not foundC. AIS COM errorD. User chart: File read error单选题] What does the alert number 495 indicate? AA. Anchor watch errorB. Track control stoppedC. Steering parameter errorD. Filter: Init. ErrorWhat does the alert number 450 indicate? DA. Route: Illegal To WPTB. RADAR comm. errorC. LAN adapter version errorD. Heading sensor not available单选题] What does the alert number 820 indicate? CA. AIS lostB. TT lostC. Navtex message receivedD. Cross track alarmWhich information can you find in the Vector Chart Legend? CA. Notices To MarinersB. Presentation Library edition numberC. Chart edition && Update dateD. Safety Contour settingWhen an ENC is outlined in Magenta in the Chart Catalogue - it means? C A. License is valid - chart is up-to-date.。