measurement Internet
检测技术与自动化装置

检测技术与自动化装置081102学科专业简介“检测技术与自动化装置”专业是研究被控对象的信息提取、转化、传递和处理的理论、方法与技术的一门学科,是信息学在工业自动化领域的具体实现。
随着微电子技术、计算机技术、计算机网络技术及智能化控制就是对工业自动化领域的渗透和推动,信息化已经成为工业自动化过程的一个重要特征和发展趋势,也是本学科的主要研究方向。
“检测技术与自动化装置”学科点原为“电力系统及其自动化”学科点的前身“铁道牵引电气化与自动化”学科点的一个专业方向——检测与故障诊断技术研究方向。
“铁道牵引电气化与自动化”学科点是国务院学位委员会批准的首批(1980年)硕士学位授予点。
1995年从“电力系统及其自动化”学科点分离成立“检测技术与自动化装置”学科点,并同年获得硕士学位授予权。
二十年来陆续培养了36名硕士研究生。
目前本学科点有教授2名、副教授5名。
多年来学科承担了数十项国家和部、市级的重点研究项目,并有多项获国家和部、市成果奖。
目前的主要研究内容有:电量与非电量的检测技术与仪表;工业控制网络;现场总线技术、工业控制计算机装置与系统;控制系统的故障诊断技术等。
一、培养目标1、较好地掌握马克思主义基本原理、毛泽东思想、邓小平理论和“三个代表”重要思想,树立正确的世界观、人生现和价值观,坚持四项基本原则,热爱祖国,遵纪守法,品德优良,乐于奉献,积极为社会主义现代化建设服务。
2、在本学科领域内,较好地掌握坚实宽广的基础理论和系统深入的专门知识,并熟悉相关学科的基础理论和知识,具有较强的独立从事科学研究工作的能力;在科学或专门技术上能够做出有新意的成果;具有严谨求实的学风;至少掌握一门外国语。
3、具有健康的身体素质和健康的心理素质。
二、研究方向1.微机测控装置与系统2.测控系统与诊断技术3. 检测技术与智能化仪表三、学制及学习年限硕士生学制为2.5年,其中课程学习1~1.5年,论文工作不少于1年。
硕士生的在校学习年限最长不超过4年。
IP协议号详解
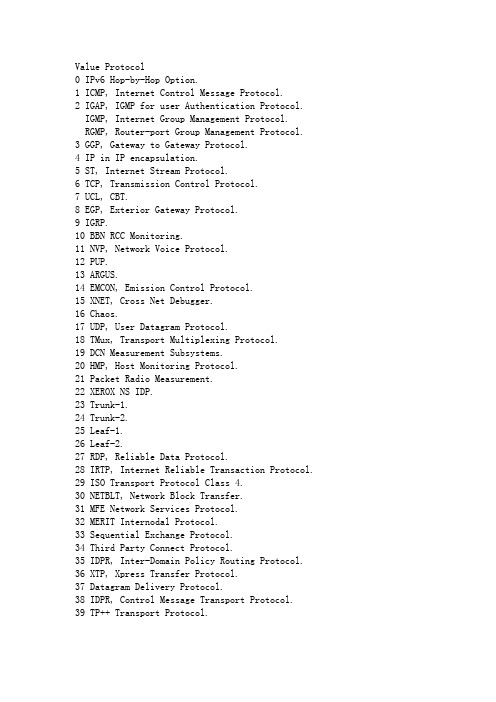
Value Protocol0 IPv6 Hop-by-Hop Option.1 ICMP, Internet Control Message Protocol.2 IGAP, IGMP for user Authentication Protocol. IGMP, Internet Group Management Protocol. RGMP, Router-port Group Management Protocol.3 GGP, Gateway to Gateway Protocol.4 IP in IP encapsulation.5 ST, Internet Stream Protocol.6 TCP, Transmission Control Protocol.7 UCL, CBT.8 EGP, Exterior Gateway Protocol.9 IGRP.10 BBN RCC Monitoring.11 NVP, Network Voice Protocol.12 PUP.13 ARGUS.14 EMCON, Emission Control Protocol.15 XNET, Cross Net Debugger.16 Chaos.17 UDP, User Datagram Protocol.18 TMux, Transport Multiplexing Protocol.19 DCN Measurement Subsystems.20 HMP, Host Monitoring Protocol.21 Packet Radio Measurement.22 XEROX NS IDP.23 Trunk-1.24 Trunk-2.25 Leaf-1.26 Leaf-2.27 RDP, Reliable Data Protocol.28 IRTP, Internet Reliable Transaction Protocol.29 ISO Transport Protocol Class 4.30 NETBLT, Network Block Transfer.31 MFE Network Services Protocol.32 MERIT Internodal Protocol.33 Sequential Exchange Protocol.34 Third Party Connect Protocol.35 IDPR, Inter-Domain Policy Routing Protocol.36 XTP, Xpress Transfer Protocol.37 Datagram Delivery Protocol.38 IDPR, Control Message Transport Protocol.39 TP++ Transport Protocol.40 IL Transport Protocol.41 IPv6 over IPv4.42 SDRP, Source Demand Routing Protocol.43 IPv6 Routing header.44 IPv6 Fragment header.45 IDRP, Inter-Domain Routing Protocol.46 RSVP, Reservation Protocol.47 GRE, General Routing Encapsulation.48 MHRP, Mobile Host Routing Protocol.49 BNA.50 ESP, Encapsulating Security Payload.51 AH, Authentication Header.52 Integrated Net Layer Security TUBA.53 IP with Encryption.54 NARP, NBMA Address Resolution Protocol.55 Minimal Encapsulation Protocol.56 TLSP, Transport Layer Security Protocol using Kryptonet key management57 SKIP.58 ICMPv6, Internet Control Message Protocol for IPv6.MLD, Multicast Listener Discovery.59 IPv6 No Next Header.60 Destination Options for IPv6.61 Any host internal protocol.62 CFTP.63 Any local network.64 SATNET and Backroom EXPAK.65 Kryptolan.66 MIT Remote Virtual Disk Protocol.67 Internet Pluribus Packet Core.68 Any distributed file system.69 SATNET Monitoring.70 VISA Protocol.71 Internet Packet Core Utility.72 Computer Protocol Network Executive.73 Computer Protocol Heart Beat.74 Wang Span Network.75 Packet Video Protocol.76 Backroom SATNET Monitoring.77 SUN ND PROTOCOL-Temporary.78 WIDEBAND Monitoring.79 WIDEBAND EXPAK.80 ISO-IP.81 VMTP, Versatile Message Transaction Protocol.82 SECURE-VMTP83 VINES.84 TTP.85 NSFNET-IGP.86 Dissimilar Gateway Protocol.87 TCF.88 EIGRP.89 OSPF, Open Shortest Path First Routing Protocol. MOSPF, Multicast Open Shortest Path First.90 Sprite RPC Protocol.91 Locus Address Resolution Protocol.92 MTP, Multicast Transport Protocol.93 AX.25.94 IP-within-IP Encapsulation Protocol.95 Mobile Internetworking Control Protocol.96 Semaphore Communications Sec. Pro.97 EtherIP.98 Encapsulation Header.99 Any private encryption scheme.100 GMTP.101 IFMP, Ipsilon Flow Management Protocol.102 PNNI over IP.103 PIM, Protocol Independent Multicast.104 ARIS.105 SCPS.106 QNX.107 Active Networks.108 IPPCP, IP Payload Compression Protocol.109 SNP, Sitara Networks Protocol.110 Compaq Peer Protocol.111 IPX in IP.112 VRRP, Virtual Router Redundancy Protocol.113 PGM, Pragmatic General Multicast.114 any 0-hop protocol.115 L2TP, Level 2 Tunneling Protocol.116 DDX, D-II Data Exchange.117 IATP, Interactive Agent Transfer Protocol.118 ST, Schedule Transfer.119 SRP, SpectraLink Radio Protocol.120 UTI.121 SMP, Simple Message Protocol.122 SM.123 PTP, Performance Transparency Protocol.124 ISIS over IPv4.125 FIRE.126 CRTP, Combat Radio Transport Protocol.127 CRUDP, Combat Radio User Datagram.128 SSCOPMCE.129 IPLT.130 SPS, Secure Packet Shield.131 PIPE, Private IP Encapsulation within IP. 132 SCTP, Stream Control Transmission Protocol. 133 Fibre Channel.134 RSVP-E2E-IGNORE.135 Mobility Header.136-252253254 Experimentation and testing.255 Reserved.。
SLA----服务等级协议
陈文革博士后
20
广东省电信科学技术研究院
陈文革博士后
21
广东省电信科学技术研究院
陈文革博士后
22
广东省电信科学技术研究院
陈文革博士后
23
广东省电信科学技术研究院
陈文革博士后
24
广东省电信科学技术研广东省电信科学技术研究院
陈文革博士后
26
The Keynote Business 40 Internet Performance Index is the average response time of accessing and downloading the home pages of 40 important business Web Sites as measured Monday through Friday every 15 minutes between 6 am and noon Pacific time by those Keynote Perspective measurement computers that are located in metropolitan areas of the United States.
Availability Service response time(HTTP for customers)
广东省电信科学技术研究院 陈文革博士后 4
SLA的特点
SLA是对客户最关心的服务质量的承诺,而如何实现和 保证服务质量不是SLA的范畴。
邮局送信的例子 10M/100M端口、机房条件等的承诺???
4
Expressions SD_Pop_Availability AND (SD_Pop_PVC_Jitter OR SD_Pop_PVC_SignalQuality)
移动通信网的QoE测量及其量化方法
第24卷 第3期电子测量与仪器学报Vol. 24No. 3·230 ·JOURNAL OF ELECTRONIC MEASUREMENT AND INSTRUMENT2010年3月本文于2009年11月收到。
第3期 移动通信网的QoE 测量及其量化方法 · 231 ·图1 QoE 、QoS 与NP Fig. 1 QoE, QoS and NP包括终端中人机界面两侧的实体; QoS 仅考察通信中非人的实体部分; NP 则仅考察网络侧的通信性能。
2.1 QoE用户体验质量(quality of experience), QoE 定义为用户对某项业务的真实感知程度, QoE 从业务的可用性、随地可接入性、随时可接入性和完整性四个方面进行考量, 以一种量化的方式来反映最终用户对业务性能的满意程度[4]。
QoE 的量化指标可以用优秀、很好、好、一般、差5个级别来标识[1]。
决定QoE 值的因素分为两个方面:技术面因素: 端到端网络质量、网络/业务覆盖率和终端功能;非技术面因素: 业务使用简易、业务内容、资费和客户支持。
QoE 牵涉了所有参与移动通信完整价值链的各个方面: 包括用户、运营商、内容提供商或应用提供商、设备制造商或系统集成商、终端设备和应用软件。
2.2 QoS业务质量(quality of service), 定义为网络(终端、接入网和核心网)在可保证的质量水平上提供一种业务的能力。
QoS 是实现用户QoE 的技术面因素之一。
QoS 针对一项具体的业务而言, 由特定业务的功能、性能、可用性、可操作性、安全性及其他因素来描述[10,14]。
QoS 既不是用于描述对某项业务的满意程度, 也不是用于做定量的技术性评价。
QoS 通过在协议栈的各个协议层上定义的一组公共参数, 来保证业务实现一定的QoE[12]。
用于实现QoS 保证的参数有: 优先级、延迟、延迟抖动、包丢失率、吞吐量、承载可靠性、帧误码率、业务响应时间、包重排序、会话阻塞率、会话可用性、会话持续性和会话接入时间等。
NTC的正确使用及介绍
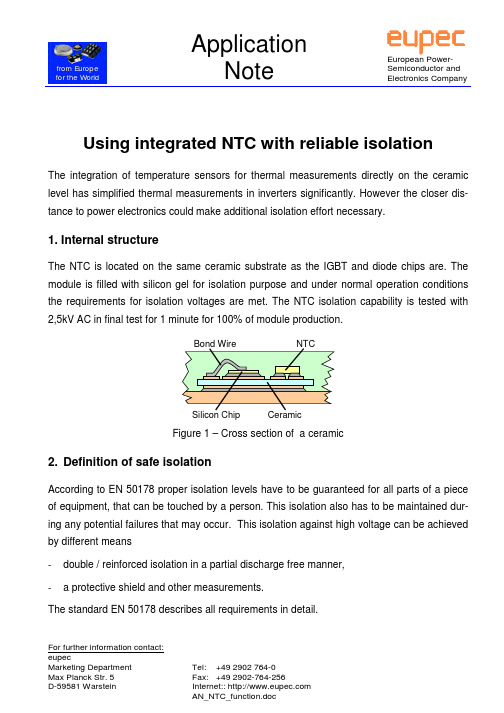
from E urope for the WorldApplicationNoteSemiconductor and Electronics CompanyFor further information contact:eupecUsing integrated NTC with reliable isolationThe integration of temperature sensors for thermal measurements directly on the ceramic level has simplified thermal measurements in inverters significantly. However the closer dis-tance to power electronics could make additional isolation effort necessary.1. Internal structureThe NTC is located on the same ceramic substrate as the IGBT and diode chips are. The module is filled with silicon gel for isolation purpose and under normal operation conditions the requirements for isolation voltages are met. The NTC isolation capability is tested with2,5kV AC in final test for 1 minute for 100% of module production.Figure 1 – Cross section of a ceramic2. Definition of safe isolationAccording to EN 50178 proper isolation levels have to be guaranteed for all parts of a piece of equipment, that can be touched by a person. This isolation also has to be maintained dur-ing any potential failures that may occur. This isolation against high voltage can be achieved by different means- double / reinforced isolation in a partial discharge free manner,- a protective shield and other measurements.The standard EN 50178 describes all requirements in detail.3. ConclusionsSince the NTC inside the module, could be exposed to a high voltage level (during a short circuit, for example) in accordance, with EN 50178 this isolation has to be done externally. Figure 2 shows the worst case situation during failure mode in a power module with inte-grated temperature sensor. After an electrical overstress the bond wires could melt off and the resulting arc produces high energy plasma. The direction of expansion of plasma is un-predictable for all bonded connections. The NTC might be touched by plasma, which could mean, that the NTC might be exposed to high voltage level.Figure 2 – Worst failure case4. Measures for reliable isolationThere are various different ways to realize proper isolation, e.g.:-The complete equipment is covered with an appropriate isolation material.-The control logic could be shifted to high voltage level. Then an extra isolation for the NTC is not necessary. The isolation is done once for the entire logic circuit.-The NTC is integrated in a comparator circuit, which is isolated from the control logic by an opto coupler.-The NTC signal is converted to a digital format and the isolation to the logic level is ac-complished through an opto coupler or signal transformer.In some instances the isolation capability of NTC sensor itself might be sufficient. However, since each application is unique and internal design criteria vary from customer to customer, each usage needs to be evaluated separately, to determine if all applicable safety require-ments are met.For further information contact:eupecFor further information contact:eupec5. Temperature measurement with NTCThe NTC can be used for static overheat protection. A protection of short term overtempera-ture on junction level is not possible since the position of thermistors has to be on every chip for that purpose. An estimation of NTC temperature can be made with following background:- The NTC has nearly case temperature level.- As an estimated correction factor for higher temperature level, a value of approximately 10K can be added to heatsink-temperature level depending on cooling efficiency and utili-zation of module.The value of the thermistor T T can be calculated from the nearest chip to NTC and maximum power dissipation with following equation:thJCJ T R P K T T *10max −+=The current that detects the resistance value is heating up the thermistor itself. As an exam-ple, for T T =100°C the resistance value of the thermistor is given with nominal R T =500 Ω in the datasheet. The thermal conductivity of the NTC is R thT =145 K/W. With that value, a pull-up resistor can be defined:TTTthT up pull R T R R U R −∆∗∗=−0If temperature rising of the thermistor itself is limited with ∆T T =1 K the allowable maximum power losses for the thermistor of 7 mW are acceptable. If feeding voltage U 0 is 5V than a pull-up resistor is calculated with 837 Ω. A resistor of 820 Ω can be chosen. Calculated with that value, a voltage of less than 1,9 V should be used as threshold for the comparator for turn-off the device. The overheat protection function can be designed by using an analog-logic circuit.If the thermistor current is too small, detected voltage has also a small value, then the accu-racy of the detection will be lower. On the other hand, if the current is too high, temperature rising of the thermistor itself will be higher, then accuracy of the detected temperature is lower. Therefore, 3 to 4 mA of current are recommended as an optimum.For further information contact:eupecThe time constant for the thermistor is about 2 seconds. Since thermal chip time constant is much smaller and time constant of the entire cooling system is much higher, the NTC is de-signed for detection of intermediate and long term overload conditions.102030405060708090100110120130140150Figure 1: NTC valuesA temperature / resistance value table in linear graph is given in figure 1. In addition to that the curve can be described with the analytic function:)]11(*exp[*1212T T B R R −=with B= 3375K, R 1= 5k Ω, T 1=298K, T 2 temperature in Kelvin.。
初二英语缩略词与缩写扩展超级高级练习题30题(带答案)

初二英语缩略词与缩写扩展超级高级练习题30题(带答案)1. The international organization "WHO" stands for _.A. World Health OrganizationB. World High OrganizationC. World Huge OrganizationD. World Happy Organization答案:A。
解析:“WHO”是“世界卫生组织”的缩写,其全称为“World Health Organization”。
2. In the field of technology, "CPU" means _.A. Central Processing UnitB. Central Product UnitC. Central Part UnitD. Central Plan Unit答案:A。
解析:在科技领域,“CPU”的意思是“中央处理器”,英文是“Central Processing Unit”。
3. The abbreviation "DIY" is short for _.A. Do It YourselfB. Do It YourselvesC. Done It YourselfD. Done It Yourselves答案:A。
解析:“DIY”是“自己动手做”的缩写,即“Do It Yourself”。
4. When we talk about business, "CEO" refers to _.A. Chief Executive OfficerB. Chief Every OfficerC. Chief Energy OfficerD. Chief Easy Officer答案:A。
解析:在商务方面,“CEO”代表“首席执行官”,英文为“Chief Executive Officer”。
Festo SFAB流量传感器说明书
Flow sensors SFAB2d Internet: /catalogue/...Subject to change – 2023/08Flow sensors SFABKey featuresAt a glance4[1] Quick and secure installationthanks to QS fitting[2] Display can be rotated 270°[3] – High-contrast LCD display withblue background and white 9-segment display– Bar chart depicts current measured value– Switching point-dependent colour change [4] Central electrical connection viaan M12 plug[5] Panel mounting of the sensorusing retaining screws 5 measuring ranges from0.1 … 10 l/min to 10 … 100 l/min [6] Manifold mounting of the sensorwith H-rail or individually with adapter plate for wall mountingImpressive, straightforward, reliable Easy to operateThe flow sensors, featuring an attrac -tive display and control concept, are very impressive when it comes to:• Leakage detection in production • Leak testing of end products • Flow monitoring in parts feedingThe sensor provides:• Absolute flow rate information – with threshold values and – convenient switching point adjustment via a display • Cumulative air consumption measurement• Patented – adjustable consump-tion-based switching pulse for cu-mulative air consumption measure-ment via the switching output • A large, illuminated LCD display increases the operational safety and makes the currently displayed flow rate or consumption values easy to read.• Measured values outside the measuring range are visualised: flow rates are shown flashing.• Values that fall below or exceed the threshold values can also be identified from a distance or if the sensor is in an inaccessible location by the display changing colour.• Simple checking of the current sensor settings in SHOW mode • Simple switching between consumption and flow rate indicationFlexible installationSystematically more reliable Convenient This is made possible by the extremely compact design that dispenses with an upstream laminar flow inlet and outlet – the SFAB has an integrated flow steadying channel.The sensor can provide precise infor-mation even when flow conditions are fluctuating and unreliable thanks to the very large measuring range.• Clear and fast menu navigation • Integrated QS fittings • Fast teach-in • Rotatable display• Secure connections with extremely short assembly times•Manual consumption measurement with start/stop and reset functionalityAdvantages For the designerFor the machine operator• Owing to the high dynamic response of the measurement and large measuring range, a rough estimate of the system air consumption is sufficient to configure the sensor• Festo plug and work solution• The same device can be used for different applications• The sensor covers a large measuring range with a specified accuracy thanks to its high dynamic response of 1:100• NPN/PNP can be switched via the software • Minimal assembly times• Alternatively with 4 ... 20 mA or 0 ... 10 V analogue output• Flexible installation without restrictions caused by laminar flow inlets, any mounting position• Large choice of pneumatic connections is provided by the modular system • Construction of more powerful machines• Precise information is available even with fluctuating pressure conditions • Flow values can be read easily and reliably• Visualisation of deviations (colour change, flashing value)• Easy operation, no need for training • Greater system reliability •Values shown on the display:– can be shown for flow and consumption for different standard conditions – can be filtered/averaged independently of the analogue output in the case of high dynamic response of the measurement• Fast commissioning thanks to easy-to-use, intuitive teach-in functionFlow sensors SFAB Peripherals overview3 2023/08 – Subject to change d Internet: /catalogue/...Flow sensors SFABType codes4d Internet: /catalogue/...Subject to change – 2023/0852023/08 – Subject to changed Internet: /catalogue/...Flow sensors SFABData sheetFunction• Analogue output 0 ... 10 V , adjustable switching outputs 2x PNP or 2x NPN• Analogue output 4 ... 20 mA, adjustable switching outputs 2x PNP or 2x NPN• Freely selectable pulse output for consumption measurement• Analogue filter for setting the rise time• Digital filter for smoothing thedisplay valuesFlow sensors SFABData sheet1) Accuracy with nominal conditions (6 bar, 23°C and horizontal mounting position)2) % FS = % of the final value in the measuring range (full scale)6d Internet: /catalogue/...Subject to change – 2023/08Flow sensors SFAB Data sheet7 2023/08 – Subject to change d Internet: /catalogue/...Flow sensors SFABData sheet8d Internet: /catalogue/...Subject to change – 2023/08Flow sensors SFAB Data sheet9 2023/08 – Subject to change d Internet: /catalogue/...Flow sensors SFABOrdering data – Modular product system[1] Q6, T14 Not with flow measuring range 200, 600, 1000[2] Q8, T516 Not with flow measuring range 600, 100010d Internet: /catalogue/...Subject to change – 2023/08Flow sensors SFAB AccessoriesAdapter plate SDE1- ...-W ...For wall or surface mounting Material:Steel1) Included in the scope of delivery with SFAB-...-W...1) Additional accessories may be required for adaptation to the pneumatic connection.11 2023/08 – Subject to change d Internet: /catalogue/...Festo - Your Partner in AutomationConnect with us/socialmedia 1Festo Inc.2Festo Pneumatic 3Festo Corporation 4Regional Service Center 5300 Explorer DriveMississauga, ON L4W 5G4CanadaAv. Ceylán 3,Col. Tequesquináhuac 54020 Tlalnepantla, Estado de México1377 Motor Parkway Suite 310Islandia, NY 117497777 Columbia Road Mason, OH 45040Festo Customer Interaction CenterTel:187****3786Fax:187****3786Email:*****************************Multinational Contact Center 01 800 337 8669***********************Festo Customer Interaction Center180****3786180****3786*****************************S u b j e c t t o c h a n g e。
基于LoRa通信的广播电视发射台站温度监测系统设计
基于LoRa通信的广播电视发射台站温度监测系统设计【摘 要】 本文为在广播电视发射台站实现硬馈等温度监测,开发了一种基于Linux嵌入式的物联网测温系统。
温度监测系统分为测温服务器、测温网关、测温节点三部分。
低功耗的测温节点采用电池供电,测温网关采用POE供电,经实地测试运行表明该系统满足设计要求,实现了一种远距离,广覆盖的广电物联网应用[1]。
【关键词】 Linux嵌入式系统,物联网,低功耗,POE 【中图分类号】 TN934.81 【文献标识码】 B【DOI编码】 10.16171/ki.rtbe.20210002019【本文献信息】吴廷昊,陆海源,赵小寒,宋经雄,唐丽.基于LoRa通信的广播电视发射台站温度监测系统设计[J].广播与电视技术,2021,Vol.48(2).Design of Temperature Measurement System for Radio and TV TransmittingStation Based on Lora CommunicationWu Tinghao, Lu Haiyuan, Zhao Xiaohan, Song Jingxiong, Tang Li (Guangxi Radio and Television Technology Center, Guangxi 530022, China)Abstract This paper develops a temperature measurement system of Internet of Things based on Linux embedded to realize temperature monitoring such as hard feed in radio and television transmitting stations. Temperature measurement system is divided into three parts, which are temperature measurement server, temperature measurement gateway and temperature measurement node. Low-power temperature measurement node is powered by battery, and gateway is powered by POE. Test shows that the system meets design requirements and realizes a long-distance, wide-coverage radio and television Internet of Things application.Keywords Linux embedded system, Internet of Things, Low power consumption, POE吴廷昊,陆海源,赵小寒,宋经雄,唐丽(广西广播电视技术中心,广西 530022)0 引言物联网技术的发展为确保广播电视安全播出提供了新的思路。
IEEE-TSMCS-Special-Issue-Energy-Internet
IEEE Transactions on Systems, Man, and Cybernetics:Systems Special Issue on“New Trends in Energy Internet: Artificial Intelligence-Based Control, Network Security and Management”Call for PapersEnergy Internet, as a new and advanced paradigm of smart grids, has been put forward by the strong integration of energy and information network infrastructure involving traditional centralized generations, distributed energy resources, automated control systems, advanced communication technologies, smart metering, intelligent computing, smart management systems, and so on. This emerging Energy Internet provides a new and long-term vision that enables the fundamental reconstruction of grids to harness leading-edge technology revolutions and undertake new thinking about energy network architectures based on the lessons learned from the Internet, which is changing and will shape the society from various aspects such as energy exploration, transportation and utilization. While Energy Internet brings a promising solution with high efficiency, strong flexibility, great scalability and improved reliability to accommodate the new shift from traditional power networks, it inevitably poses some technical and theoretical challenges in architecture design, control operation and energy management. These challenges primarily include upgrade and configuration of power and communication infrastructure, design and implementation of advanced artificial intelligence based control and optimization algorithms, security protection of shared information against various attacks from communication networks and data-driven management of energy markets. In order to address these challenges, it is essential for Energy Internet to develop new methods by taking into account underlying and advanced techniques such as multi-agent systems, artificial intelligence-based control, big data cloud computing and management, and so on.This special issue on “New trends in Energy Internet: Artificial Intelligence-Based Control, Network Security and Management” is focused on seeking state-of-art advances and original contributions in design and implementation of advanced control and optimization algorithms, network security defense mechanisms and energy management for Energy Internet.Topics of interest: Specific topics for this special issue include but are not limited to:∙New architecture design of Energy Internet∙Cyber-energy integration modelling for Energy Internet∙Artificial intelligence-based control schemes in Energy Internet∙Security control of smart grids subject to cyber attacks∙Multi-agent systems-based coordination control of smart grids∙Distributed control and optimization in islanded microgrids∙Event-triggered network communication mechanisms of smart grids ∙The effects of Communication constraints on stability of smart grids/microgrids∙Data-driven energy management in smart grids: power dispatch and demand response∙Cyber-attack detection and identification in Energy Internet∙Artificial intelligence-based security threat identification, assessment and measurement of Energy Internet∙Artificial intelligence-based fault diagnosis of Energy Internet∙Artificial intelligence-based safety prediction of Energy Internet∙Intelligent frameworks for privacy protection∙Experimental prototypes, test-laboratories and field trial experiences of artificial intelligence techniques in Energy Internet securityImportant Dates:Manuscript Due: October 15, 2018First Decision Date: December 15, 2018Revision Due: February 15, 2019Final Decision: April 15, 2019Publication: May/June 2019 (planned)Guest Editors:Professor Dong YueDean, School of AutomationDirector, Institute of Advanced TechnologyNanjing University of Posts and TelecommunicationsNanjing, 210023 P. R. ChinaE-mail: medongy@Distinguished Professor Qing-Long HanPro Vice-Chancellor (Research Quality)Swinburne University of TechnologyMelbourne, Victoria 3122, AustraliaEmail: qhan@.au。
精密网络同步协议(PTP)-v2[1].0协议解析
IEEE1588精密网络同步协议(PTP)-v2.0协议解析1 引言以太网技术由于其开放性好、价格低廉和使用方便等特点,已经广泛应用于电信级别的网络中,以太网的数据传输速度也从早期的10M提高到100M,GE,10GE。
40GE,100GE正式产品也于2009年推出。
以太网技术是“即插即用”的,也就是将以太网终端接到IP网络上就可以随时使用其提供的业务。
但是,只有“同步的”的IP网络才是一个真正的电信级网络,才能够为IP网络传送各种实时业务与数据业务的多重播放业务提供保障。
目前,电信级网络对时间同步要求十分严格,对于一个全国范围的IP网络来说,骨干网络时延一般要求控制在50ms之内,现行的互联网网络时间协议NTP (Network Time Protocol),简单网络时间协议SNTP(Simple Network Time Protocol)等不能达到所要求的同步精度或收敛速度。
基于以太网的时分复用通道仿真技术(TDM over Ethernet)作为一种过渡技术,具有一定的以太网时钟同步概念,可以部分解决现有终端设备用于以太网的无缝连接问题。
IEEE 1588标准则特别适合于以太网,可以在一个地域分散的IP网络中实现微秒级高精度的时钟同步。
本文重点介绍IEEE 1588技术及其测试实现。
2 IEEE 1588PTP介绍IEEE 1588PTP协议借鉴了NTP技术,具有容易配置、快速收敛以及对网络带宽和资源消耗少等特点。
IEEE1588标准的全称是“网络测量和控制系统的精密时钟同步协议标准(IEEE 1588 Precision Clock Synchronization Protocol)”,简称PTP(Precision Timing Protocol),它的主要原理是通过一个同步信号周期性的对网络中所有节点的时钟进行校正同步,可以使基于以太网的分布式系统达到精确同步,IEEE 1588PTP时钟同步技术也可以应用于任何组播网络中。
- 1、下载文档前请自行甄别文档内容的完整性,平台不提供额外的编辑、内容补充、找答案等附加服务。
- 2、"仅部分预览"的文档,不可在线预览部分如存在完整性等问题,可反馈申请退款(可完整预览的文档不适用该条件!)。
- 3、如文档侵犯您的权益,请联系客服反馈,我们会尽快为您处理(人工客服工作时间:9:00-18:30)。
Advancement of indices assessing a nation'stelecommunications development status:A PLS structuralequation analysis of over100countriesTorsten J.Gerpott n,1,Nima Ahmadi1Mercator School of Management,University of Duisburg-Essen,Lotharstr.65,47057Duisburg,Germanya r t i c l e i n f oAvailable online3February2015Keywords:AdoptionComposite indicesCountry rankingITU data basePartial Least Squares structural equationmodelingSupplyUsagea b s t r a c tThe literature has already presented quite a number of composite metrics seeking toquantify the achievement level of countries with regard to their telecommunicationinfrastructures and their use by end customers.However,prior measures leave room forextensions.Therefore,this paper introduces a new second-order overall index assessingthe availability,adoption and usage intensity of telecommunication networks and servicesat the country level.The proposed Telecommunications Development Index(TDI)integrates11indicators,which are grouped into three first-level subindices labeledSupply,Adoption and Usage.Indicator and subindex weights used in combining theminto higher-order measures are computed drawing on Partial Least Squares(PLS)structural equation modeling(SEM)techniques.The modeling rests on the assumptionthat TDI weights should be outcome-specific and thus constructed in a way thatmaximizes the indicators'and subindices'capability,respectively to predict sociallydesirable national performance criteria such as per capita gross domestic product(GDP)change or a country's Human Development Index(HDI)value.Based on data from111countries,this approach was used to calculate weights of the indicators and subindicesmerged into a total TDI predicting either GDP per capita change or a country's HDI.In bothTDI variants the Adoption subindex variable fixed broadband subscriptions per householdand the Supply subindex variable international bandwidth capacity available per Internetuser achieved the highest relative weights of all indicators in the prediction of the twostudied social outcome criteria.The PLS SEM results were used to calculate scores of thetwo TDI variations for each of the sample countries.TDI-based rankings of the countrieswere compared with a ranking derived from the Information and CommunicationTechnologies Development Index of the International Telecommunication Union.&2014Elsevier Ltd.All rights reserved.1.IntroductionIt is widely acknowledged that the availability and use of telecommunication networks and services are strongly linked to positively valued socio-economic achievements of countries.Consequently,several studies have been carried out which strive to capture the degree of sophistication of the telecommunications infrastructure and demand status at the countryContents lists available at ScienceDirectURL:/locate/telpolTelecommunications Policy/10.1016/j.telpol.2014.11.0070308-5961/&2014Elsevier Ltd.All rightsreserved.n Corresponding author.E-mail addresses:torsten.gerpott@uni-due.de(T.J.Gerpott),nima.ahmadi@uni-due.de(N.Ahmadi).1Tel.:þ492033793109;fax:þ492033792656.Telecommunications Policy39(2015)93–111level for a large number of nations in a single composite index.In the remainder of this study the term “telecommunication development index ”(TDI)is used to refer to such measures of a latent construct which encompasses several features.Among others,Barzilai-Nahon (2006,pp.274–275),Bruno,Esposito,Genovese,and Gwebu (2011,pp.18–21)and Hanafizadeh,Hanafizadeh,and Khodabakhshi (2009,p.245)provide overviews of relevant index propositions.A common key characteristic of the various TDI is that they mathematically aggregate a set of distinct indicators either in a single step or in at least two steps through the calculation of subindices.Furthermore,at the lowest level of analysis the individual indicators typically do not have a uniform measurement unit and an obvious way of weighting the indicators or higher-order subindices in the computation of the total index is missing (Saisana &Tarantola,2002,p.5;Vicente Cuervo &López Menéndez,2006,p.758).Politicians and executives of telecommunication firms use TDI to justify the inevitability or needlessness of a variety of public interventions as,for instance,state subsidies for the roll-out of fiber access networks in rural areas,financial aids for low income households to hook them up to the Internet or the imposition of ceilings for telephone line installation fees paid by residential customers (Al-mutawkkil,Heshmati,&Hwang,2009,pp.176–177).Scholars focusing on the telecommunications sector are more interested in the conceptual underpinnings and in methodological aspects (dimensionality,weighting algorithm etc.)of composite measures assessing the telecommunica-tions development (TD)level of countries.Regardless of who relies on TDI and of what is intended to be achieved through TDI analysis,capturing the status of the availability and use of telecommunication infrastructures and services at the country level in a single composite index is a highly complex endeavor.This holds even more if the index designer strives to base the measure on raw data which are accessible not just for a few (developed)nations but for a large number of countries.In particular,the selection of variables (“indicators ”)to be entered in a TDI and the weighting of indicators or of subindices introduced at intermediate levels between the basic variables and the overall index raise a number of intriguing questions.Although these questions have been addressed in quite a number of publications there is still room for improved responses to them.The present work intends to contribute to such improved answers.It extends the literature mainly in three ways.First,we develop a proposal of a focused set of 11indicators and their summary in three first-level subindices which in turn are merged in a (second-order)overall TDI.In spite of the set's parsimony in terms of the number of considered variables,it covers the supply of telecommunication infrastructures and services in a country,their adoption by end customers as well as the intensity of usage of access lines.These three facets are less well amalgamated in earlier measures assessing a country's TD status.Second,this study considers that first-order TD subindicies constructed in earlier research (e.g.,Al-mutawkkil et al.,2009;Hanafizadeh,Saghaei,&Hanafizadeh,2009;ITU,2013;Waverman,Dasgupta,&Rajala,2011)are linked in means-end-chains.For instance,a subindex measuring the take-up rate of network access options has impacts on the values of another subindex capturing a country's use situation.Hence,in deriving appropriate weights of TDI indicators or subindices such functional relationships need to be taken into account.Third,this investigation makes the point that weights of indicators or subindices entered into an overall TDI should vary depending on the socio-economic target criterion,which is to be predicted by the index.The most prominent instance for such a criterion is a country's growth in its gross domestic product per capita.The criterion-related weighting is achieved by applying a variance-based structural equation modeling (SEM)technique –Partial Least Squares (PLS)–to empirically estimate TDI scores of 111countries for two societal outcome criteria.The remainder of this article is organized as follows:The next section reviews the literature on assessing a country's TD level in a composite index in order to explain potential areas of improvement with respect to the content areas covered in a TDI,the consideration of relations between its first-level subindices and the derivation of weights at the detailed indicator and at the subindex level.Section 3describes the structure of the subindices merged in the TDI proposed here.Furthermore,it details the data sources and indicators used in the empirical construction of three subindices for two TDI each of which aims at predicting a specific desirable societal outcome criterion.Section 4reports the results of the empirical estimation of indicator and subindex weights in the overall TDI based on a PLS SEM modeling approach.Final conclusions and suggestions for future research are presented in Section 5.2.Literature review2.1.Indicator selection issuesFrom a high level perspective,two conceptual avenues to selecting indicators for measuring the state of a country's telecommunications infrastructure availability and use are distinguishable.First,one strand of research views the TD status as part of a broader subject area dealing with the adoption and usage of information and communication technologies (ICT)in consumer households,corporations and the public sector.This type of work seeks to capture a country's “ICT-ization or Infostate ”(Orbicom,2003,p.IX ),level of “ICT development ”(ITU,2013,p.17),“digitization ”(Katz &Koutroumpis,2013,p.314),“digitalization level ”(Billon,Lera-Lopez,&Mario,2010,p.46),“level of ICT adoption ”(Billon,Marco,&Lera-Lopez,2009,p.596),“information society level ”(Çilan,Bolat,&Co şkun,2009,p.98)or “readiness …to use ICTs ”(Bilbao-Osorio,Crotti,Dutta,&Lanvin,2014,p.6)by choosing indicators that are not limited to the roll-out of telecommunications infrastructures and the uptake of access or service offers by end customers.Rather,this research stream also incorporates variables,which aim at capturing human skills or preconditions for the effective use of ICT in private and business contexts (e.g.,enrollment in a specific level of education as a percentage of the official school-age population or labor force;see ITU,T.J.Gerpott,N.Ahmadi /Telecommunications Policy 39(2015)93–11194T.J.Gerpott,N.Ahmadi/Telecommunications Policy39(2015)93–11195 2013,p.211;Katz&Koutroumpis,2013,p.316;World Wide Web Foundation,2013,p.9).Furthermore,it places heavy emphasis on the proliferation of computer hardware(e.g.,secure Internet servers),individual access to the Internet and inequalities in ICT/Internet use rates between countries or various population groups which are typically summarized with the term“digital divide”(Billon et al.,2010,p.41).Probably the most prominent example for this approach is the“ICT Development Index(IDI)”developed by the International Telecommunication Union(ITU)in2008(see ITU,2013,pp.17–22,209–215).The IDI is the weighted average of three subindices labeled“ICT access”composed of five equally weighted variables,“ICT use”formed by three equally weighted variables and“ICT skills”built by three equally weighted indicators.In calculating the overall IDI the weights of the first two subindices amount to0.4each and the weight of the skills subindex is0.2.Critics of the IDI argue that the measure mixes independent inputs,such as the proportion of households with a computer,with dependent outputs as for instance,the proportion of the population using the Internet which results in misleading double-counting or-weighting, respectively of indicators.Additionally,they highlight that the IDI provides no convincing justification for assigning some subscription variables to the ICT access subindex(e.g.,mobile cellular telephone subscriptions per100inhabitants)and others as the number of wireless broadband subscriptions per100people to the ICT use subindex(James,2012).A second study group deliberately focuses its assessment efforts on the availability,uptake and use of telecommunication networks and services.For instance,Al-mutawkkil et al.(2009)proposed a composite“Telecommunication Index”which is computed as the unweighted average of a fixed telephone network subindex(based on five indicators such as main telephone lines per1000population),an Internet subindex(containing four variables like Internet subscribers per1000 inhabitants)and a mobile network subindex(combining three indicators as,e.g.,cellular mobile telephone subscribers per 1000population).A key disadvantage of the first research stream is that the inclusion of a broad variety of indicators and subindices, respectively and particularly of computer hardware as well as human(ICT)skill level variables taken as proxies for preconditions of the effective IT use blurs the meaning of a composite index(Al-mutawkkil et al.,2009,p.178;Ferreira, 2008,p.15;James,2012,p.592).This in turn makes it very hard to derive conclusions regarding economic or technology policy actions,which may be needed to improve the position of a nation's telecommunications situation relative to other countries.Therefore,the present investigation follows the second research stream by designing a composite measure,which concentrates on telecommunication networks and services use.Such an attempt is worthwhile because earlier TDI suggested in the literature often had somewhat deviating thrusts and leave room for improvement in at least three areas.First,they mostly miss important facets or rely on questionable indicators of a country's TD status.Although it is undisputed that the physical roll-out of telecommunication infrastructure and the supply of transmission capacity are necessary prerequisites for the end customer uptake of network access offerings and service usage,very few TDI contain variables assessing the deployment of networks and their data transport capabilities.Positive exceptions are Bilbao-Osorio et al.(2014),Katz and Koutroumpis(2013),and Hanafizadeh, Hanafizadeh et al.(2009)who included the percentage of a country's population covered by mobile cellular networks in a synthetic ICT status index and Waverman et al.(2011)who added the percentage of a country's inhabitants covered by third generation(3G)mobile networks to an index of“useful connectivity”.Acknowledging the pivotal role of physical deployment and transmission capacity for subsequent access take-up and service usage,the present investigation selected additional indicators of the supply side availability of networks and transport capacity regardless of whether the deployed production facilities result in end customer access and service demand.In addition,many past TD measures treat network use as a binarily scaled phenomenon,which is either present or not. For instance,the use subindex in the IDI of the ITU contains three variables which measure use by looking at subscription rates of fixed and wireless broadband access lines(ITU,2013,p.21).However,there is ample evidence suggesting that the average usage intensity of telecommunication services varies strongly between countries and their residents(Gerpott,2010, p.62;ITU,2011a,pp.29–246).Hence,past use operationalizations overwhelmingly neglect that use is better measured in the sense of usage intensity based on steadily-scaled indicators(in particular frequency,minutes or volume of usage;cf. Barzilai-Nahon,2006,p.274).Among the few positive outliers are Orbicom(2003,p.127)and Waverman et al.(2011,pp.48, 53)who incorporated national fixed or mobile voice minutes per capita or Katz and Koutroumpis(2013,p.316)who included SMS sent per capita in their composite TD measures.Therefore,this study extends most relevant earlier work by including several variables capturing the intensity of usage of a general telecommunication service category per access line or person.Second,numerous extant TD measures enter price data for certain telecommunication services or revenues generated from them as proxies for“affordability”into a composite index(e.g.,Al-mutawkkil et al.,2009;Bilbao-Osorio et al.,2014; Hanafizadeh,Saghaei et al.,2009;Trkman,Blazic,&Turk,2008;Vicente Cuervo&López Menéndez,2006).This procedure is not convincing because prices are drivers of access take-up rates and intensity of service usage and revenues are mathematically dependent on prices and subscription numbers(Ferreira,2008,pp.8–10).Thus,merging price and subscription indicators into a single composite index leads to double-counting/-weighting of certain features of a country's TD situation.Furthermore,cross-national comparisons of price levels for baskets of telecommunication services raise difficult and controversial methodological issues(e.g.,basket composition,operator selection).They complicate the interpretation of a TDI and may hamper its acceptance by decision makers both in the public and the private sector (Waverman et al.,2011,pp.41–42).These considerations are confirmed by the fact that in2009the ITU dropped tariff variables from its current ICT status index.Instead,it discusses price data and affordability of fixed and mobile networkservices independent of its overall IDI (ITU,2009,pp.11–12,2013,pp.77–126).Hence,the present work avoids a problem of earlier composite TD assessments by not relying on price and revenue related variables.Third,TDI are typically construed in a way which fails to account for means-ends-relationships between non-financial indicators or subindices merged in an overall aggregated measure.This defect results in accidental over-or underweightings of indicators or subindices merged in an overall index because one variable strongly affects the lower boundary of the values of another variable (Hanafizadeh,Saghaei et al.,2009,p.387;James,2012,pp.588–589).For instance,the United Nations'Department of Economic and Social Affairs introduced a “telecommunication infrastructure index ”which selects (among others)“fixed internet subscriptions per 100inhabitants ”and “internet users per 100inhabitants ”as indicators (United Nations,2012,p.124).Regrettably,the value of the second variable is conditional on the number of Internet subscriptions.Thus,adding these two indicators with other variables,which are at best weakly associated with Internet access adoption and use (e.g.,mobile network subscription rate),leads to an overweighting of Internet-related access and use facets in the infrastructure index developed by the United Nations.Conversely,in case that one subscale of a composite TDI has strong positive effects on another subindex the neglect of this functional chain in deriving weights for the various subindices of an overall measure results in an underweighting of the subscales located at the initial parts of the causal chain.For instance,regarding the IDI of the ITU Barzilai-Nahon (2006,pp.273–275)indicates that its access subindex influences its use subscale.However,neither the ITU nor a recent analysis of Kyriakidou,Michalakelis,and Sphicopoulos (2013),who use covariance-based SEM techniques to design a modified version of the IDI,account for this linkage in suggesting weights of the access and use subindices merged in the overall IDI.In a similar vein,the Communications Committee of the EU member states argues the advanced mobile network (LTE)coverage influences the actual take-up rate of mobile broadband offers in a country (Communications Committee,2014,p.35).Hence,the present work seeks to overcome the third area of concern of some extant research by (a)applying statistical procedures which reduce double-counting distortions in the aggregation of indicators in a subindex and (b)formulating a structural model of subindices entered into an overall TDI which accounts for means-end-connections between subindices.22.2.Indicator and subindex weighting issuesThe construction of any TDI requires the weighting of the underlying indicators and of subindices in case that the com-posite overall measure is built hierarchically as a higher-order construct with at least one intermediate (subindex/-scale)aggregation level.Overviews of procedures to handling this weighting problem are provided by Saisana and Tarantola (2002,pp.11–51),Nardo et al.(2005,pp.61–75)and Al-mutawkkil et al.(2009,p.180).Some index designers such as Bilbao-Osorio et al.(2014,p.34)or Lam and Shiu (2010,p.188)aggregate indicators or subscales by taking their arithmetic mean without explicitly explaining that this procedure assumes that each variable or subindex has the same importance.But most authors expressly reflect on or at least report the weights which they assign to the indicators or subindices in computing a composite TDI.Overall,the approaches to weighting index components can be grouped into expert opinions and statistical techniques.According to Badasyan,Shideler,and Silva (2011,p.934)most of the measures of a country's IT development or TD status “are heavily based on subjective judgements ”.For instance,Orbicom (2003,p.131)assigns equal weights to the two subindices entered into its overall “Infostate ”index and justifies this with the remark that the authors “have no knowledge basis to do otherwise ”.Conversely,in construing the IDI the ITU (2013,p.21)applies differentiated weightings of 0.4for its access and use subindices,respectively and of 0.2for its skills subindex,but at the same time allocates the same weight to all indicators entered into each subindex.This is worrying because due to differences in the number of indicators in the access and use subindices (five versus three)the procedure implies that weights for individual indicators in the access subindex deviate from the base indicator weights in the use subindex notwithstanding that the ITU provides no reason to justify this unbalanced weighting.3Regardless of whether equal or unequal weights are assigned at the indicator or subindex level,quite many authors do not even make the effort to develop substantial arguments to support their position regarding the “adequate ”weighting scheme in construing an ICT or TD index (e.g.,Çilan et al.,2009,p.100;United Nations,2012,p.124).The unease with the almost unlimited “discretion of the researcher which weights to assign ”(Hilbert,2011,p.720)in general and in particular the argument that “it is unlikely that all variables in an index truly are equally important ”(Wallsten,2009,p.17)has motivated a considerable number of investigations which resort to multivariate statistical techniques in order to handle the problem of how to weight indicators and subindices,respectively.Probably the most frequently applied quantitative method to derive such weights is exploratory factor analysis (e.g.,Al-mutawkkil et al.,2009;Billon et al.,2009,2010;Bruno et al.,2011;Corrocher &Ordanini,2002;Hanafizadeh,Saghaei et al.,2009;Pradhan,Arvin,Norman,&Bele,2014;Trkman et al.,2008;Vicente Cuervo &López Menéndez,2006).This technique transforms a given set of indicators or subindices into a smaller number of synthetic components,factors or dimensions,respectively through2Our means-end argument should not be taken to imply that the relationship between one subindex and another is purely unidirectional.For instance,access adoption of consumers is not only driven by infrastructure supply but also likely to have an impact on future network roll-out.Instead,our approach assumes that the means-end-link of one subindex to another is relatively stronger than the effect in the opposite direction.3The ITU (2013,p.21)claims that the weighting of the IDI indicators and subindices were chosen based on factor analysis results.This is surprising since the relevant statistics reported in an earlier ITU publication (ITU,2009,pp.77–82)are not in line with this proposition.For instance,according to the factor analysis the weight of the indicator “mobile-cellular telephone subscriptions per 100inhabitants ”in the access subindex weight ought to be almost three times as high as the weight of the fixed telephone subscription rate variable.However,the IDI assigns equal weights to both indicators.T.J.Gerpott,N.Ahmadi /Telecommunications Policy 39(2015)93–11196T.J.Gerpott,N.Ahmadi/Telecommunications Policy39(2015)93–11197 linear combinations of the original variables.There are different ways to get weights from the loadings of the variables on the latent dimensions.The most widespread approach is to estimate factor scores for each case(¼country)in a data set.In the course of this estimation a matrix is derived which contains so-called factor score coefficients which are multiplied with the original(standardized)indicator values in order to compute a country's score for each latent component retained in the analysis(see,for example,Vicente Cuervo&López Menéndez,2006).These coefficients equate to the weights assigned to the indicators or subindices in aggregating them to an overall index value.Unfortunately,a considerable share of the relevant publications does not disclose this coefficient matrix(e.g.,Billon et al.,2010;Bruno et al.,2011;Katz&Koutroumpis, 2013;Pradhan et al.,2014).In this case,research recipients are left in the dark with regard to indicator weightings in the composite measure.The method described has two significant disadvantages.First,it results in indexes which are difficult to interpret because each indicator is entered into each index.Second,it does not allow for a hierarchical ordering of indices since it provides little support in obtaining weights for subindices combined in the overall measure.An approach which is based on the results of exploratory factor analysis but does not share these two shortcomings was developed by Nicoletti,Scarpetta,and Boylaud(2000).The authors suggest to assign each indicator to the factor on which it has its highest loading.Indicator weights are then computed by dividing the squared factor loading of a variable by the sum of the squared loadings of all indicators.Thus,indicator weights correspond to the share of variance of an indicator in the overall variance of a composite index.Subindex weights are calculated by dividing the total variance of all factors kept in an analysis (¼sum of their eigenvalues)into the variance of each factor or subindex,respectively(cf.Nicoletti et al.,2000,p.22).With exploratory factor analysis all indicators are typically related to every composite index by a factor loading. Therefore,it is exploratory in the sense that the factor calculation is purely data driven and does not set any a priori constraints on the number of meaningful latent dimensions to be extracted and on which indicator ought to be strongly related to which underlying factor.This approach is appropriate if the number of factors and the assignment of indicators to latent constructs cannot be derived from conceptual considerations.However,in the field of TD status assessment theoretical ideas concerning the indicators and subindices of aggregate TDI are available for quite some time.Thus,a few researchers have started to apply confirmatory(instead of exploratory)factor analysis in conjunction with covariance-based SEM to build composite subindices and to aggregate them to a higher-order overall assessment(Grigorovici,Schement,& Taylor,2004;Kyriakidou et al.,2013).Studies using exploratory or confirmatory factor analysis techniques have yielded interesting insights with respect to the weights of individual indicators,the existence of latent assessment dimensions and the resulting possibility to introduce subindices.Nevertheless,they share a drawback:They calculate composite indices without incorporating the conceptual principle that a TD measure is not an end in itself in their statistical algorithms.Rather its“ultimate”purpose is to predict how changes in TD indicators(influenced by specific political/regulatory interventions)are linked to the attainment of socially valuable outcomes such as economic growth or improvement of the overall living conditions among a country's residents(Barzilai-Nahon,2006,p.270;Grigorovici et al.,2004,p.193;Hilbert,2011,pp.728,733;Saisana&Tarantola,2002, p.11;Waverman et al.,2011,pp.7–8).In principle,two avenues exist to link TDI construction to societal outcome criteria.First,it can be hypothesized that each country has unique political priorities in terms of telecommunications infrastructure and services.Therefore,TD-related indicator and subindex weights should be country-specific.Based on this view,Badasyan et al.(2011)and Waverman et al.(2011)have applied statistical techniques such as the“benefits of doubt”approach to derive TDI variable weights which vary across countries. Second,it can be argued that most of the relevant literature takes a country's TD status as an“enabler”to promote the achievement of a limited set of overarching societal targets as,for instance,promotion of economic development or human well-being(ITU,2013,pp.17–18;Pradhan et al.,2014).From this it follows that indicator and subindex weights of composite TD measures ought to be chosen as a function of clearly named societal objectives.This,in turn,has two implications.First,indicator and subindex weights may vary across outcome criteria studied.Second,various TDI need to be built in a way that the ability of each measure to predict its corresponding outcome criterion is maximized.Given that the second approach,which considers specific outcomes,has been largely overlooked in the literature,it is taken up in the present study.One statistical technique,which fits with the ends-oriented derivation of weights in TDI,is PLS SEM(cf.Chin,1998;Hair, Sarstedt,Ringle,&Mena,2012).It generates weights for individual indicators and subindices aggregated to a superordinated overall TDI in a way that the variance of a societally desirable correlate of the availability and use of networks and services explained by the intermediate level constructs and its indicators included in a conceptual model is maximized.In this way, PLS achieves the best possible reproduction of the raw data set.The focus on data reproduction is a crucial advantage of PLS over covariance-based SEM methods as exemplified in the popular LISREL and AMOS software packages(for an application of these methods to derive revised weights for the three IDI subindices see Kyriakidou et al.,2013).Covariance-based SEM estimate variable weights in a manner that the covariances of the observed indicators are reproduced as good as possible.In contrast,“the variance-based approach of PLS shifts the orientation from causal model/theory testing to component-based predictive modeling”(Chin&Newsted,1999,p.312).In addition,PLS has further strengths relative to covariance-based SEM. Among other things,these include less severely distorted parameter estimates in cases where variable distributions in a data set are extremely non-normal,less demanding minimum sample size requirements and greater ease in simultaneously incorporating formative and reflective measurement models of latent study constructs(Hair,Ringle,&Sarstedt,2011, pp.143–144;Weiber&Mühlhaus,2014,pp.73–78).Particularly,the question of choosing an appropriate measurement model has yet received no attention in studies which proposed composite ICT or telecommunications development indices.A measurement model posits relationships between。