
雅思写作小作文范文 雅思写作混合图 各产业用水量.doc
雅思写作小作文范文 雅思写作混合图 各产业用水量
今天我们雅思写作小作文范文的文章来研究混合图。该题目由两种图表组成。第一张折线图描述了从1990年到2000年这10年间,全球三大产业用水量的变化,以及它们互相之间的差别。第二张表格则给出了巴西和刚果民主共和国的人口、灌溉土地面积、以及人均用水量的数据。小编搜集了一篇相应的考官范文,以供大家参考。
雅思写作小作文题目
The graph and table below give information about water use worldwide and water
consumption in two different countries.
Summarise the information by selecting and reporting the main features, and make
comparisons where relevant.
雅思写作小作文范文
The charts compare the amount of water used for agriculture, industry and homes
around the world, and water use in Brazil and the Democratic Republic of Congo.
图表比较了世界上农业、工业和家庭用水的数量,以及巴西和刚果民主共和国的用水量。
It is clear that global water needs rose significantly between 1900 and 2000,
and that agriculture accounted for the largest proportion of water used. We can also
see that water consumption was considerably higher in Brazil than in the Congo.
很明显,全球用水量在1990年和2000年期间显著上涨。农业占据用水的最大比例。我们可以看到巴西的水资源消耗量要明显高于刚果。
In 1900, around 500km3 of water was used by the agriculture sector worldwide.
The figures for industrial and domestic water consumption stood at around one fifth
of that amount. By 2000, global water use for agriculture had increased to around
3000km3, industrial water use had risen to just under half that amount, and domestic
consumption had reached approximately 500km3.
1990年,在世界范围内,大约500立方的水被用于农业。工业和家庭用水只有这一数字的五分之一。到了2000年,全球农业用水上涨到大约3000立方。工业用水上升到该数字的一半,而家庭用水达到大约500立方。
In the year 2000, the populations of Brazil and the Congo were 176 million and
5.2 million respectively. Water consumption per person in Brazil, at 359m3, was much
higher than that in the Congo, at only 8m3, and this could be explained by the fact
that Brazil had 265 times more irrigated land.
2000年,巴西和刚果的人口分别为1亿7千6百万和520万。巴西的人均用水量为359立方,远比刚果的8立方要高。这部分是由于巴西的灌溉面积是刚果的265倍。
雅思写作小作文高分范文,快速提升写作成绩
雅思小作文流程图类题目范文及解析
千里之行,始于足下。
第 1 页/共 12 页
雅思小作文流程图类题目范文及解析
雅思小作文流程图类题目范文及解析,一起来学习一下吧,下面我就和大家共享,来观赏一下吧。
雅思小作文流程图类题目范文及解析
雅思小作文流程图类题目范文及解析为大家带来雅思小作文当中一类较有难度的图表——流程图类的小作文的范文以及解析。流程图顾名思义就是对某一有时间和步骤先后挨次的行为进行步骤的拆解,并配上相应的文字和解说而生成的图表。我们在处理流程图类图表作文是应当怎么写,请看下文。
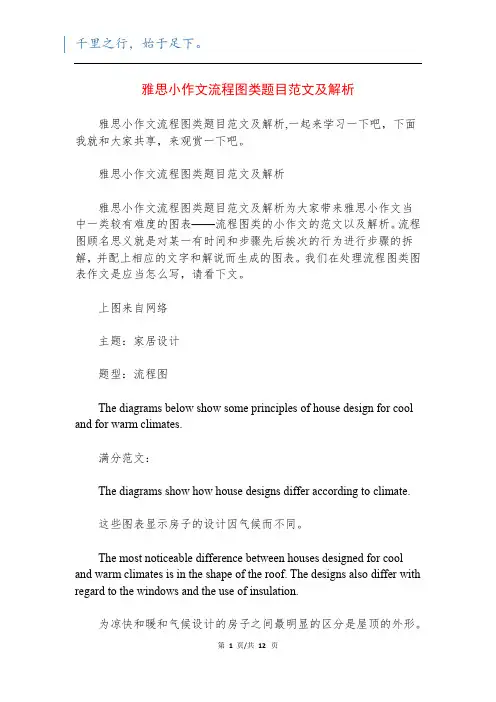
上图来自网络
主题:家居设计
题型:流程图
The diagrams below show some principles of house design for cool
and for warm climates.
满分范文:
The diagrams show how house designs differ according to climate.
这些图表显示房子的设计因气候而不同。
The most noticeable difference between houses designed for cool
and warm climates is in the shape of the roof. The designs also differ with
regard to the windows and the use of insulation.
为凉快和暖和气候设计的房子之间最明显的区分是屋顶的外形。千里之行,始于足下。
第 2 页/共 12 页
在窗户和保温材料的使用方面,设计也有所不同。
We can see that the cool climate house has a high-angled roof, which
雅思写作小作文范文 雅思写作饼状图pie chart 电力来源.doc

雅思写作小作文范文 雅思写作饼状图pie chart 电力来源
今天我们雅思写作小作文范文的文章来研究下饼状图pie chart。该图表展示了1980年和2000年,澳大利亚和法国在发电过程中使用的不同燃料的状况。具体燃料类型有:煤,石油,天然气,水能和核能。需要注意的是,该饼状图中的数字并不表示百分比,而是赋予了具体的数字。小编搜集了一篇相关的考官范文,以供大家参考。
雅思写作小作文题目
The pie charts below show units of electricity production by fuel source in
Australia and France in 1980 and 2000.
Summarise the information by selecting and reporting the main features, and make
comparisons where relevant.
雅思写作小作文范文
The pie charts compare the amount of electricity produced using five different
sources of fuel in two countries over two separate years.
该饼状图比较了两个国家在不同的年份使用五种不同燃料来源所产生的电能数量。
Total electricity production increased dramatically from 1980 to 2000 in both
Australia and France. While the totals for both countries were similar, there were
big differences in the fuel sources used.
雅思(写作)模拟试卷72(题后含答案及解析)

雅思(写作)模拟试卷72 (题后含答案及解析)
题型有:1. 2.
1. You should spend about 20 minutes on this task.The charts below give
information about the way in which water was used in different countries in
2000.Summarise the information by seiecting and reporting the main features, and
make comparisons where relevant.Write at least 150 words.
正确答案:The two diagrams give figures for water use in different parts of the
world in 2000. The first indicates that almost three-quarters of world
consumption(70%)was for agriculture, while 22% was used for industry and a mere
8% for domestic purposes. This pattern is almost identical to that for China in
2000, whereas India used even more water(92%)for agriculture and only 8% for
industrial and domestic sectors. In contrast, New Zealand used almost equal
proportions for agriculture and household use, 44% and 46% respectively, and a
雅思写作-小作文范文-饼图
饼图
B7T4
原题
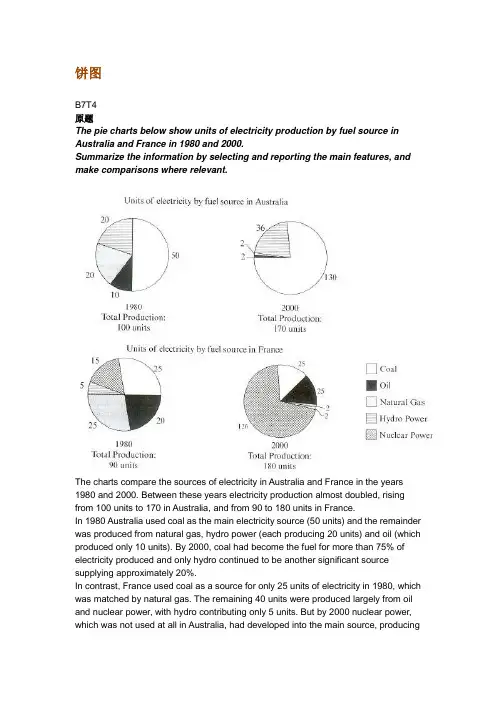
The pie charts below show units of electricity production by fuel source in
Australia and France in 1980 and 2000.
Summarize the information by selecting and reporting the main features, and
make comparisons where relevant.
The charts compare the sources of electricity in Australia and France in the years
1980 and 2000. Between these years electricity production almost doubled, rising
from 100 units to 170 in Australia, and from 90 to 180 units in France.
In 1980 Australia used coal as the main electricity source (50 units) and the remainder
was produced from natural gas, hydro power (each producing 20 units) and oil (which
produced only 10 units). By 2000, coal had become the fuel for more than 75% of
electricity produced and only hydro continued to be another significant source
supplying approximately 20%.
雅思写作小作文范文 雅思写作地图题map 城镇改造.doc
雅思写作小作文范文 雅思写作地图题map 城镇改造
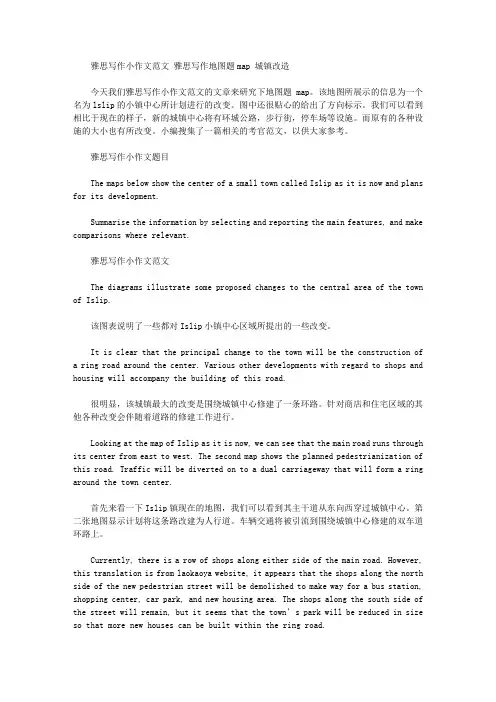
今天我们雅思写作小作文范文的文章来研究下地图题map。该地图所展示的信息为一个名为lslip的小镇中心所计划进行的改变。图中还很贴心的给出了方向标示。我们可以看到相比于现在的样子,新的城镇中心将有环城公路,步行街,停车场等设施。而原有的各种设施的大小也有所改变。小编搜集了一篇相关的考官范文,以供大家参考。
雅思写作小作文题目
The maps below show the center of a small town called Islip as it is now and plans
for its development.
Summarise the information by selecting and reporting the main features, and make
comparisons where relevant.
雅思写作小作文范文
The diagrams illustrate some proposed changes to the central area of the town
of Islip.
该图表说明了一些都对Islip小镇中心区域所提出的一些改变。
It is clear that the principal change to the town will be the construction of
a ring road around the center. Various other developments with regard to shops and
housing will accompany the building of this road.
很明显,该城镇最大的改变是围绕城镇中心修建了一条环路。针对商店和住宅区域的其他各种改变会伴随着道路的修建工作进行。
雅思写作小作文范文 雅思写作表格题table 耐用消费品情况.doc

雅思写作小作文范文 雅思写作表格题table 耐用消费品情况
今天我们雅思写作小作文范文的文章来研究下表格题table。该图表给出了1972年到1983年之间,英国居民使用各种电器的数据。具体条目包括中央暖气,电视,食品,吸尘器,冰箱,洗碗机,洗衣机,电话等。其中出现的数据众多,我们可以根据多和少,或者增长和降低来分类,并且挑选最高点和最低点来进行重点说明。小编搜集了一篇相关的高分范文,以供大家参考。
雅思写作小作文题目
The table below shows the consumer durables (telephone, refrigerator, etc.) owned
in Britain from 1972 to 1983.
Summarise the information by selecting and reporting the main features, and make
comparisons where relevant.
雅思写作小作文范文
The given table compares eight different consumer products possessed by the
British between 1972 and 1983. As a whole, television was the most common item they
were using during this period, while dishwasher, which was introduced in 1978, was
the least popular durable product in the UK.
上述表格比较了1972年到1983年之间英国居民所拥有的8种消费产品。整体来看,电视机是他们在此期间最经常使用的物品。而1978年才引入的洗碗机,是英国最不受欢迎的消费耐用品。
Simon考官A类雅思写作小作文范文-汇总
A类雅思写作小作文 共计41篇,篇篇9分,完整覆盖了雅思a类小作文的pie,bar,line,table, diagram, map, combination7大题型,范文皆雅思前考官英国曼城人simon的手笔,此人行文风格推崇简洁明快,适合烤鸭研读模仿。他的雅思小作文几乎都是4段式,字数一般在160左右。 一、柱状图(10) _________________________________________ 3 1. 柱状图:年龄分布 ___________________________________ 3 2. 柱状图:电子游戏 ___________________________________ 4 3. 柱状图:奥运奖牌 ___________________________________ 5 4. 柱状图:学习动机 ___________________________________ 5 5. 柱状图:交通事故 ___________________________________ 7 6. 柱状图:各地房价 ___________________________________ 7 7. 柱状图:日常消费 ___________________________________ 9 9. 柱状图:网聊耗时 __________________________________ 11 10. 柱状图:电话耗时 _________________________________ 12 二、饼图(4) ___________________________________________ 13 1. 饼图-垃圾处理 _____________________________________ 13 2. 饼图:三地用水 ____________________________________ 15 3. 饼图:服务问卷 ____________________________________ 15 4. 饼图:游客分析 ____________________________________ 16 三、流程图(8) _________________________________________ 17 1. 流程图:房屋保护 __________________________________ 17 2. 流程图:太阳能发电 ________________________________ 18 5. 流程图:房屋设计 __________________________________ 21 6. 流程图:水循环 ____________________________________ 23 7. 流程图:天气预报 __________________________________ 23
雅思图表小作文混合图范文
雅思图表小作文混合图范文
雅思图表小作文混合图范文分享,今天就给大家带来了雅思图表小作文混合图范文
,希望能够帮助到大家,下面就和大家分享,来欣赏一下吧。
雅思图表小作文混合图范文分享 独居人口比例
关于混合图题型(柱状图+饼状图):The bar chart below shows
the proportions of English men and women of different ages who
were living alone in 20XX. The pie chart compares the numbers of
bedrooms in these one-person households(在英国20XX年,不同年龄段独居人口的男女比例,以及独居家庭的房间数统计)。
雅思图表小作文混合图9分范文:
The two charts give information about single-occupant
households in England in the year 20XX. The bar chart compares
figures for occupants age and gender, and the pie chart shows data
about the number of bedrooms in these homes.
Overall, females made up a higher proportion of people living
alone than males, and this difference is particularly noticeable in
the older age categories. We can also see that the most common
number of bedrooms in a single-occupant home was two.
雅思写作小作文范文 雅思写作柱状图bar chart 男女休闲时间.doc
雅思写作小作文范文 雅思写作柱状图bar chart 男女休闲时间
今天我们雅思写作小作文范文的文章来研究下柱状图bar chart。该图表所呈现的信息为男性和女性每周在休闲娱乐上所花费的时间,并按照他们不同的工作状态进行了细分。图表本身并不复杂,也很好对不同的数据进行对比。小编搜集了一篇相关的高分范文,以供大家参考。
雅思写作小作文题目
The chart below shows the amount of leisure time enjoyed by men and women of
different employment status.
Summarise the information by selecting and reporting the main features, and make
comparisons where relevant.
Leisure time in a typical week in hour – by sex and employment status, 1998-99.
雅思写作小作文范文
The bar chart compares the leisure hours enjoyed by male and female based on the
employment status during the year 1998 to 1999.
该柱状图以工作状态为标准比较了男性和女性在1998年到1999年之间所拥有的休闲时间。
It is clearly evident from the graph that female in all respective of employment
status enjoys less time killing when compared to male. Men and women, who are
雅思柱状图小作文写作模板
雅思柱状图小作文写作模板
雅思小作文柱状图是考试中最常见的一类图形,柱状图如何描述写成为大家棘手的问题。下面为大家分享雅思柱状图小作文写作模板。大家可以参考学习。
雅思柱状图写作模板1
The bar chart compares the proportion of employees of both
genders employed in executive positions in ACNE Oil Company
within a one-year period between July 1993 and June 1994.
As can be seen from the chart, the percentage of male
employees generally increased with the rise of the job categories
from Grade E to Grade A while the opposite was true with that of
women.
Grade A, which was reported as the highest position, was a
male dominated one in which only one-tenth of the staff were
female while male employees accounted for the rest.
When it comes to Grade B and C, men also took up over half
of the employees, accounting for 80% and 60%, which are 50%
and 10% higher than that of women respectively.
However, the situation in the other two jobs categories,