Universality in short-range Ising spin glasses
Superconducting qubits II Decoherence
The transition from quantum to classical physics, now known as decoherence, has intrigued physicists since the formulation of quantum mechanics (Giulini et al., 1996; Leggett, 2002; Peres, 1993; Feynman and Vernon, 1963; Zurek, 1993). It has been put into the poignant Schr¨ odinger cat paradox (Schr¨ odinger, 1935) and was considered an open fundamental question for a long time.
and compare it to the corresponding classical mixture leading to the same expectation value of σz 1 1 0 ρmix = (2) 2 0 1 we can see that the von-Neumann entropy ρ = −kB Tr [ρ log ρ] rises from Spure = 0 to Smix = kB ln 2. Hence, decoherence taking ρpure to ρmix creates entropy and is irreversible. Quantum mechanics, on the other hand, is always reversible. It can be shown, that any isolated quantum system is described by the Liouville von-Neumann equation i¯ hρ ˙ = [H, ρ] (3)
Universality in the Recombination of Cesium-133 Atoms

a r X i v :0711.1908v 1 [c o n d -m a t .o t h e r ] 13 N o v 2007Universality in the Recombination of Cesium-133AtomsL.Platter ∗Department of Physics,The Ohio State University,Columbus,OH 43210andDepartment of Physics and Astronomy,Ohio University,Athens,OH 45701,USAJ.R.Shepard †Department of Physics,University of Colorado,Boulder,CO 80309,USA(Dated:February 2,2008)We demonstrate the implications of Efimov physics in the recently measured recombination rate of 133Cs atoms.By employing previously calculated results for the energy dependence of the re-combination rate of 4He atoms,we obtain three independent scaling functions that are capable of describing the recombination rates over a large energy range for identical bosons with large scat-tering length.We benchmark these universal functions by successfully comparing their predictions with full atom-dimer phase shift calculations with artificial 4He potentials yielding large scattering lengths.Exploiting universality,we finally use these functions to determine the 3-body recombina-tion rate of 133Cs atoms with large positive scattering length,compare our results to experimental data obtained by the Innsbruck group and find excellent agreement.PACS numbers:21.45.+v,34.50.-s,03.75.NtIntroduction -In atomic physics the term universality refers to phenomena which are a result of a two-body scattering length a much larger than the range R of the underlying potential and do not depend on any further parameters describing the two-body interaction.The non-relativistic three-body system also exhibits univer-sal properties if a ≫R ,but an additional three-body parameter is needed for the theoretical description of ob-servables.Therefore,one three-body observable can be used (e.g.the atom-dimer scattering length a 3)to pre-dict all other low-energy observables of such systems.A particularly interesting signature of universality in the three-body system is a tower of infinitely many bound states (Efimov states )in the limit a =±∞with an ac-cumulation point at the scattering threshold and a geo-metric spectrum :E (n )T=(e −2π/s 0)n −n ∗¯h 2κ2∗/m,(1)where κ∗is the binding wavenumber of the branch ofEfimov states labeled by n ∗.The three-body system dis-plays therefore discrete scaling symmetry in the univer-sal limit with a scaling factor factor e π/s 0.In the case of identical bosons,s 0≈1.00624and the discrete scaling factor is e π/s 0≈22.7.These results were first derived in the 1970’s by Vitaly Efimov [1,2]and were rederived in the last decade in the framework of effective field theories (EFT)[3,4].Recently,experimental evidence for Efimov physics was found by the Innsbruck group [5].Using a mag-netic field to control the scattering length via a Feshbachresonance,they measured the recombination rate of cold 133Cs atoms and observed a resonant enhancement in the three-body recombination rate at a ≈−850a 0which occurs because an Efimov state is close to the 3-atom threshold for that value of a .The three-body recombi-nation rate for atoms with large scattering length at non-zero temperature has been calculated with a number of different models or based on the universality of atoms with large scattering lengths [6,7,8,9,10].However,a striking way to demonstrate universality is to describe observables of one system with information which has been extracted from a completely different system.In [11],the authors considered Efimov’s radial laws which parameterize the three-atom S-matrix in terms of six uni-versal functions which depend only on a dimensionless scaling variable,x =(ma 2E/¯h 2)1/2,and phase factors which only contain the three-body parameter.In this work,simplifying assumptions justified over a restricted range of x were made to reduce the six universal functions required to parameterize the atom-dimer recombination rate to just a single function.This function was then extracted from microscopic calculations of the recombi-nation rates for 4He atoms by Suno et al.[12].In a recent paper,Shepard [13]calculated the recombination rates from atom-dimer elastic scattering phase shifts for four different 4He potentials and was able to obtain two uni-versal functions.Here,we relax some of the simplifying assumptions made in [11]and extract a set of three independent universal functions capable of parameterizing the three-body re-2 combination rate.We test the performance of these uni-versal functions using“data”generated from phase shiftcalculations[13]employing artificial short-range4He po-tentials.Finally,we use the new universal functions tocalculate the scattering length and temperature depen-dent recombination rate for133Cs atoms as measured bythe Innsbruck group[5]and comment on our results.Recombination-Three-body recombination is a pro-cess in which three atoms collide to form a diatomicmolecule(dimer).If the scattering length is positiveand large compared to the range of the interaction,wehave to differentiate between deep and shallow dimers.Shallow dimers have an approximate binding energy ofE shallow≃¯h2/(ma2)≪¯h2/(mR2).The binding energyof deep dimers cannot be expressed in terms of the ef-fective range parameters and E deep>¯h2/(mR2).If theunderlying interaction supports deep bound states,re-combination processes can occur for either sign of a.In acold thermal gas of atoms,recombination processes leadto a change in the number density of atoms n Adx4|S AD,AAA|2,(7)where k denotes a numerical constant.The matrix el-ement S AD,AAA is related to the S-matrix element forelastic scattering by the optical theorem|S AD,AAA|2=1−|S AD,AD|2.(8)Efimov’s radial law then gives the dependence on univer-sal functions and the three-body parameter a∗0asS AD,AD=s22(x)+s212(x)e2is0ln(a/a∗0)1−e−4πs0e2iδ2.(10)It follows that|s11(0)|≃0.002.Thefirst simplifyingassumptions being made in[11]was that this functionremains small(i.e.;≪1)for all x and can be ignored.Then the energy dependent recombination rate can bewritten asK(0)(E)=C max sin[s0ln(aa∗0)](h2(x)+ih4(x))2¯h a412H(x)for two representative values of y=−1(dotted line) and y=2(dot-dashed line).therefore be possible to extract all four h i’s from these results.In the present work,we have attempted to do so,however,it turns out that this is numerically not possible. The most probable reason for this is is the effect of rangecorrections which is R/a∼0.1for typical helium poten-tials.We therefore write h3and h4as h3(x)=y(x)H(x) and h4(x)=(1−y(x))H(x).Assuming that y(x)is aslowly varying function,we let y(x)→y,a constant,andobtainh3(x)=yH(x),h4(x)=(1−y)H(x).(13) Byfitting the resulting expression for different choices toy to the recombination rates of all four4He potentials. It turns out that our results are mostly insensitive to thechoice of y apart from an overall scaling factor for thefunction H(x)which means,in effect,that we are unable discriminate between h3and h4in ourfitting procedure.Our results for the functions h1,h2and H are displayed in Fig.1.As required by the threshold condition,all threefunctions vanish at threshold.It should be noted that forx<1the function H(x)∼0and is small compared to h1 and h2for x>1which confirms the assumptions madeabout the imaginary part of the amplitude in Eq.(11)made in[11].To test our new parameterizations we have generated three artificial potentials(which we call I,IIand III)characterized by different three-body parameters a∗0(with a/a∗0=1.32,1.16and0.99,respectively)but having approximately the same ratio of R/a as the real 4He potentials used in this work.We have calculated the recombination rates for these potentials and use these re-sults to benchmark our universal functions.Our resultsare displayed in Fig.2.Wefind that the new set of func-tions is capable of describing the recombination rates of these potentials over a relatively large range of x.For comparison we also display the corresponding results for the case that H(x)is set to0which demonstrates that FIG.2:The exact and predicted results for the potentials I(circles and thick solid line),II(squares and thick dashed line)and III(triangles and thick dot-dashed line).The thin solid,dashed and dot-dashed line denote the corresponding results for potentials I,II and III obtained with the functions h1and h2only and the function H set to zero.adding H(x)amounts to a significant improvement of the description of observables at large energies.Results for Cesium-We now use the three universal functions h1(x),h2(x)and H(x)discussed in the previ-ous sections to calculate three-body recombination rates for ultracold133Cs atoms.133Cs atoms can recombine into deep and shallow dimers.As mentioned above,a deep dimer is so strongly bound that it cannot be de-scribed within the EFT for short-range interactions as the binding energy is larger than¯h2/(mR2).We account for such processes by letting ln a∗0→ln a∗0−iη∗/s0as also discussed above.We then calculate the temperature dependent recombination rate by calculatingα(T)=∞0dE E2e−E/(k B T)K3(E)√4FIG.3:The3-body recombination lengthρ3for133Cs for a∗0=210a0and three different values of the parameterη∗:0 (solid line),0.01(dashed line),and0.06(dotted lines)plot-ted together with the experimental results of the Innsbruck experiment(triangles)[5].universal functions s ij vary only weakly with energy pos-sibly explains the good qualitative results of the descrip-tion of the recombination in terms of a small number of real functions.We have tested the quality of our parame-terizations with artificialfinite range potentials which are appreciably different from the original Helium potentials but which display universal effects in three-body sector.We have found that our three real universal functions can describe the recombination of these artificial poten-tials reasonably well which gives further evidence that the assumptions made in[11]were well justified.Finally, we have used these functions to compute the recombi-nation length for133Cs atoms for different values of the parameterη∗which approximately accounts for the effect of deep dimer states and have compared our results withexperimental data obtained by the Innsbruck group[5]. Although our results show very good agreement withthe data,sensitivity toη∗is insufficient to permit a pre-cise determination of this parameter.Overall,we con-sider our results to be an excellent example of how few-body systems with large scattering length exhibit uni-versal features.The low-energy properties of4He atoms allow us to compute accurately the low-energy properties of a gas of a completely different element,133Cs,which atfirst glance has little in common with4He. Nevertheless,we point out that the results cannot be thought of as complete treatment of the problem at hand. For example,not only did we make the assumption that some of the universal functions(specifically,some of the s ij’s)do not contribute significantly to the recombination coefficients,we also extracted the functions from data sets obtained withfinite range potentials.Although the impact of range corrections is known to be small for real-istic Helium atom-atom potentials as R/a∼0.1,it needs to be pointed out that range corrections are expected to be sizable for large enough energies.To obtain all uni-versal functions s ij relevant to the recombination rate, a calculation in the limit R→0seems therefore to be necessary.This will also allow a precise determination of the energy-dependence of K deep(E)[18].Furthermore,it is already understood how to include range corrections systematically in the framework of effectivefield theory [14,15,16].Indeed,this approach has already been used to calculate range corrections to the recombination rate into a shallow dimer[17].Thus,further effort should be devoted to include these effects in the calculation of the energy-dependent recombination rate.We are thankful to Eric Braaten for useful discussions and comments on the manuscript.This work was sup-ported in part by the Department of Energy under grant DE-FG02-93ER40756,by the National Science Founda-tion under Grant No.PHY–0354916.∗Electronic address:lplatter@†Electronic address:James.Shepard@[1]V.Efimov,Phys.Lett.33B,563(1970).[2]V.N.Efimov,Sov.J.Nucl.Phys.12,589(1971).[3]P.F.Bedaque,H.W.Hammer and U.van Kolck,Phys.Rev.Lett.82,463(1999).[4]E.Braaten and H.-W.Hammer,Phys.Rept.428,259(2006).[5]T.Kraemer,M.Mark,P.Waldburger,J.G.Danzl,C.Chin,B.Engeser,A.nge,K.Pilch,A.Jaakkola,H.-C.N¨a gerl,and R.Grimm,Nature440,315(2006).[6]J.P.D’Incao,H.Suno,and B.D.Esry,Phys.Rev.Lett.93,123201(2004).[7]M.D.Lee,T.Koehler and P.S.Julienne,Phys.Rev.A76,012720(2007).[8]S.Jonsell,Europhys.Lett.76,8(2006).[9]M.T.Yamashita,T.Frederico,and L.Tomio,Phys.Lett.A363,468(2007).[10]P.Massignan and H.T.C.Stoof,“Efimov states near aFeshbach resonance,”arXiv:cond-mat/0702462.[11]E.Braaten,D.Kang and L.Platter,Phys.Rev.A75,052714(2007).[12]H.Suno,B.D.Esry,C.H.Greene,and J.P.Burke,Phys.Rev.A65,042725(2002).[13]J.R.Shepard,Phys.Rev.A75,062713(2007).[14]P. F.Bedaque,G.Rupak,H.W.Griesshammer andH.W.Hammer,Nucl.Phys.A714,589(2003).[15]H.W.Hammer and T.Mehen,Phys.Lett.B516,353(2001).[16]L.Platter and D.R.Phillips,Few Body Syst.40,35(2006).[17]H.W.Hammer,hde and L.Platter,Phys.Rev.A75,032715(2007).[18]E.Braaten,H.-W.Hammer,D.Kang and L.Platter,inpreparation.。
Universality of the Plastic Instability in Strained Amorphous Solids翻译
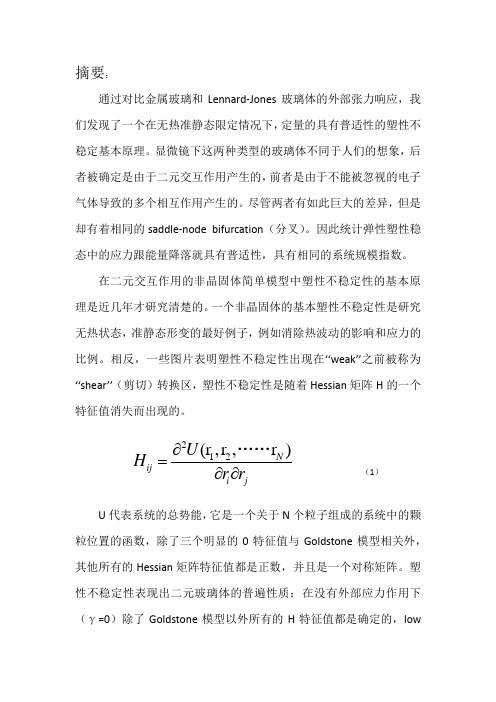
摘要:通过对比金属玻璃和Lennard-Jones 玻璃体的外部张力响应,我们发现了一个在无热准静态限定情况下,定量的具有普适性的塑性不稳定基本原理。
显微镜下这两种类型的玻璃体不同于人们的想象,后者被确定是由于二元交互作用产生的,前者是由于不能被忽视的电子气体导致的多个相互作用产生的。
尽管两者有如此巨大的差异,但是却有着相同的saddle-node bifurcation (分叉)。
因此统计弹性塑性稳态中的应力跟能量降落就具有普适性,具有相同的系统规模指数。
在二元交互作用的非晶固体简单模型中塑性不稳定性的基本原理是近几年才研究清楚的。
一个非晶固体的基本塑性不稳定性是研究无热状态,准静态形变的最好例子,例如消除热波动的影响和应力的比例。
相反,一些图片表明塑性不稳定性出现在‘‘weak’’之前被称为‘‘shear’’(剪切)转换区,塑性不稳定性是随着Hessian 矩阵H 的一个特征值消失而出现的。
212(r ,r ,r )N ij i jU H r r ∂=∂∂…… (1) U 代表系统的总势能,它是一个关于N 个粒子组成的系统中的颗粒位置的函数,除了三个明显的0特征值与Goldstone 模型相关外,其他所有的Hessian 矩阵特征值都是正数,并且是一个对称矩阵。
塑性不稳定性表现出二元玻璃体的普遍性质:在没有外部应力作用下(γ=0)除了Goldstone 模型以外所有的H 特征值都是确定的,lowlying 特征值与扩展特征函数相关联。
随着外部应力的增加,某一个特征值也会逐渐降为零,同时相关的特征函数也变成局部的,此时的特征值用λp 表示,在γp 处到达零时通过 saddle-node bifurcation ,这种方式具有普遍性。
P λ∝上面这个约束有很多有趣的结论。
一个最直接的结论就是系统最小值与凹点之间的势垒E 最终倾向于零32()P E γγ∝-这些通过在弹性塑性稳态下统计的应力跟能量降落的约束得到的结论并不明显(可能说是更有趣)。
电子信息类专业英语(西电第二版)Unit 4 Microel

Unit 4 Microelectronics
Integrated circuits are small, light, rugged, and reliable. They require less power and lower voltages than equivalent macroscopic circuits; consequently they operate at lower temperatures, and individual components may be close together without exceeding the operating temperature limit. Relatively little stray capacitance and short time delays are produced because of the short interconnections between the individual components in IC. Maintenance is simplified because if a component of the IC fails the complete IC is usually replaced. Mass production techniques of plane technology have reduced the cost of many IC so that they are almost as inexpensive as a single transistor. Eventually most conventional circuits will be replaced by IC.
[2] The reduction in power dissipation is particularly important where a complex circuit is to be concentrated into a small space. The problem of extracting the heat generated in the circuit may then be a difficult one.
PREFACE

2
Nara Women’s University
3
Table of Contents
Session 1 Session 2 Session 3 Session 4 Session 5 Session 6 Session 7 Session 8 Session 9 Session 10 Session 11 Session 12 Session 13 Session 14
General Session Young Researchers Session Approximate Algebraic Computation Computational Algebraic Structures and Engineering Applications Computer Algebra and Coding Theory Computer Algebra in Quantum Information and Computation Computer Algebra in the Biological Sciences Computational Topology and Geometry Computer Algebra in Education Handling Large Expressions in Symbolic Computation High-Performance Computer Algebra Newton and Hensel Techniques in Scientific Computing Parametric and Nonconvex Constraint Solving Pen-Based Mathematical Computing
Abstracts of Presentations
不可压缩均匀各向同性湍流直接数值 1024 POF Gotoh_Fukayama_Nakano

Velocityfield statistics in homogeneous steady turbulence obtained using a high-resolution direct numerical simulationToshiyuki Gotoh a)Department of Systems Engineering,Nagoya Institute of Technology,Showa-ku,Nagoya466-8555,JapanDaigen FukayamaInformation and Mathematical Science Laboratory,Inc.,2-43-1,Ikebukuro,Toshima-ku,Tokyo171-0014,JapanTohru NakanoDepartment of Physics,Chuo University,Kasuga,Bunkyo-ku,Tokyo112-8551,JapanVelocityfield statistics in the inertial to dissipation range of three-dimensional homogeneous steadyturbulentflow are studied using a high-resolution DNS with up to Nϭ10243grid points.The rangeof the Taylor microscale Reynolds number is between38and460.Isotropy at the small scales ofmotion is well satisfied from half the integral scale͑L͒down to the Kolmogorov scale͑͒.TheKolmogorov constant is1.64Ϯ0.04,which is close to experimentally determined values.The thirdorder moment of the longitudinal velocity difference scales as the separation distance r,and itscoefficient is close to4/5.A clear inertial range is observed for moments of the velocity differenceup to the tenth order,between2Ϸ100and L/2Ϸ300,whereis the Taylor microscale.Thescaling exponents are measured directly from the structure functions;the transverse scalingexponents are smaller than the longitudinal exponents when the order is greater than four.Thecrossover length of the longitudinal velocity structure function increases with the order andapproaches2,while that of the transverse function remains approximately constant at.Thecrossover length and importance of the Taylor microscale are discussed.©2002AmericanInstitute of Physics.͓DOI:10.1063/1.1448296͔I.INTRODUCTIONKolmogorov studied the statistical laws of a velocity field for small scales of turbulent motion at high Reynolds numbers.1,2Two hypotheses were introduced in his theory ͑hereafter K41for short͒:local isotropy and homogeneity exists;and there is an inertial range in the energy spectrum of theflow that is independent of viscosity and large-scale properties at sufficiently high Reynolds numbers.The most prominent conclusion of his theory is the presence of the Kolmogorov spectrum E(k)ϭK⑀¯2/3kϪ5/3in the inertial range,where⑀¯is the average rate of energy dissipation per unit mass and K is a universal constant.Since K41,there has been a considerable amount of ef-fort made to study the turbulent velocityfield statistics in the inertial range,and the energy spectrum has been a central quantity of interest.The Kolmogorov spectrum and constant have been measured infield and laboratory experiments.3–7 The exponent for the inertial range spectrum is now widely accepted asϪ5/3,with a small correction to account forflow intermittency.The Kolmogorov constant K is between1.5 and 2.After studying the results of many experiments, Sreenivasan stated that K is1.62Ϯ0.17.7The spectral theory of turbulence has also been used to predict the Kolmogorov constant.The value of K is1.77when the Lagrangian history direct interaction approximation͑LHDIA͒is used,8,9and 1.72when the Lagrangian renormalized approximation ͑LRA͒is used.10,11These are fully systematic theories that do not contain any ad hoc parameters.Direct numerical simulations͑DNSs͒of turbulentflows are now performed at higher Reynolds numbers,due to the recent dramatic increase in computational power.In the early 90’s,the resolution of DNS reached Nϭ5123grid points with a Taylor microscale Reynolds number Rof 210ϳ240.12–20Most high-resolution DNSs have been per-formed for steady turbulence conditions to achieve high Rey-nolds numbers and obtain reliable statistics.Although results were reported with Rgreater than200,an inertial range spectrum was observed only for the lowest narrow wave number band at which forcing was applied.The Kolmogorov constant was inferred to be about1.5ϳ2in Ref.14and1.62 in Ref.16,but these results are not convincing,due to the insufficient width of the scaling range,anisotropy of theflow field,limited ensemble size,forcing techniques used,and numerical limitations of the simulations.Intermittency has also attracted the interest of research-ers.Since Kolmogorov’s intermittency theory͑hereafter K62͒,21many theoretical and statistical models of intermit-tency have been developed.4,22,23The scaling exponents of higher order structure functions for velocity differences in the inertial range were studied intensively.Intermittency in-creases with a decrease in the size of the scales of motion. The small-scale statistics gradually deviate from a Gaussian distribution,and the scaling exponents differ from those pre-dicted by K41.Experiments at very high Reynolds numbers have beena͒Electronic mail:gotoh@system.nitech.ac.jpPHYSICS OF FLUIDS VOLUME14,NUMBER3MARCH200210651070-6631/2002/14(3)/1065/17/$19.00©2002American Institute of Physicsperformed in the atmospheric boundary layer and in huge wind tunnels,and the measured scaling exponents were found to deviate from K41scaling.5,6,24,25,84However,there have been arguments made about the lack of small-scaleflow isotropy and homogeneity in these experiments,which might be affected by the large-scale shear.25,26For experiments at moderate Reynolds numbers under relatively well-controlled laboratory conditions,the width of the scaling range is usually not large enough to determine the scaling exponents precisely.Extended self-similarity͑ESS͒has been exploited to overcome this difficulty and applied to various turbulentflows in both experiments and DNSs.28–31 The idea is to measure the scaling exponents of the structure functions when they are plotted against the third order lon-gitudinal structure function,rather than to use the separation distance.The width of the scaling range is longer than that obtained with the usual method at low to moderate Reynolds numbers.The scaling exponents are anomalous,but do agree with those obtained from high Reynolds number experiments up to a certain order.24,28–31However,there is no consensus as to why the structure functions give a longer inertial range, or what is missing from theflow statistics as a result.Also, there is no unique way to determine the scaling exponents for the transverse and mixed velocity structure functions,be-cause those higher order structure functions can be plotted against other types of third order structure functions as well as the third order longitudinal structure function.There also have been arguments about whether the scal-ing exponents for the longitudinal and transverse structure functions at small scales are equal.25–27,32–38Many experi-ments and DNSs have reported that higher order longitudinal scaling exponents are larger than transverse ones.However, some researchers have argued that the difference is due to deviation from the assumed conditions,such as local homo-geneity,isotropy,and the independence of small scales from macroscale parameters.They have suggested that when the Reynolds number becomes large enough,the difference will vanish.36,37,39,40In many aspects of turbulence research,there have been questions posed about the extent to which the local homoge-neity and isotropy of the turbulent velocityfield are attained. This will affect the small-scale statistics significantly.Recent experimental studies have shown that local isotropy is par-tially satisfied for lower order moments.25,26,37However,it is not sufficient to examine only the conditions assumed in the above studies,and only a limited knowledge of the trueflow conditions is available so far.26,37,38A DNS with a sufficiently large grid size provides abetter opportunity to examine the points raised above.It hasthe advantage that any physical quantity can be measureddirectly without deforming theflowfield.In the presentstudy,a series of large scale DNSs have been performed at ahigh resolution of up to Nϭ10243and Rϭ460.41–45The inertial range of the turbulencefield has a considerablelength,and useful velocity statistics can be extracted such asthe Kolmogorov constant,the energy spectrum,velocitystructure functions up to the tenth order,their scaling expo-nents,and probability density functions for velocity differ-ences.To the authors’best knowledge,these are thefirstDNS data in the inertial range;the data provide new insightinto the inertial and dissipation ranges.The main purposes of the present paper are to describethe statistics of the velocityfield in an incompressible steadyturbulentflow obtained from the DNS,and to reexaminecurrent knowledge of turbulence,developed since K41.Thepaper is organized as follows.The numerical aspects of thepresent DNS are described in Sec.II,and the energy spec-trum is examined in Sec.III.The variation of single pointquantities and probability density functions͑PDFs͒with theReynolds number is discussed in Sec.IV.The isotropy of thesecond and third order moments of the velocity difference isexamined in Sec.V,and the energy budget is examined interms of the Ka´rma´n–Howarth–Kolmogorov equation inSec.VI.The structure functions and scaling exponents arediscussed in Sec.VII.Section VIII presents an analysis ofthe crossover lengths of the structure functions.Finally,asummary and conclusions are provided in Sec.IX.II.NUMERICAL SIMULATIONThe Navier–Stokes equations are integrated in Fourierspace for unit density:ͩץץtϩk2ͪuϭP͑k͒•F͓uÃ͔kϩf,͑1͒͗f͑k,t͒f͑Ϫk,s͒͘ϭP͑k͒F͑k͒4k2␦͑tϪs͒,͑2͒whereis the vorticity vector,P͑k͒is the projection opera-tor,F denotes a Fourier transform,and f is a solenoidal Gaussian random force that is white in time.The spectrum of the random force F(k)is constant over the low wave number band and zero otherwise;the force is normalized asTABLE I.DNS parameters and statistical quantities of the runs.T eddya v is the period used for the time average.RN k maxc f Forcing range T eddya v E⑀¯L(ϫ10Ϫ2)K 38128360 1.50ϫ10Ϫ2 1.30ͱ3рkрͱ1222.6 1.99 1.190.8910.501 4.10¯5425631217.00ϫ10Ϫ30.70ͱ3рkрͱ1214.9 1.390.6270.8290.393 2.72¯702563121 4.00ϫ10Ϫ30.50ͱ3рkрͱ1249.7 1.160.4570.7850.318 1.93¯1255123241 1.35ϫ10Ϫ30.50ͱ3рkрͱ12 5.52 1.250.4920.7440.1850.841¯2845123241 6.00ϫ10Ϫ40.501рkрͱ6 3.03 1.960.530 1.2460.1490.449 1.64 38110243483 2.80ϫ10Ϫ40.511рkрͱ6 4.21 1.740.499 1.1390.09890.258 1.63 46010243483 2.00ϫ10Ϫ40.511рkрͱ6 2.14 1.790.506 1.1500.08410.199 1.64 1066Phys.Fluids,Vol.14,No.3,March2002Gotoh,Fukayama,and Nakano͵ϱF ͑k ͒dk ϭ⑀¯in ,͑3͒where ⑀¯in is the average rate of the energy input per unit mass.A pseudo-spectral code was used to compute the con-volution sums,and the aliasing error was effectively re-moved.The time integration was performed using the fourth order Runge–Kutta–Gill method.Physical quantities of turbulent flow include the total energyE ͑t ͒ϭ12͗u 2͘ϭ32u ¯2ϭ͵ϱE ͑k ͒dk ,͑4͒the average energy dissipation per unit mass⑀¯ϭ2͵ϱk 2E ͑k ͒dk ,͑5͒the integral scaleL ϭͩ34͵ϱk Ϫ1E ͑k ͒dkͪͲE ,͑6͒the Taylor microscaleϭͩ5EͲ͵ϱk 2E ͑k ͒dkͪ1/2,͑7͒the Taylor microscale Reynolds numberR ϭu ¯,͑8͒and the Kolmogorov scaleϭͩ3⑀¯ͪ1/4.͑9͒The range of the Taylor microscale Reynolds number was 38to 460.The characteristic parameters of the DNS are listed in Table I.43Most of these are identical to Gotoh and Fukayama,43but the averaging time for R ϭ381was ex-tended to 4.21large eddy turnover times.A statistically steady state was confirmed by observing the time evolutionof the total energy,the total enstrophy,and the skewness of the longitudinal velocity derivative.The statistical averages were computed as time averages over tens of large eddy turnover times for the lower Reynolds number flows,and over a few large eddy turnover times for the higher Reynolds number flows.The resolution condition k max Ͼ1was satis-fied for most runs,except for R ϭ460in which k max was slightly less than unity (k max ϭ0.96).This does not ad-versely affect the results in the inertial range.The computational time required for runs at a N ϭ10243resolution varied,depending on the statistical data that was gathered.Typically,60h was required for one large eddy turnover time.The total time of the computations was more than 500h for the longest run (R ϭ381).Data col-lected during the transition period to steady state ͑about six large eddy turnover times ͒were discarded.The relatively long time required to attain steady state was due to the low wave number band forcing.This imposes a severe computa-tional putations with R р284were per-formed on a Fujitsu VPP700E parallel vector machine with 16processors at RIKEN.Simulations of higher R were per-formed on a Fujitsu VPP5000/56with 32processors at the Nagoya University Computation Center.III.ENERGY SPECTRUMFigure 1shows the three-dimensional energy spectrum calculated for each run.All of the curves are scaled to the Kolmogorov units and multiplied by k 5/3.As the Reynolds number increases,the curves extend toward lower wave numbers.The curves of flows with Reynolds numbers larger than R ϭ284contain a finite plateau,which indicates that E (k )ϰk Ϫ5/3.There is a bump when 0.04рk р0.3at the high end of the inertial range,which is consistent with pre-vious experimental and numerical observations.6,16The nor-malized energy transfer flux,defined by1⑀¯⌸͑k ͒ϭ1⑀¯͵kϱT ͑k Ј͒dk Ј͑10͒is shown in Fig.2,where T (k )is a nonlinear energy transfer function in the energy spectrum equation.4,22Between0.007рk р0.04,⌸(k )/⑀¯is approximately constantand FIG.1.Scaled energy spectra,⑀¯Ϫ1/4Ϫ5/4(k )5/3E (k ).The inertial range is 0.007рk р0.04and K ϭ1.64Ϯ0.04.A horizontal line indicates K ϭ1.64.FIG.2.Normalized energy transfer flux,⌸(k )/⑀¯for R ϭ381and 460.1067Phys.Fluids,Vol.14,No.3,March 2002Velocity field statistics in homogeneousclose to unity;thus the flow is in an equilibrium state over the inertial range of the energy spectrum,corresponding to the plateaus in Fig.1.The Kolmogorov constant given in Table I is determined using a least square fit between 0.007рk р0.04on the R Ͼ284curves.In Ref.43,the Kolmog-orov constant was reported as K ϭ1.65Ϯ0.05.However,the averaging time has since been extended for the R ϭ381run.The R ϭ478run differs slightly from statisticalequilibrium,since ⌸(k )/⑀¯is not exactly one;for this reason,the R ϭ478data were not used for this analysis.The Kol-mogorov constant,computed using the data only from the R ϭ381and 460runs,isK ϭ1.64Ϯ0.04,͑11͒which is in good agreement with experimental values and recent DNS data.7,16There are many DNSs reporting the Kolmogorov constant higher than the value 1.64.However,the length of the inertial range in those DNSs is not long enough to clearly observe the k Ϫ5/3range,and the top of the bump of the compensated energy spectrum k 5/3E (k )is un-derstood as the inertial range,so that the Kolmogorov con-stant is read as about 2as seen in Fig.1.16The Kolmogorov constant 1.64is also close to the value obtained using the LHDIA ͑1.77͒,8,9the LRA ͑1.72͒.10,11These spectral theories of turbulence are consistent with Lagrangian dynamics,arederived systematically,and contain no ad hoc parameters.Figure 3shows the one-dimensional energy spectrum ob-tained from the present DNS with R ϭ460,from experi-ments,and from the LRA.The agreement between the curves is satisfactory.Therefore we conclude that the present DNS has successfully calculated a homogeneous turbulent flow field in the inertial range of the energy spectrum.IV.ONE-POINT STATISTICS A.MomentsSome one-point moments of the velocity field areS 3͑u ͒ϵ͗u 3͗͘u 2͘3/2,S 3͑u x ͒ϵ͗u x 3͗͘x 2͘3/2,͑12͒K 4͑u ͒ϵ͗u 4͗͘u 2͘2,K 4͑u x ͒ϵ͗u x 4͗͘u x 2͘2,K 4͑u y ͒ϵ͗u y 4͗͘u y 2͘2,͑13͒where u is the velocity component in the x direction.The variation of these moments with the Reynolds number is shown in Fig.4and listed in Table II.The general behavior of the curves is consistent with previous DNS and experi-mental data.13,14,18,19,26,46,47There are small effects of rela-tively low resolution on S 3and K 4for the velocity deriva-tives for R ϭ381and 460data.The skewness factor of the velocity u is very small for runs with the R р125,and isofparison of one-dimensional energy spectra.Symbols:experi-ments,solid line:present DNS (R ϭ460),dashed line:statistical theory ͑LRA and MLRA ͒.FIG.4.Variation of the moments of the velocity and velocity gradient withthe Reynolds number.Line:present DNS,circle:K 4(u y )͑Jime´nez et al.,Ref.13͒,solid square:K 4(u )͑Jime ´nez et al.,Ref.13͒,square:K 4(u x )͑Wang et al.,Ref.14͒,plus:K 4(u x )͑Vedula and Yeung,Ref.18͒,star:ϪS 3(u x )͑Wang et al.,Ref.14͒.TABLE II.Moments of the velocity and velocity derivatives.R S 3(u )K 4(u )S 3(ץu /ץx )K 4(ץu /ץx )K 4(ץu /ץy )380.0227 2.89Ϫ0.520 4.14 5.16540.00563 2.86Ϫ0.517 4.47 6.00700.00473 2.93Ϫ0.519 4.81 6.621250.0820 2.94Ϫ0.529 5.658.192840.0231 2.77Ϫ0.531 6.6310.1381Ϫ0.246 2.98Ϫ0.5747.9012.2460Ϫ0.1682.89Ϫ0.5457.9111.71068Phys.Fluids,Vol.14,No.3,March 2002Gotoh,Fukayama,and Nakanothe order of 0.2for runs with the R у284.The relatively large values of the velocity skewness are caused by the shorter averaging time used compared to the low Reynolds number runs.Since most of the energy resides in the lowest wave number band,there are persistent large fluctuations of the large scales of motion over longer time period.The longer time average or the forcing at larger wave numbers would yield smaller velocity skewness.The flatness factor of the velocity field is close to three,which is the Gaussian value.The skewness factor of the longitudinal velocity deriva-tives is very insensitive to the Reynolds number,S 3͑u x ͒ϰR 0.0370,͑14͒where the exponent is determined by a least square fit.Theaverage value is Ϫ0.53,which is consistent with experimen-tal observations over the range of Reynolds numbers studied in the present work.However,the exponent is smaller than indicated by the experimental data.26,46The flatness factors for the longitudinal and transverse velocity derivatives in-crease with the Reynolds number asK 4͑u x ͒ϰR 0.266,K 4͑u y ͒ϰR 0.335.͑15͒The exponent of K 4(u y )is larger than that of K 4(u x );thus,the PDF for the transverse velocity derivative has longer tails than those of the longitudinal velocity derivative.From ex-perimental observations,Shen and Warhaft reported thatK 4(u x )ϰR 0.37and K 4(u y )ϰR 0.25.26Since there is scatter in the experimetal data,the exponents in Eq.͑15͒by the present DNS are not inconsistent with the experimental data.Van Atta and Antonia studied the Reynolds number dependence of S 3(u x )and K 4(u x ),46and found thatS 3͑u x ͒ϰR 0.12,K 4͑u x ͒ϰR 0.32for ϭ0.2,͑16͒S 3͑u x ͒ϰR 0.15,K 4͑u x ͒ϰR 0.41for ϭ0.25,͑17͒where is the exponent defined by ͗⑀r 2͘ϰr Ϫfor the locally averaged energy dissipation rate.4,21Generally,the Reynolds number dependency of S 3and K 4in our DNSs is weaker than observed in the experiments,irrespective of the type of forcing used.We believe this is because the range of Rey-nolds numbers in DNS is smaller than experimental flows,and there remain small-scale anisotropy effects in the experi-ments.B.Probability density functionsThe probability density function conveys information about single-point velocity statistics.It has been one of the central issues of turbulence research in the last decade.Single-point PDFs for the velocity and its derivatives are shown in Figs.5–7.A longer time period was necessary for the time average to obtain well-converged PDF for the ve-locity Q (u ).The distribution Q (u )is close to Gaussian,and its tail extends to very low values of the order of 10Ϫ10.Such values have not been reported in the literature.The Q (u )curve for R ϭ381is skewed negatively,but this is attributed to the insufficient time-averaging period ͑four large eddy turnover times ͒that was used.The overall trend is that Q (u )decays faster than a Gaussian distribution at large ampli-tudes.This behavior was also observed in one-dimensional decaying and forced Burgers turbulence.48,49Jime´nez has shown that the PDF Q (u )is slightly sub-Gaussian as the energy spectrum decays faster than k Ϫ1.50FIG.5.Variation of velocity PDF with the Reynoldsnumber.FIG.6.Variation of the longitudinal velocity derivative PDF with the Rey-noldsnumber.FIG.7.Variation of the transverse velocity derivative PDF with the Rey-nolds number.1069Phys.Fluids,Vol.14,No.3,March 2002Velocity field statistics in homogeneousThis is consistent with the present DNS results.Studies of the Q (u )tail predict that Q (w )ϰexp(Ϫc ͉w ͉3)when the forc-ing has a short correlation time.51,52Here,w ϭu /͗u 2͘1/2is the normalized velocity amplitude and c is a nondimensional constant.The asymptotic form of Q (u )was examined by plotting ln ͓Ϫln(Q (w )͔against ln ͉w ͉;however,the Q (w )tails were too short to determine the true asymptotic form.The PDF for the longitudinal velocity derivative is slightly skewed,as expected from the finite negative value of the skewness factor.The tail becomes longer as the Reynolds number increases.Figure 7shows that the PDF of the trans-verse derivative is symmetric and has a longer tail than the longitudinal derivative.There are many theories for the PDF of the velocity derivative.The asymptotic tail of Q (ץu /ץy )is presented in Fig.8,in which both the positive and negative sides are plotted by assuming that the PDF is symmetric.The tails gradually become longer as the Reynolds number increases;therefore,Q (s )is Reynolds-number dependent,and cannot be represented in a single stretched exponential form as Q (s )ϰexp(Ϫb ͉s ͉h ),where s is the normalized amplitude of ץu /ץy and b is a nondimensional constant that is a function of the Reynolds number.53V.ISOTROPYThe hypothesis of isotropy of the flow field is one of the key components of K41.There are various methods to ex-amine the degree of isotropy.One measure of isotropy can be obtained from the relations between the second and third order longitudinal and transverse velocity structure func-tions.These areD LL ϵ͗͑␦u r ͒2͘,D TT ϵ͗͑␦v r ͒2͘,͑18͒D LLL ϵ͗͑␦u r ͒3͘,D LTT ϵ͗␦u r ͑␦v r ͒2͘,͑19͒where␦u r ϵ͑u ͑x ϩr ͒Ϫu ͑x ͒͒•r /r ,͑20͒␦v r ϵ͑u ͑x ϩr ͒Ϫu ͑x ͒͒•͑I Ϫrr /r 2͒•e Ќ,͑21͒and e Ќis the unit vector perpendiculer to r ,and I is the unit tensor.Then the isotropy and incompressibility relations areD TT ͑r ͒ϭD LL ͑r ͒ϩr 2dD LL ͑r ͒dr ,͑22͒D LTT ͑r ͒ϭ16ddrrD LLL ͑r ͒.͑23͒In DNS,the solenoidal property of the Fourier amplitude velocity vector u ͑k ͒is always satisfied to the level of nu-merical error,which is smaller than 10Ϫ15.Thus,the accu-racy of the above relations depends solely on the deviation from isotropy.The two sides of Eqs.͑22͒and ͑23͒are com-pared for R ϭ125,381,and 460in Figs.9and 10.The curves in the figures are divided by r 2/3and r ,respectively,and the vertical axes of the plots are linear.The thick lines represent the left hand sides of Eqs.͑22͒and ͑23͒,and the thin lines correspond to the right-hand sides.The isotropy of the second and third order moments is excellent for scales less than L /2.The difference at larger separations is caused by the anisotropy due to the small number of energy-containing Fourier modes.The curves for R ϭ381and460FIG.8.Variation of the asymptotic tail of the transverse velocity derivative PDF with the Reynolds number.Both positive and negative sides are plot-ted.The rightmost curve corresponds to R ϭ460.FIG.9.Isotropy relation at the second order.Thin line:D TT (r )r Ϫ2/3,thick line:(D LL (r )ϩ(r /2)(dD LL (r )/dr ))r Ϫ2/3.L /and /are shown for R ϭ460.FIG.10.Isotropy relation at the third order.Thin line:D LTT (r )r Ϫ1,thick line:((1/6)(d /dr )rD LLL (r ))r Ϫ1.L /and /are shown for R ϭ460.1070Phys.Fluids,Vol.14,No.3,March 2002Gotoh,Fukayama,and Nakanoin Fig.9are not horizontal,suggesting that the second order structure function does not scale as r 2/3.The scaling expo-nents will be examined later in this paper.The isotropic re-lations,such as D 1122ϭD 1133and D 2222ϭ3D 2233ϭD 3333,and Hill’s higher order relations were not computed.54VI.KA´RMA ´N–HOWARTH–KOLMOGOROV EQUATION The energy budget for various scales is described by the Ka´rma ´n–Howarth–Kolmogorov ͑KHK ͒equation,45⑀¯r ϭϪD LLL ϩ6ץD LL ץrϩZ ͑24͒for steady turbulence,4,55,56where Z (r )denotes contributions due to the external force given by Z ͑r ,t ͒ϭ͵Ϫϱt͗␦f ͑r ,t ͒•␦f ͑r ,s ͒͘dsϭ12r͵0ϱͩ115ϩsin kr ͑kr ͒3ϩ3cos kr ͑kr ͒4Ϫ3sin kr ͑kr ͒5ͪF ͑k ͒dk .͑25͒Since the external force spectrum F (k )is localized in arange of low wave numbers,the asymptotic form of Z (r )for small separations is given asZ ͑r ͒ϭ235⑀¯in k f 2r 3,k f 2ϵ͐0ϱk 2F ͑k ͒dk͐0ϱF ͑k ͒dk.͑26͒A generalized Ka´rma ´n–Howarth–Kolmogorov equation has also been derived:57–6343⑀¯r ϭϪ͑D LLL ϩ2D LTT ͒ϩ2ץץr͑D LL ϩ2D TT ͒ϩW ,͑27͒where W ͑r ͒ϭ4r͵0ϱͩ13ϩcos kr ͑kr ͒2Ϫsin kr͑kr ͒3ͪF ͑k ͒dk ,Ϸ215⑀¯in r 3k f 2for ͉k f r ͉Ӷ1.͑28͒Equation ͑24͒is recovered by substituting Eqs.͑22͒and ͑23͒into Eq.͑27͒.Figure 11shows the results obtained when each term of Eq.͑24͒is divided by ⑀¯r for R ϭ460.Curves in which r /is larger than r /ϭ1200are not shown,because the sign of D LLL changes.A thin horizontal line indicates the Kolmog-orov value 4/5.When the separation distance decreases,the effect of the large scale forcing used in the present DNS decreases quickly,while the viscous term grows gradually.The third order longitudinal structure function D LLL quickly rises to the Kolmogorov value,remains there over the iner-tial range ͑between r /Ϸ50and 300͒,and then decreases.In the inertial range,the force term decreases as r 3according to Eq.͑26͒,while the viscous term increases as r 2Ϫ1(2Ͻ1)when r decreases.͓Since each term in the figure is divided by (⑀¯r ),the slope of each curve is 2and 2Ϫ2,respectively.͔The sum of the three terms in the right hand side of Eq.͑24͒divided by ⑀¯r is close to 4/5,the Kolmogorov value.The deviation of the sum from the 4/5law at the smallest scales is due to the slightly lower resolution of the data at these scales ͑k max is close to one ͒.At larger scales greater than r /ϭ700,the deviation is caused by the finiteness oftheFIG.11.Terms in the Ka´rma ´n–Howarth–Kolmogorov equation when R ϭ460.Thin solid line:4/5.FIG.12.Kolmogorov’s 4/5law.L /and /are shown for R ϭ460.The maximum values of the curves are 0.665,0.771,0.781,and 0.757for R ϭ125,284,381,and 460,respectively.FIG.13.Terms in the generalized Ka´rma ´n–Howarth–Kolmogorov equation for R ϭ460.Thin solid line:4/3.1071Phys.Fluids,Vol.14,No.3,March 2002Velocity field statistics in homogeneousensemble,which indicates the persistent anisotropy of the larger scales.The above findings are consistent with the cur-rent knowledge of turbulence developed since Kolmogorov,although confirmation of some aspects of turbulence using actual data is new from both a numerical and experimental point of view.56,59–65It is interesting and important to observe when the Kol-mogorov 4/5law is satisfied as the Reynolds numberincreases.6,66–69Figure 12shows curves of ϪD LLL (r )/(⑀¯r )for various Reynolds numbers.In this figure,the 4/5law applies when the curves are horizontal.The portion of the curves in which r /Ͼ1200is not shown.Although there is a small but finite horizontal range when R Ͼ284,the level of the plateau is still less than the Kolmogorov value.The maximum values of the curves are 0.665,0.771,0.781,and 0.757for R ϭ125,284,381,and 460,respectively.The value 0.781for R ϭ381is 2.5%less than 0.8.An asymptotic state is approached slowly,which is consistent with recent studies.However,the asymptote is approached faster than predicted by the theoretical estimate.66,69Theslow approach is due to the fact that D LLL (r )is the third order structure function and most positive contributions are canceled by negative ones.Thus only the slight asymmetry of the ␦u r PDF contributes to D LLL .The level of the plateau of the R ϭ460curve is slightly less than the others.A higher value would be expected if the time average period used for the R ϭ460run were longer.The generalized Ka´rma ´n–Howarth–Kolmogorov equa-tion Eq.͑27͒is also examined in a similar fashion.Figure 13shows each term of the equation divided by ⑀¯r ;a horizontal line indicates the 4/3law.The agreement between the present data and theory is satisfactory.The third order moment slowly approaches the Kolmogorov value 4/3,as shown in Fig.14.The maximum values of the curves of the 4/3law are 0.564,1.313,1.297,and 1.259for R ϭ125,284,381,and 460,respectively.VII.STRUCTURE FUNCTIONS AND SCALING EXPONENTSThe velocity structure functions are defined asS p L ͑r ͒ϭ͉͗␦u r ͉p͘,S p T ͑r ͒ϭ͉͗␦v r ͉p͘,FIG.14.Kolmogorov’s 4/3law.L /and /are shown for R ϭ460.The maximum values of the curves for the 4/3law are 0.564,1.313,1.297,and 1.259for R ϭ125,284,381,and 460,respectively.FIG.15.Variation of the ␦u r PDF with r for R ϭ381.From the outermostcurve,r n /ϭ2n Ϫ1dx /ϭ2.38ϫ2n Ϫ1,n ϭ1,...,10,where dx ϭ2/1024.The inertial range corresponds to n ϭ6,7,8.Dotted line:Gaussian.FIG.16.Variation of PDF for ␦v r with r at R ϭ381.The classification of curves is the same as in Fig.17.FIG.17.Convergence of the tenth order accumulated moments C 10(␦u r )at R ϭ381for various separations r n /ϭ2.38ϫ2n Ϫ1,n ϭ1,...,10.Curves are for n ϭ1,...10from the uppermost,and the inertial range corresponds to n ϭ6,7,8.1072Phys.Fluids,Vol.14,No.3,March 2002Gotoh,Fukayama,and Nakano。
海森伯格法则
J Supercond Nov Magn(2013)26:1451–1454DOI10.1007/s10948-012-2038-7O R I G I NA L PA P E RHeisenberg-Like Critical Properties and Magnetocaloric Effect in Lead Doped NdMnO3Single CrystalNilotpal GhoshReceived:4November2012/Accepted:1December2012/Published online:5January2013©Springer Science+Business Media New York2013Abstract Static magnetization for single crystals of Nd0.7Pb0.3MnO3has been studied around the ferromagnetic-to-paramagnetic transition temperature T C.The results of mea-surements carried out in the critical range|(T−T C)/T C|≤0.1are reported.The critical exponentsβandγfor thethermal behavior of magnetization and susceptibility havebeen obtained both from the modified Arrott plots and theKouvel–Fisher method.The exponentδ,independently ob-tained from the critical isotherm,was found to satisfy theWidom scaling relationδ=γ/β+1.The values of expo-nents are consistent with those expected for isotropic mag-nets belonging to the Heisenberg universality class withshort-range exchange in three dimensions.The maximummagnetic entropy change is found at around T C.We found auniversal scaling behavior in the relative change of magneticentropy( S M).The rescaled curves of the magnetic entropychange for different appliedfields are observed to collapseonto a single curve,which validates the second order natureof the phase transition in Nd0.7Pb0.3MnO3.Keywords Critical point phenomena·Magnetocaloriceffect·Universal scaling1IntroductionIn rare earth manganites,the most attractive phenomenonis the colossal magneto resistance(CMR)[1]which usu-ally appears at metal–insulator(MI)transition associatedN.Ghosh( )VIT University,Vellore,Tamilnadu,Indiae-mail:ghosh.nilotpal@N.Ghoshe-mail:nilotpal@vit.ac.in with ferromagnetic–paramagnetic(FM–PM)phase transi-tion.Hence,it is interesting to know how the interaction is renormalized near the critical point and which univer-sality class governs the magnetic phase transition.Criti-cal phenomena in the double exchange(DE)model have beenfirst described within mean-field theory[2].Later,Mo-tome and Furukawa[3]predicted that the FM–PM transi-tion in manganites should belong to the short-range Heisen-berg universality class.A number of experimental studies of critical phenomena and scaling laws across the FM–PM phase transition have been previously made on manganites [4].In this context,it should be mentioned that the FM–PM phase transition is also very important for the inves-tigation of the magnetocaloric effect(MCE)in rare earth manganites.MCE is connected to change of magnetic en-tropy( S M)and it is a parameter which achieves rela-tively high value at the PM to FM transition.The MCE is often determined for any material by measuring magnetic isotherms at different temperatures across the T C and by determining S M with the help of Maxwell relations.Re-cently,V.Franco et al.have described the universal behavior for S M in materials with a second order phase transition [5–7].Rare earth manganites(A1−x B x MnO3)are potential candidates for MCE.[8].In the perovskite manganite fam-ily,lead(Pb)doped NdMnO3is a comparatively less studied member[9,10].Nd1−x Pb x MnO3system shows a second order FM-to-PM phase transition and belongs to the univer-sality class of the three dimensional Heisenberg ferromagnet [11,12].In the present paper,we report precise estimation of the critical exponents and validity of scaling laws for an Nd0.7Pb0.3MnO3single crystal.We have reported the study of MCE from determination of magnetic entropy by record-ing the magnetization isotherms as a function of magnetic field.A universal scaling behavior in normalized magneticentropy( S M/ S peakM )with respect to rescaled temperature(θ)is also investigated.2ExperimentSingle crystals are grown by the high temperature solutiongrowth method using PbO/PbF2flux[10].The DC magne-tization measurement is carried out at H=0.3T by Quan-tum Design SQUID ter,extensive magne-tization data M(T,H)are collected in external static mag-neticfields H up to4.8T using the SQUID magnetometer[11,12].The sample has been measured in the temperaturerange135K≤T≤186K(T C∼148.5K)near the PM–FM phase transition with a step of1K.The M(T,H)ver-sus H data are corrected by a demagnetization factor thathas been determined by a standard procedure from low-fieldDC-susceptibility measurements[12].3Results and DiscussionsFigure1(a)shows the magnetic isotherms for Nd0.7Pb0.3MnO3over afield range0–4.8T at135–155K.It is seenthatFig.1(a)The magnetization isotherms of Nd0.7Pb0.3MnO3sin-gle crystal measured at temperatures between135and155K with 1K step.The inset shows magnetization as a function of tempera-ture for Nd0.7Pb0.3MnO3single crystal at0.3T.(b)Arrott plot of Nd0.7Pb0.3MnO3which shows that the system undergoes a second or-der phase transition the magnetization increases rapidly at the lowfield range ∼0.05T and then it increases steadily over thisfield.How-ever,the saturation is not achieved even at4.8T due to thepossible canted magnetic structure of Nd moments with re-spect to Mn sublattice[13].The inset shows the result ofmagnetization measurement as a function of temperature atH=0.3T.The FM-to-PM phase transition is clearly ob-served.According to the scaling hypothesis,a second-orderphase transition near the Curie point T C is characterized bya set of interrelated critical exponents,α,β,γ,δ,etc.,anda magnetic equation of state[11,12].The magnetic phasetransition has been analysed by means of the so-called Arrotplots(M2vs H/M)based on Landau theory of phase transi-tion(Fig.1(b)).The positive slope in Arrot plots means thatthe magnetic transition from the FM-to-PM phase is of thesecond order type[14].This also shows that the mean-fieldtheory does not describe the critical behavior for the presentsystem.Therefore,the magnetic phase transition is analysedwith the modified Arrott plots(Fig.2(a)).As trial values,we have chosenβ =0.365andγ =1.336,the critical ex-ponents of the3D Heisenberg model.As these plots resultin nearly straight lines,we have extracted spontaneous mag-netization M S(T)and inverse susceptibilityχ−10(T)fromthem.These values are plotted with respect to temperaturein Fig.2(b),and the continuous curves show the indepen-dent power lawfits to M S(T)andχ−10(T)[12].The valuesof T C obtained from thefits are close to the original value.Alternatively,the values of T C,βandγhave also been ob-tained by Kouvel–Fisher(KF)method(Fig.3(a))[12].TheFig.2(a)Modified Arrott plots with critical exponents of3D Heisenberg universality class.(b)Plots of M S(T)andχ−10(T)of Nd0.7Pb0.3MnO3Fig.3(a)Kouvel–Fisher plots(b)M S(T=T c,H)versus H plots ofNd1−x Pb x MnO3for x=0.3in log–log scale for Nd0.7Pb0.3MnO3value ofδhas been found directly by plotting M(T C,H)versus H on the log–log scale(Fig.3(b)).The critical ex-ponentsβ,γandδare related through the Widom ScalingRelation(δ=1+γ/β)which is verified with the values ob-tained from our measurements.In order to check whetherour data in the critical region obey the magnetic equationof state equation,M/εβas a function of H/εβ+γwhereε=T−T C/T C is plotted in Fig.4for Nd0.7Pb0.3MnO3.It can be clearly seen that all the points fall on two curves,one for T<T C and the other for T>T C.Thus the obtainedvalues of the critical exponents and T C are reliable and inagreement with the universal scaling hypothesis.The magnetic entropy change S M was calculated frommagnetization isotherms(see Fig.5(a))following the stan-dard procedure based on Maxwell equations[15,16].Fig-ure5(b)describes the variation of− S M with temperature(T)at1.2,2.2,and4.8T.The maximum of− S M is ob-served to appear at around T C,which is quite broad,indi-cating the second order transition.In order to study the uni-versal scaling behavior of S M,we have tofind a universalcurve.Hence,the peak entropy change, S peakM,has beentaken as reference in order to normalize S M(T,H)curvesforfinding equivalent points.For each value of the appliedfield,two reference temperatures T r1<T C and T r2>T C areselected.The collapse of the normalized curves ofentropyFig.4Scaled isotherms of Nd0.7Pb0.3MnO3below and above thetransition temperature usingβandγas defined in thetextFig.5(a)The magnetization isotherms of Nd0.7Pb0.3MnO3singlecrystal measured at temperatures between135and186K with1Kstep.(b)Magnetic entropy change(− S M)as a function of temper-ature at H=1.2,2.2,and4.8T for Nd0.7Pb0.3MnO3(Colorfigureonline)Fig.6Normalized entropy change ( S M / S peakM )as a function of the rescaled temperature (θ)for Nd 0.7Pb 0.3MnO 3.The existence of a universal curve shows that the phase transition is of second order (Color figure online)changes can be obtained by defining a new variable for the temperature axis,θ,given by the following expression [17]:θ=−(T −T C )/(T r 1−T C )T ≤T C ,−(T −T C )/(T r 2−T C )T >T C .(1)Figure 6describes the change of the normalized entropyS M / S peakM as a function of rescaled temperature θfor Nd 0.7Pb 0.3MnO 3.We have considered T r 1=T r 2=T rwhere S M / S peakM is approximately 0.74.It is observed that all the three experimental curves measured at 1.2,2.2,and 4.8T collapse onto a unique curve.The collapse of all these data into a unique curve in a wide range of temperature supports the validity of the second order phase transition and universal scaling for Nd 0.7Pb 0.3MnO 3.4ConclusionsWe have studied the magnetization property of Nd 0.7Pb 0.3MnO 3single crystal at low temperature.The magnetiza-tion measurement as a function of magnetic field up to 4.8T has been carried out at several constant tempera-tures around the T C .We have determined the critical expo-nents by modified Arrott plot and the K–F ing Maxwell’s relations,the magnetic entropy is calculated at H =1.2,2.2,and 4.8T.The maximum magnetic entropy change is observed at around T C .We have found a univer-sal scaling behavior in normalized S M as a function of rescaled temperature.Acknowledgements N.G.thanks the SFB 463Project funded by DFG for financial support during his work in IFW Dresden and Dr.K.Nenkov for measurements.References1.Coey,J.M.D.,Viret,M.,von Molnar,S.:Adv.Phys.48,167(1999)2.Kubo,K.,Ohata,N.:J.Phys.Soc.Jpn.33,21(1972)3.Motome,Y .,Furukawa,N.:J.Phys.Soc.Jpn.70,1487(2001)4.Ghosh,K.,Lobb,C.J.,Greene,R.L.,Karabashev,S.G.,Shulyatev,D.A.,Arsenov,A.A.,Mukovskii,Y .:Phys.Rev.Lett.81,4740(1998)5.Franco,V .,Blázquez,J.,Conde,A.:Appl.Phys.Lett.89,222512(2006)6.Dong,Q.Y .,Zhang,H.W.,Sun,J.R.,Shen,B.G.,Franco,V .:J.Appl.Phys.103,116101(2006)7.Franco,V .,Conde,C.,Blázquez,J.,Conde,A.:J.Appl.Phys.101,093903(2007)8.Phan,M.-H.,Yu,S.-C.:J.Magn.Magn.Mater.308,325(2007)9.Kusters,R.M.,Singleton,J.,Keen, D.A.,McGreevy,R.,Hayes,W.:Physica B 155,362(1989)10.Ghosh,N.,Elizabeth,S.,Bhat,H.L.,Subanna,G.N.,Sahana,M.:J.Magn.Magn.Mater.256,286(2003)11.Sahana,M.,Roessler,U.K.,Ghosh,N.,Elizabeth,S.,Bhat,H.L.,Doerr,K.,Eckert,D.,Wolf,M.:Phys.Rev.B 68,144408(2003)12.Ghosh,N.,Roessler,S.,Roessler,U.K.,Nenkov,K.,Elizabeth,S.,Bhat,H.L.,Doerr,K.,Mueller,K.-H.:J.Phys.Condens.Matter 18,557(2006)13.Ghosh,N.:J.Magn.Magn.Mater.323,405(2011)14.Banerjee,S.K.:Phys.Lett.12,16(1964)15.Amaral,J.S.,Amaral,V .S.:J.Magn.Magn.Mater.1552,322(2010)16.Pekala,M.,Pekala,K.,Drozd,V .,Fagnard,J.F.,Vanderbem-den,P.:J.Magn.Magn.Mater.322,3460(2010)17.Franco,V .,Conde,A.,Romero-Enrique,J.M.,Blazquez,J.S.:J.Phys.Condens.Matter 20,285207(2008)。
problems in physics with many scales of length
Physical systems as varied as magnets and fluids are ahke J'n having fluctuations in structure over a vast range of sizes. A novel method called the renormahzation group has been invented to explain them
O
temperature is raised. Near the criti cal point water develops fl u c tuations in density at all possible scales. The fl uctu ations take the form of drops of liq u i d thoro ughly interspersed with b u bbles of gas, and there are both drops and b u b bles of all sizes from single molecules up to the vol ume of the specimen. Precisely at the critical point the scale of the larg est fl uctuations becomes infinite, but the smaller fluctuations are in no way di minished . Any theory that describes wa ter near its critical point must take into account the entire spectrum of length scales. M ul tiple scales of length complicate many of the o utstanding problems in theoretical physics and in certain other fields of study. Exact solutions have been found for only a few of these prob lems, and for some others even the best known approximations are unsatisfac tory. In the past decade a new method called the renormalization group has been introduced for dealing with prob lems that have m ultiple scales of length . I t h a s by no means m a d e the problems e asy, b u t some that have resisted all oth er approaches may yield to this one. The renormalization group is not a descriptive theory of nature but a gener al method for constr ucting theories. It can be applied not only to a fluid at the critical point but also to a ferromagnetic material at the temperature where spon taneous magnetization first sets in, or to a mixture of l iquids at the temperat ure where they become fully miscible, or to
Ising spin glass under continuous-distribution random magnetic fields Tricritical points an
a r X i v :0804.1342v 1 [c o n d -m a t .s t a t -m e c h ] 8 A p r 2008Ising Spin Glass Under Continuous-Distribution Random Magnetic Fields:Tricritical Points and Instability LinesNuno Crokidakis ∗and Fernando D.Nobre †Centro Brasileiro de Pesquisas F´ısicasRua Xavier Sigaud 15022290-180Rio de Janeiro -RJ Brazil(Dated:April 8,2008)The effects of random magnetic fields are considered in an Ising spin-glass model defined in the limit of infinite-range interactions.The probability distribution for the random magnetic fields is a double Gaussian,which consists of two Gaussian distributions centered respectively,at +H 0and −H 0,presenting the same width σ.It is argued that such a distribution is more appropriate for a theoretical description of real systems than its simpler particular two well-known limits,namely the single Gaussian distribution (σ≫H 0),and the bimodal one (σ=0).The model is investigated by means of the replica method,and phase diagrams are obtained within the replica-symmetric solution.Critical frontiers exhibiting tricritical points occur for different values of σ,with the possibility of two tricritical points along the same critical frontier.To our knowledge,it is the first time that such a behavior is verified for a spin-glass model in the presence of a continuous-distribution random field,which represents a typical situation of a real system.The stability of the replica-symmetric solution is analyzed,and the usual Almeida-Thouless instability is verified for low temperatures.It is verified that,the higher-temperature tricritical point always appears in the region of stability of the replica-symmetric solution;a condition involving the parameters H 0and σ,for the occurrence of this tricritical point only,is obtained analytically.Some of our results are discussed in view of experimental measurements available in the literature.Keywords:Spin Glasses,Random-Field Systems,Replica Method,Almeida-Thouless Instability.PACS numbers:05.50+q,64.60.-i,75.10.Nr,75.50.LkI.INTRODUCTIONSpin-glass systems[1,2,3,4,5]continue to challenge many researchers in the area of magnetism.¿From the theoretical point of view,its simplest version defined in terms of Ising spin variables,the so-called Ising spin glass(ISG),represents one of the most fasci-nating problems in the physics of disordered magnets.The ISG mean-field solution,based on the infinite-range-interaction model,as proposed by Sherrington-Kirkpatrick(SK)[6], presents a quite nontrivial behavior.The correct low-temperature solution of the SK model is defined in terms of a continuous order-parameter function[7](i.e.,an infinite number of order parameters)associated with many low-energy states,a procedure which is usually denominated as replica-symmetry breaking(RSB).Furthermore,a transition in the presence of an external magneticfield,known as the Almeida-Thouless(AT)line[8], is found in the solution of the SK model:such a line separates a low-temperature region, characterized by RSB,from a high-temperature one,where a simple one-parameter solu-tion,denominated as replica-symmetric(RS)solution,is stable.The validity of the results of the SK model for the description of more realistic systems,characterized by short-range-interactions,represents a very polemic question[5].Recent numerical simulations claim the absence of an AT line in the three-dimensional short-range ISG[9],as well as along the non-mean-field region of a one-dimensional ISG characterized by long-range interactions [10].However,these results,obtained with rather small lattice-size simulations,do not rule out the possibility of a crossover to a different scenario at much larger lattice sizes, or also for smallerfields(and/or temperatures).One candidate for alternative theory to the SK model is the droplet model[11],based on domain-wall renormalization-group arguments for spin glasses[12,13].According to the droplet model,the low-temperature phase of anyfinite-dimensional∗E-mail address:nuno@cbpf.br†Corresponding author:E-mail address:fdnobre@cbpf.bra single thermodynamic state(together,of course,with its corresponding time-reversed counterpart),i.e.,essentially a RS-type of solution.Many important features of the ISG still deserve an appropriate understanding within the droplet-model scenario,and in par-ticular,the validity of this model becomes questionable for increasing dimensionalities, where one expects the existence of afinite upper critical dimension,above which the mean-field picture should prevail.Some diluted antiferromagnets,like Fe x Zn1−x F2,Fe x Mg1−x Cl2and Mn x Zn1−x F2,have been the object of extensive experimental research,due to their intriguing properties [14].These systems are able to exhibit,within certain concentration ranges,random-field,spin-glass or both behaviors,and in particular,the compounds Fe x Zn1−x F2and Fe x Mg1−x Cl2are characterized by large crystal-field anisotropies,in such a way that they may be reasonably well-described in terms of Ising variables.Therefore,they are usually considered as good physical realizations of the random-field Ising model(RFIM),or also of an ISG.For the Fe x Zn1−x F2,one gets a RFIM-like behavior for x>0.42,an ISG for x∼0.25,whereas for intermediate concentrations(0.25<x<0.42)one may observe both behaviors depending on the magnitude of the applied external magneticfield[RFIM (ISG)for small(large)magneticfields],with a crossover between them[15,16,17].In what concerns Fe x Mg1−x Cl2,one gets an ISG-like behavior for x<0.55,whereas for0.7< x<1.0one has a typical RFIM with afirst-order transition turning into a continuous one due to a change in the randomfields[14,18,19].Even though a lot of experimental data is available for these systems,they still deserve an appropriate understanding,with only a few theoretical models proposed for that purpose[20,21,22,23,24,25,26,27]. Within the numerical-simulation technique,one has tried to take into account the basic microscopic ingredients of such systems[20,21,22,23],whereas at the mean-field level, a joint study of both ISG and RFIM models has been shown to be a very promising approach[24,25,26,27].In the present work we investigate the effects of random magneticfields,following a continuous probability distribution,in an ISG model.The model is considered in the limit of infinite-range interactions,and the probability distribution for the random mag-neticfields is a double Gaussian,which consists of a sum of two independent Gaussian distributions.Such a distribution interpolates between the bimodal and the simple Gaus-sian distributions,which are known to present distinct low-temperature critical behavior, within the mean-field limit[24,25,26,27].It is argued that this distribution is more appropriate for a theoretical description of diluted antiferromagnets than the bimodal and Gaussian distributions.In particular,for given ranges of parameters,this distribu-tion presents two peaks,and satisfies the requirement of effective randomfields varying in both sign and magnitude,which comes out naturally in the identification of the RFIM with diluted antiferromagnets in the presence of a uniformfield[28,29];this condition is not fulfilled by simple discrete probability distributions,e.g.,the bimodal one,which is certainly very convenient from the theoretical point of view.Recently,the use a double-Gaussian distribution in the RFIM[30]yielded interesting results,leading to a candidate model to describe the change of afirst-order transition into a continuous one that occurs in Fe x Mg1−x Cl2[14,18,19].The use of this distribution in the study of the present model should be relevant for Fe x Mg1−x Cl2with concentrations x<0.55,where the ISG behavior shows up.In the next section we study the SK model in the presence of the above-mentioned random magneticfields;a rich critical behavior is presented,and in par-ticular,onefinds a critical frontier that may present one,or even two,tricritical points. The instabilities of the RS solution are also investigated,and AT lines presenting an in-flection point,in concordance with those measured in some diluted antiferromagnets,are obtained.Finally,in section4we present our conclusions.II.THE ISING SPIN GLASS IN THE PRESENCE OF A RANDOM-FIELDThe infinite-range-interaction Ising spin-glass model,in the presence of an external random magneticfield,may be defined in terms of the HamiltonianH=− (i,j)J ij S i S j− i H i S i,(1) where the sum (i,j)applies to all distinct pairs of spins S i=±1(i=1,2,...,N).The interactions{J ij}and thefields{H i}follow independent probability distributions,FIG.1:The probability distribution of Eq.(3)(the randomfields are scaled in units ofσ)for typical values of the ratio H0/σ:(a)(H0/σ)=1/3,1,5/2;(b)(H0/σ)=10.P(J ij)= N2J2 J ij−J0+exp −(H i+H0)22 12σ2[F({J ij,H i})]J,H= (i,j)[dJ ij P(J ij)] i[dH i P(H i)]F({J ij,H i}).(4) Now,one can make use of the replica method[1,2,3,4]in order to obtain the free energy per spin,−βf=lim N→∞1Nn([Z n]J,H−1),(5)where Z n represents the partition function of the replicated system andβ=1/(kT). Standart calculations lead toβf=−(βJ)22+limn→012 α(mα)2+(βJ)22ln Trαexp(H+eff)−12<Sα>++12<Sαβ>++1where <>±indicate thermal averages with respect to the “effective Hamiltonians”H ±effin Eq.(8).Assuming the RS ansatz [1,2,3,4],i.e.,m α=m (∀α)and q αβ=q [∀(αβ)],Eqs.(6)–(10)yieldβf =−(βJ )22m 2−1√212π ∞∞dze −z 2/2ln(2cosh ξ−),(11)m =1√212π +∞−∞dze −z 2/2tanh ξ−,(12)q =1√212π +∞−∞dze −z 2/2tanh 2ξ−,(13)whereξ±=β{J 0m +JGz ±H 0},(14)G = q + σJ 2=1√212π +∞−∞dze −z 2/2sech 4ξ−.(16)Let us now present the phase diagrams of this model.Since the random field induces the parameter q ,there is no spontaneous spin-glass order,like the one found in the SK model.However,there is a phase transition related to the magnetization m ,in such a waythat two phases are possible within the RS solution,namely,the Ferromagnetic (m =0,q =0)and the Independent (m =0,q =0)ones.The critical frontier separating these two phases is obtained by solving the equilibrium conditions,Eqs.(12)and (13),whereasinthecase of first-order phase transitions,the free energy per spin,Eq.(11),will be analyzed.Expanding the magnetization [Eq.(12)]in power series,m =A 1(q )m +A 3(q )m 3+A 5(q )m 5+O (m 7),(17)whereA 1(q )=βJ 0{1−ρ1(q )},(18)A 3(q )=−(βJ 0)315{2−17ρ1(q )+30ρ2(q )−15ρ3(q )},(20)andρk (q )=12π +∞−∞dze −z 2/2tanh 2k βJGz +H 01−(βJ )2Γm 2+O (m 4),(22)with Γ=1−4ρ1(q 0)+3ρ2(q 0),(23)where q 0corresponds to the solution of Eq.(13)for m =0.Substituting Eq.(22)in the expansion of Eq.(17),one obtains the m -independent coefficients in the power expansionof the magnetization;in terms of the lowest-order coefficients,one gets,m=A′1m+A′3m3+O(m5),(24)A′1=A1(q0),(25)A′3=−(βJ0)31−(βJ)2Γ Γ.(26)The associated critical frontier is determined through the standard procedure,taking into account the spin-glass order parameter[Eq.(13)],as well.For continuous transitions, A′1=1,with A′3<0,in such a way that one has to solve numerically the equation A′1=1,together with Eq.(13)considering m=0.If A′3>0,one may havefirst-order phase transitions,characterized by a discontinuity in the magnetization;in this case,the critical frontier is found through a Maxwell construction,i.e.,by equating the free energies of the two phases,which should be solved numerically together with Eqs.(12)and(13) for each side of the critical line.When both types of phase transitions are present,the continuous andfirst-order critical frontiers meet at a tricritical point that defines the limit of validity of the series expansion.The location of such a point is determined by solving numerically equations A′1=1,A′3=0,and Eq.(13)with m=0[provided that the coefficient of the next-order term in the expansion of Eq.(24)is negative,i.e.,A′5<0].Considering the above-mentioned phases,the AT instability of Eq.(16)splits each of them in two phases,in such a way that the phase diagram of this model may present four phases,that are usually classified as[24,25,26]:(i)Paramagnetic(P)(m=0;stability of the RS solution);(ii)Spin-Glass(SG)(m=0;instability of the RS solution);(iii) Ferromagnetic(F)(m=0;stability of the RS solution);(iv)Mixed Ferromagnetic(F′) (m=0;instability of the RS solution).Even though in most cases the AT line is computed numerically,for large values of J0[i.e.,J0>>J and J0>>H0]and low temperatures,one gets the following analytic asymptotic behavior,kT312π12J2G2 +exp−(J0−H0)2FIG.2:Phase diagrams of the infinite-range-interaction ISG in the presence of a double-Gaussian randomfield;the phases are labelled according to the definitions in the text.AT1and AT2 denote AT lines,and all variables are scaled in units of J.Two typical examples[(a)(σ/J)=0.2;(b)(σ/J)=0.6]are exhibited,for which there are single points(represented by black dots) characterized by A′1=1and A′3=0,defining the corresponding threshold values H(1)0(σ).For the particular caseσ=0,i.e.,the bimodal probability distribution for thefields [25],it was verified that the phase diagrams of the model change qualitatively and quan-titatively for incresing values of H0.Herein,we show that the phase diagrams of the present model change according to the parameters of the distribution of randomfields [Eq.(3)],which may modify drastically the critical line separating the regions with m=0 and m=0,defined by the coefficients in Eq.(24).In particular,onefinds numerically a threshold value,H(1)0(σ),for which this line presents a single point characterized by A′1=1and A′3=0;all other points of this line represent continuous phase transitions, characterized by A′1=1and A′3<0.Typical examples of this case are exhibited in Fig.2, for the dimensionless ratios(σ/J)=0.2and(σ/J)=0.6.As will be seen in the next figures,for values of H0/J slightly larger than H(1)0(σ)/J,this special point splits in two tricritical points,whereas for values of H0/J smaller than H(1)0(σ)/J,this critical frontier is completely continuous.Therefore,one may interpret the point for which H0=H(1)0(σ) as a collapse of two tricritical points.Such an unusual critical point is a characteristic of some infinite-range-interaction spin-glasses in the presence of random magneticfields [25,26],and to our knowledge,it has never been found in other magnetic models.¿From Fig.2,one notices that the threshold value H(1)0(σ)/J increases for increasing values ofσ/J,although the corresponding ratio H(1)0(σ)/σdecreases.Apart from that,this pecu-liar critical point always occurs very close to the onset of RSB;indeed,for(σ/J)=0.6, this point essentially coincides with the union of the two AT lines(AT1and AT2).At least for the range of ratiosσ/J investigated,this point never appeared below the AT lines,i.e.,in the region of RSB.Therefore,an analysis that takes into account RSB,will not modify the location of this point in these cases.In Fig.3we exhibit phase diagrams for afixed value ofσ(σ=0.2J),and increasing values of H0.In Fig.3(a)we show the case(H0/J)=0.5,where one sees a phase diagram that looks like,at least qualitatively,the one of the SK model;even though the random-field distribution[cf.Eq.(3)]is double-peaked(notice that(H0/σ)=2.5in this case),the effects of such afield are not sufficient for a qualitative change in the phase diagram of the model.As we have shown above[see Fig.2(a)],qualitative changes only occur in the corresponding phase diagram for a ratio(H(1)0(σ)/σ)≈5,or higher.It is important to remark that a tricritical point occurs in the corresponding RFIM for any (H0/σ)≥1[30],in agreement with former general analyses[31,32,33].If one associates the tricritical points that occur in the present model as reminiscents of the one in the RFIM,one notices that such effects appear attenuated in the present model due to the bond randomness,as predicted previously for short-range-interaction models[34,35].In Fig.3(b)we present the phase diagram for(H0/J)=0.993;in this case,one observes two finite-temperature tricritical points along the critical frontier that separates the regions with m=0and m=0.The higher-temperature point is located in the region where the RS approximation is stable,and so,it will not be affected by RSB effects;however,the lower-temperature tricritical point,found in the region of instability of the RS solution, may change under a RSB procedure.In Fig.3(c)we exhibit another interesting situation of the phase diagram of this model,for which the lower-temperature tricritical point goes down to zero temperature,defining a second threshold value,H(2)0(σ).This threshold value was calculated analytically,through a zero-temperature approach that follows below,for arbitrary values ofσ/J.Above such a threshold,only the higher-temperature tricritical point(located in the region of stability of the RS solution)exists;this is shown in Fig.3(d), where one considers a typical situation with H0>H(2)0(σ).It is important to notice that in Fig.3(d)the two AT lines clearly do not meet at the critical frontier that separates theFIG.3:Phase diagrams of the infinite-range-interaction ISG in the presence of a double-Gaussian randomfield with(σ/J)=0.2and typical values of H0/J;the phases are labelled according to the definitions in the text.AT1and AT2denote AT lines,and all variables are scaled in units of J.By increasing the value of H0/J,the phase diagram changes both qualitatively and quantitatively and,particularly,the critical lines separating the regions with m=0and m=0are modified;along these critical frontiers,the full(dotted)lines represent continuous (first-order)phase transitions and the black dots denote tricritical points;for the values of H0/J chosen,one has:(a)continuous phase transitions;(b)two tricritical points atfinite temperatures;(c)the lower tricritical point at zero temperature,defining the corresponding threshold value H(2)0(σ);(d)a single tricritical point atfinite temperatures.regions with m=0and m=0;such an effect is a consequence of the phase coexistence region,characteristic offirst-order phase transitions,and has already been observed in the SK model with a bimodal random-field distribution[25].The line AT1is valid up to the right end limit of the phase coexistence region,whereas AT2remains valid up to theFIG.4:Phase diagrams of the infinite-range-interaction ISG in the presence of a double-Gaussian randomfield with(σ/J)=0.6and typical values of H0/J;the phases are labelled according to the definitions in the text.AT1and AT2denote AT lines,and all variables are scaled in units of J.Along the critical lines separating the regions with m=0and m=0,the full(dotted)lines represent continuous(first-order)phase transitions and the black dots denote tricritical points; for the values of H0/J chosen,one has:(a)two tricritical points atfinite temperatures;(b)the lower tricritical point at zero temperature,defining the corresponding threshold value H(2)0(σ).left end limit of such a region;as a consequence of this,the lines AT1and AT2do not meet at the corresponding Independent-Ferromagnetic critical frontier.Additional phase diagrams are shown in Fig.4,where we exhibit two typical cases for the random-field width(σ/J)=0.6.In Fig.4(a)we show the equivalent of Fig.3(b), where two tricritical points appear atfinite temperatures;now one gets qualitatively a similar effect,but with a random-field distribution characterized by a smaller ratio H0/σ. From the quantitative point of view,the following changes occur,in the critical frontier Independent-Ferromagnetic,due to an increase inσ/J:(i)such a critical frontier moves to higher values of J0/J,leading to an enlargement of the Independent phase[corresponding to the region occupied by the P and SG phases of Fig.4(a)];(ii)the two tricritical points are shifted to lower temperatures.In Fig.4(b)we present the situation of a zero-temperature tricritical point,defining the corresponding threshold value H(2)0(σ);once again,one gets a physical situation similar to the one exhibited in Fig.3(c),but with a much smaller ratio H0/σ.Qualitatively similar effects may be also observed for other values ofσ,but with different threshold values,H(1)0(σ)and H(2)0(σ).We have noticedFIG.5:Evolution of the threshold values H(1)0(σ)(lower curve)and H(2)0(σ)(upper curve)with the widthσ(all variables are scaled in units of J).Three distinct regions(I,II,and III)are shown,concerning the existence of tricritical points andfirst-order phase transitions along the Independent-Ferromagnetic critical frontier.The dashed straight line corresponds to H0=σ, above which one has a tricritical point in the corresponding RFIM[30].that such threshold values increase withσ/J,even though one requires less-pronounced double-peaked distributions[i.e.,smaller values for the ratios H0/σ]in such a way to get significant changes in the standard SK model phase diagrams[as can be seen in Figs.2, 3(c),and4(b)].The evolution of the threshold values H(1)0(σ)and H(2)0(σ)with the dimensionless widthσ/J is exhibited in Fig.5.One notices three distinct regions in what concerns the existence of tricritical points andfirst-order phase transitions along the Independent-Ferromagnetic critical frontier.Throughout region I[defined for H0>H(2)0(σ)]afirst-order phase transition occurs atfinite temperatures and reaches the zero-temperature axis;a single tricritical point is found atfinite temperatures[a typical example is shown in Fig.3(d)].In region II[defined for H(1)0(σ)<H0<H(2)0(σ)]onefinds twofinite-temperature tricritical points,with afirst-order line between them[typical examples are exhibited in Figs.3(b)and4(a)].Along region III[H0<H(1)0(σ)]one has a completely continuous Independent-Ferromagnetic critical frontier[like in Fig.3(a)].The dashed straight line corresponds to H0=σ,which represents the threshold for the existence of a tricritical point in the corresponding RFIM[30].Hence,if one associates the occurrenceFIG.6:The zero-temperature phase diagram H0versus J0(in units of J)for two typical values of the dimensionless widthσ/J.The critical frontiers separating the phases SG and F′is continuous for small values of H0/J(full lines)and becomefirst-order for higher values of H0/J(dotted lines);the black dots denote tricritical points.Although the two critical frontiers become very close near the tricritical points,they do not cross each other;the tricritical point located at a higher value of J0/J corresponds to the higher dimensionless widthσ/J.of tricritical points in the present model with those of the RFIM,one notices that such effects are attenuated due to the bond randomness,in agreement with Refs.[34,35]; herein,the bond randomness introduces a spin-glass order parameter,in such a way that one needs stronger values of H0/J for these tricritical points to occur.Let us now consider the phase diagram of the model at zero temperature;in this case, the spin-glass order parameter is trivial(q=1),in such a way that the free energy and magnetization become,f=−J02 erfJ0m+H02 −erf J0m−H02−J2πG0 exp −(J0m+H0)22J2G20 ,(28)m=1JG0√2erf J0m−H02 ,(29)whereG0= 1+ σ2G0 J02J2G20 ,(32)a3=12G30 J0G20H02J2G20 ,(33)a5=12G50 J0G40H0G20 H02J2G20 .(34)For[H0/(JG0)]2<1[i.e.,a3<0],we have a continuous critical frontier given by a1=1,J0π2J2G20 .(35) This continuous critical frontier ends at a tricritical point(a3=0),1J 2=1⇒H0J=1+ σJ= 2 1+ σFIG.7:Typical phase diagrams of the infinite-range-interaction ISG in the presence of a double-Gaussian randomfield with(σ/J)=0.4are compared with those already known for some particular parisons of qualitatively similar phase diagrams are presented,essentially in what concerns the critical frontier that separates the regions with m=0and m=0.(a) Phase diagrams for the single Gaussian[(H0/J)=0.0and(σ/J)=0.4]and the double Gaussian [(H0/J)=0.8and(σ/J)=0.4]distributions for the randomfields.(b)Phase diagrams for the bimodal[(H0/J)=0.9573]and the double Gaussian[(H0/J)=1.0447]distributions for the randomfields.(c)Phase diagrams for the bimodal[(H0/J)=0.97]and the double Gaussian [(H0/J)=1.055]distributions for the randomfields.(d)Phase diagrams for the bimodal [(H0/J)=1.0]and the double Gaussian[(H0/J)=1.077]distributions for the randomfields. The phases are labelled according to the definitions in the text.AT1and AT2denote AT lines, and all variables are scaled in units of J.FIG.8:Instabilities of the replica-symmetric solution of the infinite-range-interaction ISG(cases J0=0)in the presence of a double-Gaussian randomfield,for two typical values of distribution widths:(a)(σ/J)=0.2;(b)(σ/J)=0.6.In each case the AT line separates a region of RS from the one characterized by RSB(all variables are scaled in units of J).Hence,Eqs.(36)and(37)yield the coordinates of the tricritical point at zero temperature. In addition to that,the result of Eq.(36)corresponds to the exact threshold value H(2)0(σ) (as exhibited in Fig.5).The above results are represented in the zero-temperature phase diagram shown in Fig.6,where onefinds a single critical frontier separating the phases SG and F′.In order to illustrate that the present model is capable of reproducing qualitatively the phase diagrams of previous works,namely,the Ising spin glass in the presence of random fields following either a Gaussian[24],or a bimodal[25]probability distribution,in Fig.7 we compare typical results obtained for the Ising spin-glass model in the presence of a double Gaussian distribution characterized by(σ/J)=0.4with those already known for such particular cases.In these comparisons,we have chosen qualitatively similar phase diagrams,mainly taking into account the critical frontier that separates the regions with m=0and m=0.In Fig.7(a)we exhibit the phase diagram of the present model [(H0/J)=0.8]together with the one of an ISG in the presence of randomfields described by a single Gaussian distribution;both phase diagrams are qualitatively similar to the one of the standard SK model.In Fig.7(b)we present phase diagrams for the bimodal and double Gaussian distributions,at their corresponding threshold values,H(1)0(σ).Typical situations for the cases of the bimodal and double Gaussian distributions,where two tricritical points appear along the critical frontier that separates the regions with m=0and m=0,are shown in Fig.7(c).Phase diagrams for the bimodal and double Gaussian distributions,at their corresponding threshold values,H(2)0(σ),are presented in Fig.7(d).Next,we analyze the AT instability for J0=0;in this case,Eq.(16)may be written askT√J ,(38)which corresponds to the same instability found in the case of a single-Gaussian random field[24].In Fig.8we exhibit AT lines for two typical values of distribution widths;in each case the AT line separates a region of RS from the one characterized by RSB.One notices that the region associated with RSB gets reduced for increasing values ofσ;however,the most interesting aspect in these lines corresponds to an inflection point,which may be identified with the one that has been observed in the experimental equilibrium boundary of the compound Fe x Zn1−x F2[15,24].Up to now,this effect was believed to be explained only through the ISG in the presence of a single-Gaussian randomfield,for which the phase diagrams in the cases J0>0are much simpler,with all phase transitions being continuous, typically like those of the SK model.Herein,we have shown that an inflection point in the AT line may also occur in the present model,for which one has a wide variety of phase diagrams in the corresponding case J0>0,as exhibited above.Therefore,the present model would be appropriate for explaining a similar effect that may be also observed experimentally in diluted antiferromagnets characterized byfirst-order phase transitions, like Fe x Mg1−x Cl2.III.CONCLUSIONSWe have studied an Ising spin-glass model,in the limit of infinite-range interactions and in the presence of random magneticfields distributed according to a double-Gaussian probability distribution.Such a distribution contains,as particular limits,both the single-Gaussian and bimodal probability distributions.By varying the parameters of this distri-。
Universal Quantum Computation with the Exchange Interaction
a r X i v :q u a n t -p h /0005116v 2 23 M a y 2002Universal Quantum Computation with the Exchange InteractionD.P.DiVincenzo 1,D.Bacon 2,3,J.Kempe 2,4,5,G.Burkard 6,and K.B.Whaley 21IBM Research Division,TJ Watson Research Center,Yorktown Heights,NY 10598USA2Department of Chemistry,University of California,Berkeley,CA 94720USA3Department of Physics,University of California,Berkeley,CA 94720USA4Department of Mathematics,University of California,Berkeley,CA 94720USA 5´Ecole Nationale Superieure des T´e l´e communications,Paris,France 6Department of Physics and Astronomy,University of Basel,Klingelbergstrasse 82,CH-4056Basel,Switzerland Experimental implementations of quantum computer architectures are now being investigated in many different physical settings.The full set of require-ments that must be met to make quantum computing a reality in the laboratory [1]is daunting,involving capabilities well beyond the present state of the art.In this report we develop a significant simplification of these requirements that can be applied in many recent solid-state approaches,using quantum dots [2],and using donor-atom nuclear spins [3]or electron spins [4].In these approaches,the basic two-qubit quantum gate is generated by a tunable Heisenberg interaction (the Hamiltonian is H ij =J (t ) Si · S j between spins i and j ),while the one-qubit gates require the control of a local Zeeman fipared to the Heisenberg operation,the one-qubit operations are significantly slower and require substan-tially greater materials and device complexity,which may also contribute to increasing the decoherence rate.Here we introduce an explicit scheme in which the Heisenberg interaction alone suffices to exactly implement any quantum computer circuit,at a price of a factor of three in additional qubits and about a factor of ten in additional two-qubit operations.Even at this cost,the ability to eliminate the complexity of one-qubit operations should accelerate progress towards these solid-state implementations of quantum computation.The Heisenberg interaction has many attractive features[2,5]that have led to its being chosen as the fundamental two-qubit interaction in a large number of recent proposals:Its functional form is very accurate—deviations from the isotropic form of the interaction, arising only from relativistic corrections,can be very small in suitably chosen systems.It is a strong interaction,so that it should permit very fast gate operation,well into the GHz range for several of the proposals.At the same time,it is very short ranged,arising from the spatial overlap of electronic wavefunctions,so that it should be possible to have an on-offratio of many orders of magnitude.Unfortunately,the Heisenberg interaction by itself is not a universal gate[6],in the sense that it cannot generate any arbitrary unitary transformation on a collection of spin-1/2qubits.So,every proposal has supplemented the Heisenberg interaction with some other means of applying independent one-qubit gates(which can be thought of as time-dependent local magneticfields).But the need to add this capability to the device adds considerably to the complexity of the structures,by putting unprecedented demands on“g-factor”engineering of heterostructure materials[7,4],requiring that strong, inhomogeneous magneticfields be applied[2,5],or involving microwave manipulations of the spins that may be slow and may cause heating of the device[4].These added complexities may well exact a high cost,perhaps degrading the quantum coherence and clock rate of these devices by orders of magnitude.The reason that the Heisenberg interaction alone does not give a universal quantum gate is that it has too much symmetry:it commutes with the operatorsˆS2andˆS z(for the total spin angular momentum and its projection on the z axis),and therefore it can only rotate among states with the same S,S z quantum numbers.But by defining coded qubit states, ones for which the spin quantum numbers always remain the same,the Heisenberg interac-tion alone is universal[8–10],and single-spin operations and all their attendant difficulties can be avoided.Recent work has identified the coding required to accomplish this.Starting with early work that identified techniques for suppressing phase-loss mechanisms due to coupling with the environment[11–13],more recent studies have identified encodings that are completelyimmune from general collective decoherence,in which a single environmental degree of free-dom couples in the same way to all the spins in a block.These codes are referred to both as decoherence-free subspaces(and their generalization,the decoherence-free subsystems) [14,8,10],and also as noiseless subspaces and subsystems[15,16,9].The noiseless properties of these codes are not relevant to the present work;but they have the desired property that they consist of states with definite angular momentum quantum numbers.So,in principle,the problem has been solved:the Heisenberg interaction alone is uni-versal and can be used for quantum computation.However,a very practical question still remains:how great is the price that must be paid in return for eliminating single-spin op-erations?In particular,how many applications of the Heisenberg interaction are needed to complete some desired quantum gate operation?The only guidance provided by the exist-ing theory[8–10]comes from a theorem of Solovay and Kitaev[17–19],which states that “efficient”approximations exist:given a desired accuracy parameterǫ,the number N of exchange operations required goes like N≈K log c(1/ǫ),where c≈4and K is an unknown positive constant.However,this theorem provides very little useful practical guidance for experiment;it does not show how to obtain the desired approximating sequence of exchange operations,and,since K is unknown,it gives no clue of whether the number of operations needed for a practical accuracy parameter is10or10000.In the following we remedy these inadequacies by showing that the desired quantum logic operations can be obtained exactly using sequences of exchange interactions short enough to be of practical significance for upcoming experiments.In the scheme we analyze here,we use the smallest subspace with definite angular-momentum quantum numbers that can be used to encode a qubit;this subspace is made up of three spins.It should be noted[10]that in principle the overhead in spatial resources could be made arbitrarily small:asymptotically the rate of encoding into such noiseless subsystems converges to unity.The space of three-spin states with spin quantum numbers S=1/2, S z=+1/2is two dimensional and will serve to represent our coded qubit.A good explicitchoice for the basis states of this qubit are|0L =|S |↑ ,|1L = 1/3|T0 |↑ . Here|S =1/2(|↑↓ +|↓↑ )are triplet states of these two spins.For these states we have constructed an explicit exchange implementation of the basic circuit elements of quantum logic[6];in particular,we discuss how one obtains any coded one-qubit gate,and a specific two-qubit gate,the controlled NOT(cNOT).It is easy to understand how one-qubit gates are performed on a single three-spin block. We note that Hamiltonian H12generates a rotation U12=exp(i/¯h J S1· S2dt)which is just a z-axis rotation(in Bloch-sphere notation)on the coded qubit,while H23produces a rotation about an axis in the x-z plane,at an angle of120o from the z-axis.Since simultaneous application of H12and H23can generate a rotation around the x-axis,three steps of1D parallel operation(defined in Fig.1a)permit any one-qubit rotation,using the classic Euler-angle construction.In serial operation,wefind numerically that four steps are always adequate when only nearest-neighbor interactions are possible(eg,the sequence H12-H23-H12-H23shown in Fig.2a,with suitable interaction strengths),while three steps suffice if interactions can be turned on between any pair of spins(eg,H12-H23-H13,see Fig.2b).We have performed numerical searches for the implementation of two-qubit gates using a simple minimization algorithm.Much of the difficulty of these searches arises from the fact that while the four basis states|0L,1L |0L,1L have total spin quantum numbers S=1, S z=+1,the complete space with these quantum numbers for six spins has nine states,and exchanges involving these spins perform rotations in this full nine-dimensional space.So,for a given sequence,eg the one depicted in Fig.2c,one considers the resulting unitary evolution in this nine-dimensional Hilbert space as a function of the interaction times t1,t2,...t N.This unitary evolution can be expressed as a product U(t1,...,t N)=U N(t N)···U2(t2)U1(t1), where U n(t n)=exp(it n H i(n),j(n)/¯h).The objective of the algorithm is tofind a set of interaction times such that the total time evolution describes a cNOT gate in the four-dimensional logic subspace U(t1,...,t N)=U cNOT⊕A5.The matrix A5can be any unitary5×5matrix(consistent with U having a block diagonal form).The efficiency of our search is considerably improved by the use of two invariant functions m1,2(U)identified by Makhlin [20],which are the same for any pair of two-qubit gates that are identical up to one-qubit rotations.It is then adequate to use an algorithm that searches for local minima of the function f(t1,...,t N)= i(m i(U cNOT)−m i(U(t1,...,t N)))2with respect to t1,...t N(m i isunderstood only to act on the4×4logic subspace of U).Finding a minimum for which f=0identifies an implementation of cNOT(up to additional one-qubit gates,which are easy to identify[20])with the given sequence(i(n),j(n))n,i(n)=j(n)of exchange gates. If no minimum with f=0is found after many tries with different starting values(ideally mapping out all local minima),we have strong evidence(although not a mathematical proof) that the given sequence of exchange gates cannot generate cNOT.The optimal serial-operation solution is shown in Fig.2c.Note that by good fortune this solution happens to involve only nearest neighbors in the1D arrangement of Fig.1a.The circuit layout shown obviously has a high degree of symmetry;however,it does not appear possible to give the obtained solution in a closed form.(Of course,any gate sequence involving non-nearest neighbors can be converted to a local gate sequence by swapping the involved qubits,using the SWAP gate,until they are close;here however the minimal solution found does not require such manipulations.)We have also found(apparently) optimal numerical solutions for parallel operation mode.For the1D layout of Fig.1a, the simplest solution found involves8clock cycles with just8*4different interaction-time parameters(H12can always be zero in this implementation).For the2D parallel mode of Fig.1b,a solution was found using just7clock cycles(7*7interaction times).It is worthwhile to give a complete overview of how quantum computation would proceed in the present scheme.It should begin by setting all the computational qubits to the |0L state.This state is easily obtained using the exchange interaction:if a strong H12is turned on in each coded block and the temperature made lower than the strength J of the interaction,these two spins will equilibrate to their ground state,which is the singlet state. The third spin in the block should be in the|↑ state,which can be achieved by also placingthe entire system in a moderately strong magneticfield B,such that k B T<<gµB B<J. Then,computation can begin,with the one-and two-qubit gates implemented according to the schemes mentioned above.For thefinal qubit measurement,we note that determining whether the spins1and2of the block are in a singlet or a triplet suffices to perfectly distinguish[7]|0L from|1L (again,the state of the third spin does not enter).Thus,for example,the AC capacitance scheme for spin measurement proposed by Kane[3]is directly applicable to the coded-qubit measurement.There are several issues raised by this work that deserve further exploration.The S= 1/2,S z=+1/2three-spin states that we use are a subspace of a decoherence-free subsystem that has been suggested for use in quantum computing by exchange interactions[10,16].Use of this full subsystem,in which the coded qubit can be in any mixture of the S z=+1/2and the corresponding S z=−1/2states,would offer immunity from certain kinds of interactions with the environment,and would not require any magneticfield to be present,even for initialization of the qubits.In this modified approach,the implementation of one-qubit gates is unchanged,but the cNOT implementation must satisfy additional constraints–the action of the exchanges on both the S=1and the S=0six-spin subspaces must be considered.As a consequence,implementation of cNOT in serial operation is considerably more complex;our numerical studies have failed to identify an implementation(even a good approximate one)for sequences of up to36exchanges(cf.19in Fig.2c).On the other hand,we have found implementations using8clock cycles for1D and2D parallel operation (again for the1D case H12can be zero),so use of this larger Hilbert space may well be advantageous in some circumstances.Finally,we note that further work is needed on the performance of quantum error correc-tion within this scheme.Our logical qubits can be used directly within the error correction codes that have been shown to produce fault tolerant quantum computation[21].Spin de-coherence will primarily result in“leakage”errors,which would take our logical qubits into states of different angular momentum(eg,S=3/2).Our preliminary work indicates that, with small modifications,the conventional error correction circuits will not cause uncon-trolled propagation of leakage error.In addition,the general theory[22,21,8,10]shows that there exist sequences of exchange interactions which directly correct for leakage by swap-ping a fresh|0L into the coded qubit if leakage has occurred,and doing nothing otherwise; we have not yet identified numerically such a sequence.If fast measurements are possible, teleportation schemes can also be used in leakage correction.To summarize,the present results offer a new alternative route to the implementation of quantum computation.The tradeoffs are clear:for the price of a factor of three more devices,and about a factor of ten more clock cycles,the need for stringent control of magnetic fields applied to individual spins is dispensed with.We are hopeful that the newflexibility offered by these results will make easier the hard path to the implementation of quantum computation in the lab.REFERENCES[1]D.P.DiVincenzo,“The Physical Implementation of Quantum Computation,”quant-ph/0002077,prepared for Fortschritte der Physik special issue,Experimental Proposals for Quantum Computation,to be published.[2]D.Loss and D.P.DiVincenzo,“Quantum Computation with Quantum Dots,”Phys.Rev.A57,120-126(1998).[3]B.E.Kane,“A Silicon-Based Nuclear-Spin Quantum Computer,”Nature393,133-137(1998).[4]R.Vrijen et al.,“Electron-spin-resonance Transistors for Quantum Computing inSilicon-Germanium Heterostructures,”Phys.Rev.A62,012306(2000)(10pages). [5]G.Burkard, D.Loss and D.P.DiVincenzo,“Coupled Quantum Dots as QuantumGates,”Phys.Rev.B59,2070-2078(1999).[6]A.Barenco et al.,“Elementary Gates for Quantum Computation,”Phys.Rev.A52,3457-3467(1995).[7]D.P.DiVincenzo et al.,“Quantum Computation and Spin Electronics,”cond-mat/9911245,prepared for Quantum Mesoscopic Phenomena and Mesoscopic Devices in Microelectronics(eds.I.O.Kulik and R.Ellialtioglu,NATO ASI),to be published.[8]D.Bacon,J.Kempe,D.A.Lidar and K.B.Whaley,“Universal Fault-Tolerant Compu-tation on Decoherence-Free Subspaces,”Phys.Rev.Lett.85,1758-1761(2000).[9]L.Viola,E.Knill,and S.Lloyd,“Dynamical Generation of Noiseless Quantum Subsys-tems,”quant-ph/0002072.[10]J.Kempe,D.Bacon,D.A.Lidar and K.B.Whaley,“Theory of Decoherence-Free Fault-Tolerant Universal Quantum Compuation,”submitted to Physical Review A,quant-ph/0004064.[11]W.H.Zurek,“Environment-induced Superselection Rules,”Phys.Rev.D26,1862-1880(1982).[12]G.M.Palma,K.-A.Suominen and A.K.Ekert,“Quantum Computers and Dissipation,”Proc.Roy.Soc.London Ser.A452,567-584(1996).[13]L.-M Duan and G.-C.Guo,“Reducing Decoherence in Quantum-Computer Memorywith all Quantum Bits Coupling to the Same Environment,”Phys.Rev.A57,737-741 (1998).[14]D.A.Lidar,I.L.Chuang and K.B.Whaley,“Decoherence-Free Subspaces for QuantumComputation,”Phys.Rev.Lett.81,2594-2597(1998).[15]P.Zanardi and M.Rasetti,“Error Avoiding Quantum Codes,”Mod.Phys.Lett.B11,1085-1093(1997).[16]E.Knill,flamme and L.Viola,“Theory of Quantum Error Correction for GeneralNoise,”Phys.Rev.Lett.84,2525-2528(2000).[17]R.Solovay,unpublished manuscript,1995.[18]A.Y.Kitaev,“Quantum Computations:Algorithms and Error Correction,”Russ.Math.Surv.,52(6),1191-1249(1997).[19]M.A.Nielsen and I.L.Chuang,Quantum Computation and Quantum Information(Cambridge University Press,Cambridge,2000),Appendix3,“The Solovay-Kitaev The-orem”.[20]Y.Makhlin,“Nonlocal properties of two-qubits Gates and Mixed States and Optimiza-tion of Quantum Computations,”quant-ph/0002045.[21]J.Preskill,“Fault-Tolerant Quantum Computation,”in Introduction to Quantum Com-putation and Information(eds.H.-K.Lo,S.Popescu,and T.Spiller,World Scientific, 1998),p.213-269(quant-ph/9712048).[22]D.A.Lidar,D.Bacon,K.B.Whaley,“Concatenating Decoherence-Free Subspaces withQuantum Error Correcting Codes,”Phys.Rev.Lett.82,4556-4559(1999).Acknowledgments:DPD,DB,JK,and KBW acknowledge support from the National Security Agency(NSA)and the Advanced Research and Development Activity(ARDA). DPD also thanks the UCLA DARPA program on spin-resonance transistors for support, and is also grateful for the hospitality of D.Loss at the University of Basel,where much of this work was completed.JK also acknowledges support from the US National Science Foundation.The work of GB is supported in part by the Swiss National Science Foundation. Discussions with P.O.Boykin and B.M.Terhal are gratefully acknowledged.FIGURES123456qubit 1qubit 2a.b.FIG.1.Possible layouts of spin-1/2devices.a)One-dimensional layout.We consider two different assumptions about how the exchange interactions can be turned on and offin this layout: 1)At any given time each spin can be exchange-coupled to at most one other spin(we refer to this as“serial operation”in the text),2)All exchange interactions can be turned on simultaneously between any neighboring pair of spins in the line shown(“1D parallel operation”).b)Possible two-dimensional layout with interactions in a rectangular array.We imagine that any exchange interaction can be turned on between neighboring spins in this array(“2D parallel operation”).Of course other arrangements are possible,but these should be representative of the constraints that will be faced in actual device layouts.tan( t ) tan( t ) = -2t =0.410899(2)1t 1t 2t 2t 3t 3t 3t 2t 4t 5t 5t 5t 6t 7t 7t 7t 1t 3t 3t 3t =0.207110(20)2t =0.2775258(12)3t =0.640505(8)4t =0.414720(10)5t =0.147654(12)6t =0.813126(12)7123456123123a.c.1234123qubit 1qubit 2i ib.τττττττFIG.2.Circuits for implementing single-qubit and two-qubit rotations using serial operations.a)Single-qubit rotations by nearest-neighbor interactions.Four exchanges(double-headed arrows) with variable time parametersτi are always enough to perform any such rotation,one of the two possible layouts is shown.b)Non-nearest neighbor interactions.Only three interactions are needed, one of the possible layouts is shown.c)Circuit of19interactions that produce a cNOT between two coded qubits(up to one-qubit gates before and after).The durations of each interaction are given in units such that for t=1/2the rotation U ij=exp(iJt S i· S j/¯h)is a SWAP,interchanging the quantum states of the two spins i,j.The¯t i parameters are not independent,they are related to the t i s as indicated.The uncertainty of thefinal digits of these times are indicated in parentheses. With these uncertainties,the absolute inaccuracy of the matrix elements of the two-qubit gate rotations achieved is no greater than6×10−5.Furtherfine tuning of these time parameters would give the cNOT to any desired accuracy.In a practical implementation,the exchange couplings J(t)would be turned on and offsmoothly;then the time values given here provide a specification for the integrated value J(t)dt.The functional form of J(t)is irrelevant,but its integral mustbe controlled to the precision indicated.The numerical evidence is very strong that the solution shown here is essentially unique,so that no other choices of these times are possible,up to simple permutations and replacements t→1−t(note that for the Heisenberg interaction adding any integer to t results in the same rotation).The results also strongly suggest that this solution is optimal:no one of these19interactions can be removed,and no other circuit layout with fewer than 19has been found to give a solution.We have also sought,but not found,shorter implementations√of other interesting two-qubit gates like。
- 1、下载文档前请自行甄别文档内容的完整性,平台不提供额外的编辑、内容补充、找答案等附加服务。
- 2、"仅部分预览"的文档,不可在线预览部分如存在完整性等问题,可反馈申请退款(可完整预览的文档不适用该条件!)。
- 3、如文档侵犯您的权益,请联系客服反馈,我们会尽快为您处理(人工客服工作时间:9:00-18:30)。
a r X i v :c o n d -m a t /9906121v 1 [c o n d -m a t .d i s -n n ] 8 J u n 1999Universality in short-range Ising spin glassesE.Nogueira Jr.Instituto de F´ısica,Universidade Federal da Bahia,Campus Universit´a rio de Ondina,40210-340,Salvador,Bahia,BrazilS.CoutinhoLaborat´o rio de F´ısica Te´o rica e Computacional,Universidade Federal de Pernambuco,50670-901,Recife,Pernambuco,BrazilF.D.NobreDepartamento de F´ısica Te´o rica e Experimental,Universidade Federal do Rio Grande do Norte,Campus Universit´a rio,CP 1641,59072-970,Natal,Rio Grande do Norte,Brazil.E.M.F.Curado ∗Centro Brasileiro de Pesquisas F´ısicas,Rua Xavier Sigaud,150,22290-180,Rio de Janeiro,Brazil,(February 1,2008)The role of the distribution of coupling constants on the critical exponents of the short-range Ising spin-glass model is investigated via real space renormalization group.A saddle-point spin glass critical point characterized by a fixed-point distribution is found in an appropriated parameter space.The critical exponents βand νare directly estimated from the data of the local Edwards-Anderson order parameters for the model defined on a diamond hierarchical lattice of fractal di-mension d f =3.Four distinct initial distributions of coupling constants (Gaussian,bimodal,uniform and exponential)are considered;the results clearly indicate a universal behavior.Key Words:Spin glass,Critical exponents,Universality.The nature of the spin-glass (SG)transition on real systems remains a subject of controversies.There is no definite agreement among theories,numerical sim-ulations and experimental results,about the standard critical exponents governing the transition,as it occurs for pure and disordered spin systems without frustration.Different apparatus used to measure the non-linear sus-ceptibilities [1,2],distinct numerical procedures used in computational simulations [3–5]and the lack of an ex-act renormalization-group scheme to treat short-range spin-glass models in finite dimensions (d >1),produce a spread in the values of the critical exponents,lead-ing some authors to claim the absence of universality in the critical behavior of spin glasses [6].The most popular renormalization-group method used to investi-gate spin-glass models on finite hypercubic lattices [7]has been the so-called Migdal-Kadanoffscheme [8],which was proven to be exact,for pure systems,on a class of diamond hierarchical lattices (DHL)[9].Such a tech-nique has been valuable in the study of short-range spin glasses [7,10–14]and was used recently to investigate the nature of the low temperature phase for an Ising SG on a DHL [14].Usually,to treat the spin-glass prob-lem within a renormalization-group (RG)approach one has to choose arbitrarily an initial distribution of ex-change coupling constants.In the standard approach [7],the parameter space of the renormalization flow is one-dimensional and the corresponding renormalized quan-tity is the mean-square-root deviation of K ij =J ij /k B T ,where {J ij }are the random quenched nearest-neighbour coupling constants,k B is the Boltzmann constant and T is the temperature.For different chosen initial distribu-tions P ({K ij }),different critical temperatures and sets of critical exponents have been found either using the RG scheme or performing numerical simulations [6,10].In the present work,the role of the initial distribution on the critical properties of the Ising spin-glass model is investigated.We consider the short-range Ising spin glass defined on the DHL with fractal dimension d f =3,described by the Hamiltonian,H =−<i,j>J ij σi σj ,(1)where the σ’s represent the Ising variables assignedto the lattice sites and the sum is restricted to the nearest-neighbour sites.The evolution of the distri-butions,under the renormalization process,is anal-ysed in an appropriated higher-dimensional parame-ter space.A two-dimensional projection of this space is the plane <tanh 2(J ij /k B T )>versus k B T/<J 2ij >1/2.In this representation,each symmetric dis-tribution P ({J ij })is assigned to a curve defined by F P (T )=<tanh 2(J ij /k B T )>P ,where<...>P means an average over the distribution [11].This parameter space is separated in two regions,each one governed by its respective attractor,the spin-glass (1,0)and param-agnetic (0,∞)stable fixed points.The frontier separat-ing these regions is defined by the locus of F P (T P c ),T Pc being the critical temperature,above (below)which the flow evolves to the paramagnetic (spin glass)stable fixed point.Within this frontier,one finds the saddle-point spin-glass critical point,characterizing the ”fixed-point”distribution P ∗({K ij }),which should remain invariant under renormalization.In Figure 1,we display a realiza-tion of the flow diagram in the vicinity of the saddle-point spin-glass critical point,considering four initial distinct symmetric distributions,namely the Gaussian,bimodal,exponential and uniform distributions,P (J i,j )=12πexp(−12[δ(J i,j −1)+δ(J i,j +1)],P (J i,j )=12exp(−√2√3≤J i,j ≤√8of thetotal number of sites belong to the last generation,dif-ferent values of βappear,associated with the behavior of the system close to these critical points,suggesting a breaking of universality [10].To overcome this apparent breaking of universality,herein we estimate the critical exponents by calculating the temperature dependent EA order parameter close to the saddle-point spin-glass fixed point,taking into ac-count the ”fixed-point”distribution P ∗({K ij }).Since the exact analytical form of this distribution is unknown,these exponents can not be determined,unless one care-fully probes the critical region.For that,we monitored numerically the evolution of the coupling constant dis-tribution until it reaches the F ∗(T )curve at the vicinity of saddle-point spin-glass critical point.This is done by following the flow in the diagram <tanh 2(J ij /k B T )>versus k B T/<J 2ij >1/2and counting the number of steps until the flow reaches the F ∗(T )curve.For the present DHL this behaviour occurs after the fourth renormaliza-tion step,as can be seen in Figure 1.0.70.80.9 1.01.1k B T/<J ij 2>1/20.410.430.450.470.490.51<t a n h 2K i j >BimodalExponential Gaussian UniformFIG.1.The evolution of the probability distributions,un-der the renormalization process,in a two-dimensional space.From this point on,we apply the method developed in [12],calculating the local magnetization of each lattice site and the EA order-parameter,varying the tempera-ture and taking an average over many initial distribu-tion realizations (samples).The critical exponent associ-ated with the EA order parameter per spin is defined byq EA ∼[(T ∗c −T )/T ∗c ]βwhere T ∗c is the spin-glass critical temperature corresponding to the saddle-point spin-glass critical point.Moreover,the correlation-length critical exponent can be also estimated by scaling the order pa-rameter at T =T ∗c ,i.e.,Q EA ∼M β/νwhere M =b N +1,b being the scaling factor (herein we restrict ourselves to b =2)and N the number of lattice hierarchies.We con-sider the four above-mentioned distributions of coupling constants as the initial ones,evaluating the correspond-ing βcritical exponents in each case,for lattices up to fifteen generations and 200samples.To obtain the ratio β/νwe consider N varying from 8to 15and the number of samples varying from 1000(for smaller systems)to 300(larger systems).In Figure 2,we exhibit the plot of the EA order pa-rameter per spin as a function of the temperature for each case.Note that all plots fall onto the same curve within the errors bars.One notices that larger error bars are found as one gets away from the critical temperature T ∗c ,contrary to what happens in conventional numeri-cal simulations.This is due to the fact that our sample averages are taken over different initial conditions (i.e.,distinct pools of numbers associated to a given initial distribution [7]).0.60.70.8T cT0.00.10.20.3q EA Bimodal Exponential Gaussian Uniform0.60.70.8T CT0.40.5F (T)*FIG.2.The EA order parameter per spin as a functionof the temperature (in units k B =1),in the neighbourhoodof T ∗c .The inset shows points in the flow diagram were the values of q EA where calculated.Close to the critical point the distribution parameters (e.g.,its mean-square deviation)vary slowly and so are not very sensitive to such initial conditions,whereas awayfrom T ∗c ,different sets of numbers may lead to RG tra-jectories far apart in the parameters space.For temper-atures very close to the critical point,finite-size effects occur,preventing the vanishing of the order parameterat T ∗c ,while for low temperatures,numerical difficultiesgenerated by the considered algorithm avoid the reach of the saturated limit.The corresponding points in the flow diagram,indicating where the order parameter was calculated,all fall onto the F ∗(T )curve characterizing the spin-glass ”fixed-point”distribution,as shown in the inset of Figure 2.In Figure 3,we exhibit the log-log plot of the data in Figure 2.The results from distinct initial distributions all coincide within the error bars,indicating a universal behaviour for the βexponent.The scaling region used forthe computation of the βexponents was ln [(T ∗c −T )/T ∗c ]in the range from −4.0to −2.0;small variations in the width of this scaling region (e.g.,from −4.0to −1.5)did not change significantly our estimates (βremainig inside the error bars).A similar universal behavior is observed in Figure 4,where we exhibit the logarithm of Q EA as function of the hierarchical level N ,at the criticaltemperature T ∗c ,yielding the same β/νratio within the error bars.−6.0−5.0−4.0−3.0−2.0−1.00.0ln[(T C−T )/T C ]−4.0−3.0−2.0−1.00.0l n q E ABimodal Uniform Gaussian Exponential*scaling region*FIG.3.The log-log plot of the EA order parameter per spin in terms of the distance from the critical temperature T ∗c .One clearly sees a universal behaviour within the error bars.The values of the βexponents were computed from the points inside the scaling region shown.4.06.08.010.012.0N ln 2−4.5−3.5−2.5−1.5l n Q E ABimodal Exponential Gaussian UniformFIG.4.The logarithm of the EA order parameter per spin as a function of the hierarchical level,at the universalspin-glass critical temperature T ∗c .In Table 1,we exhibit the corresponding values of β,β/νand the estimated values of ν,corresponding to each initial distribution.We call the reader’s for the fact that these ”universal”values for the critical exponents are very close to the ones obtained by considering the Gaus-sian distribution asthe initialonewithinthe approach of reference [10].This is an expected result since the ”fixed-point”distribution is very close to the Gaussian one [10,11].This can also be seen in Figure 1by noting that the point corresponding to the Gaussian distributionat T P c ≃0.88is indeed very close to the curve F ∗(T ).TABLE I.The estimated values of the critical tempera-ture T P c for each initial distribution of coupling constants,theuniversal spin-glass critical temperature T ∗c ,and the critical exponents βand ν.The columns are disposed according to decreasing kurtosis of the corresponding initial distribution.Exponential GaussianUniformBimodal∗Also at International Centre of Condensed Matter Physics and Departamento de F ´ısica,Universidade de Bras ´ılia,C.P.04667,70919-970,Bras ´ılia,Brazil.[1]K.H.Fischer and J.A.Hertz,Spin Glasses (Cambridge University Press,Cambridge,1991).[2]A.V.Deryabin,V.K.Kazantsev and I.V.Zakharov,Sov.Phys.Solid State 30,129(1988).[3]R.N.Bhatt and A.P.Young,Phys.Rev.Lett.54924;(1985);A.T.Ogielski and I.Morgenstern,Phys.Rev.Lett.54,928(1985).[4]R.N.Bhatt and A.P.Young,Phys.Rev.B 37,5606(1988).[5]N.Kawashima and A.P.Young,Phys.Rev.B 53,R484(1996).[6]L.W.Bernardi,and I.A.Campbell,Phys.Rev.B 49,728(1994);52,12501(1995);Europhys.Lett.26,147(1994);L.W.Bernardi,S.Prakash and I.A.Campbell,Phys.Rev.Lett.77,2798(1996).[7]B.W.Southern and A.P.Young,J.Phys.C 10,2179(1977).[8]A.A.Migdal,Sov.Phys.JETP42,743(1975);L.P.Kadanoff,Ann.Phys.(New York)91,226(1975). [9]For a recent review on hierarchical lattices,see C.Tsallisand A.C.N.Magalh˜a es,Phys.Rep.268,305(1996). [10]E.Nogueira-Jr.,S.Coutinho,F.D.Nobre and E.M.F.Curado,Physica A257,365(1998).[11]E.M.F.Curado and J-L.Meunier,Physica A149,164(1988).[12]E.Nogueira-Jr,S.Coutinho,F.D.Nobre,E.M.F.Cu-rado and J.R.L.de Almeida,Phys.Rev.E55,3934 (1997).[13]S.Prakash and I.A.Campbell,Physica A235,507(1997).[14]M.A.Moore,H.Bokil and B.Drossel,Phys.Rev.Lett.81,4252(1998).[15]L.Klein,J.Adler,A.Aharony,A.B.Harris and Y.Meir,Phys.Rev.B32,11249(1991).。