
威廉夏普 投资学课后习题答案解析第九章
1. There are ten key assumptions underlying the CAPM:1. Investors evaluate portfolios by analyzing expected returns and standarddeviations over a one-period time horizon.2. Everything else equal, investors prefer portfolios with greater expectedreturns.3. Everything else equal, investors prefer portfolios with lower standarddeviations.4. Assets are infinitely divisible.5. Investors may borrow or lend at a single riskfree interest rate.6. Taxes and transaction costs are immaterial.7. All investors have the same one-period time horizon.8. All investors borrow and lend at the same riskfree rate.9. All investors have immediate and costless access to all relevant information.10. Investors possess homogeneous expectations regarding the expected returnsand risks of securities.3. The separation theorem states that an investor's optimal risky portfolio can bedetermined without reference to the investor's risk-return preferences.Assuming that every investor has the same expectations regarding expected returns and risks for available securities, and assuming that everyone faces the same riskfree rate, then the efficient set must be the same for all investors. This implies that every investor will hold the same risky portfolio. (That risky portfolio is represented by the point of tangency between a ray emanating from the riskfree asset and extending into risk-return space and tangent to the curved Markowitz efficient set.) The only difference in portfolios held by investors will be with respect to the amount of riskfree lending or borrowing undertaken, which will depend on the investors' individual risk-return preferences.6. If investors wish to hold more units of a security than are available, then they willbid up the price of the security, thereby reducing its expected return. The lower expected return will cause investors to reduce their desired holdings of the security.Conversely, if investors wish to hold fewer units of a security than are available, then they will bid down the security's price, thereby increasing its expected return.The higher expected return will cause investors to wish to hold more units of the security.This process will drive the price of the security toward its equilibrium value at which point the number of units investors wish to hold will equal the number of units outstanding. This equilibrating process will produce market clearing prices for all securities. Further, the riskfree rate will move to a level where the total amount of money borrowed will equal the supply of money available for lending.7. Investor does not require any adjustments by an investor in the market portfolio.Every security in the market portfolio is represented in proportion to its marketvalue relative to the market value of all securities. The market value of a security is the units of the security outstanding times the market price of the security. Thus as relative prices of securities change, their relative market values and therefore their proportions of the market portfolio change concomitantly. No adjustment is required on the part of the investor.10. The equation of the Capital Market Line (CML) is: r p = r f + [(r M - r f )/ M ]* pIn this case, the market portfolio is composed of two securities, A and B . Thus the expected return of the market portfolio is:r M = (X A ⨯ r A ) + (X B ⨯ r B )= (.40 ⨯ 10%) + (.60 ⨯ 15%)= 13.0%The standard deviation of the market portfolio is:[]2/122222B A AB B A B B A A M X X X X σσρσσσ++== {[(.40)² ⨯ (20)²] + [(.60)² ⨯ (28)²]+ [2 ⨯ (.40) ⨯ (.60) ⨯ (.30) ⨯ (20) ⨯ (28)]}½= [64 + 282.2 + 80.6]½ = 20.7%Therefore the equation for the CML is: r p = 5.0% + [(13.0% - 5.0%)/20.7%] ⨯ p= 5.0% + .39p12. The standard deviation of the market portfolio can be shown to equal the squareroot of the weighted average of the covariances of all its component securities with it. In the case of the this four security portfolio:M = [.20 ⨯ 242 + .30 ⨯ 360 + .20 ⨯ 155 + .30 ⨯ 210]½= (250.4)½ = 15.8%14. According to the CAPM, all investors will hold the market portfolio combinedwith riskfree borrowing or lending. Therefore all investors will be concerned with the risk (or standard deviation) of the market portfolio. The standard deviation of the market portfolio can be shown to be a function of the covariances with it of each of the securities that make up the market portfolio. Therefore the contribution that each security makes to the market portfolio's risk will be directly related to its covariance with the market portfolio. Risk averse investors will demand higher returns from securities exhibiting higher covariances with the market portfolio.15. With respect to risk, the investor ultimately is concerned with the standarddeviation of his or her portfolio. Therefore, in evaluating a well-diversified portfolio, the relevant measure of risk is standard deviation. However, the contribution of an individual security to a portfolio's standard deviation is not the standard deviation of the security. That is, a portfolio's standard deviation is not simply the weighted average of the standard deviations of the component securities. The appropriate measure of a security's risk is the contribution that it makes to the standard deviation of a well-diversified portfolio. That contribution is reflected in the security's covariance with the portfolio.18. Oil is incorrect. The CAPM implies that it is possible for a security to have apositive standard deviation and an expected return less than the riskfree rate. The CAPM relationship specifies that: r p = r f + (r M - r f ) iM Thus a security with a negative covariance with the market portfolio would havean expected return less than the riskfree rate. In practice, however, few, if any, securities have a negative covariances with surrogates for the market portfolio.19. The beta of a security is calculated as:βσσi iM M =2Therefore:βA ==292151302.βB ==180150802. βC ==225151002.20. The beta of a portfolio is given by:ββp i i i n X ==∑1In Kitty's case:ßp = (.30 ⨯ .90) + (.10 ⨯ 1.30) + (.60 ⨯ 1.05)= 1.0322. a.b. r i = r f + (r M - r f )βi= 6% + (10% - 6%)ßi= 6% + (4%)ßi c. r A = 6% + (4%)(.85)= 9.4% r B= 6% + (4%)(1.20) = 10.8%24. A security that plots above the SML would be considered an attractive investment.The expected return offered by such a security is greater than that required given its risk. Investors should wish to add such a security to their portfolios.26. Market (or systematic) risk is the portion of a security's total risk that is related tomovements in the market portfolio and hence to the beta of the security. By definition, because the market portfolio is perfectly diversified, market risk in a portfolio cannot be reduced through diversification.Nonmarket (or unique or unsystematic) risk is the portion of a security's total riskthat is not related to moves in the market portfolio. Rather, it is related to events specific to the security. As a result, unique risk in a portfolio can be reduced through diversification.28. Two relationships are necessary to identify the missing data in the table:(1) r i = r f + (r M - r f )βi61218240.000.50 1.00 1.50 2.00E x p e c t e d R e t u r n (%)Beta R f =(2) ()2222i M p i εσσβσ+= Using these equations, consider security D first: 7.0 = r f + (r M - r f ) ⨯ 0 r f = 7.0% Next consider security B : 19.0 = 7.0 + (r M - 7.0) ⨯ 1.5 r M = 15.0% Next consider security C : 15.0 = 7.0 + (15.0 - 7.0) ßC ßC = 1.0 Further: (12)² = (1.0)² ⨯ σM 2 + 0 σM 2 = 12% Next consider security A : r A = 7.0 + (15.0 - 7.0)(.8) r A = 13.4% Further: A = [(.8)² ⨯ (12)² + 81]½ = 13.2% Returning to security B : B = [(1.5)² ⨯ (12)² + 36]½ = 19.0% Finally, consider security E : 16.6 = 7.0 + (15.0 - 7.0) ßE ßE = 1.2 Further: (15)² = (1.2)² ⨯ (12)² + 2i εσ 2i εσ = 17.6。
投资学第9章习题及答案

本章习题1.简述利率敏感性的六个特征。
2.简述久期的法则。
3.凸性和价格波动之间有着怎样的关系?4.简述可赎回债券与不可赎回债券的凸性之间的区别。
5.简述负债管理策略中免疫策略的局限性。
6.简述积极的债券投资组合管理中互换策略的主要类型。
7.一种收益率为10%的9年期债券,久期为7.194年。
如果市场收益率改变50个基点,则债券价格变化的百分比是多少?8.某种半年付息的债券,其利率为8%,收益率为8%,期限为15年,麦考利久期为10年。
(1)利用上述信息,计算修正久期。
(2)解释为什么修正久期是计算债券利率敏感性的较好方法。
(3)确定修正久期变动的方向,如果:a.息票率为4%,而不是8%b.到期期限为7年而不是15年。
(4)说明在给定利率变化的情况下,修正久期与凸性是怎样用来估计债券价格变动的?第九章本章习题答案1. 在市场利率中,债券价格的敏感性变化对投资者而言显然十分重要。
为了了解利率风险的决定因素,可以参见图9-1。
该图表示四种债券价格相对于到期收益变化的变化百分比,它们有不同的息票率、初始到期收益率以及到期时间。
这四种债券的情况表明,当收益增加时,债券价格下降;价格曲线是凸的,这意味着收益下降对价格的影响远远大于等规模的收益增加。
通过观察,可以得出以下两个特征:(1)债券价格与收益呈反比,即:当收益升高时,债券价格下降;当收益上升时,债券价格上升。
(2)债券的到期收益升高会导致其价格变化幅度小于等规模的收益下降。
比较债券A和B的利率敏感性,除到期时间外,其他情况均基本相同。
图9-1表明债券B比债券A期限更长,对利率更敏感。
这体现出其另一特征:(3)长期债券价格对利率变化的敏感性比短期债券更高。
这不足为奇,例如,如果利率上涨,则当前贴现率较高,债券的价值下降。
由于利率适用于更多种类的远期现金流,则较高的贴现率的影响会更大。
值得注意的是,当债券B的期限是债券A的期限的6倍的时候,它的利率敏感性低于6倍。
投资学习题答案完整版机工版
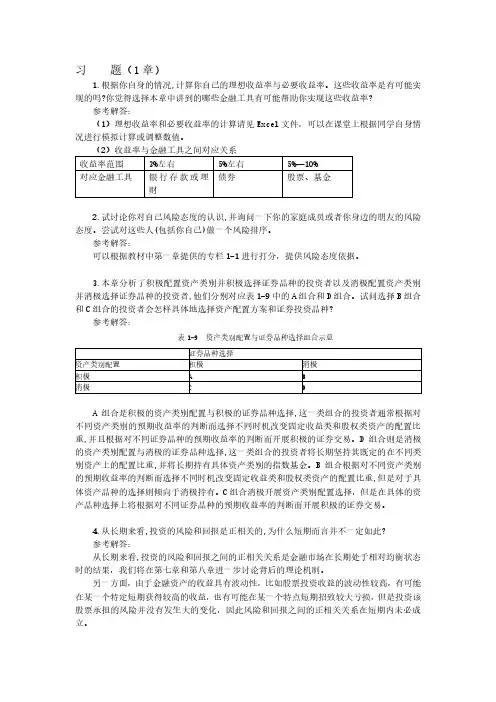
习题(1章)1.根据你自身的情况,计算你自己的理想收益率与必要收益率。
这些收益率是有可能实现的吗?你觉得选择本章中讲到的哪些金融工具有可能帮助你实现这些收益率?参考解答:(1)理想收益率和必要收益率的计算请见Excel文件,可以在课堂上根据同学自身情况进行模拟计算或调整数值。
2.试讨论你对自己风险态度的认识,并询问一下你的家庭成员或者你身边的朋友的风险态度。
尝试对这些人(包括你自己)做一个风险排序。
参考解答:可以根据教材中第一章提供的专栏1-1进行打分,提供风险态度依据。
3.本章分析了积极配置资产类别并积极选择证券品种的投资者以及消极配置资产类别并消极选择证券品种的投资者,他们分别对应表1-9中的A组合和D组合。
试问选择B组合和C组合的投资者会怎样具体地选择资产配置方案和证券投资品种?参考解答:表1-9 资产类别配置与证券品种选择组合示意A组合是积极的资产类别配置与积极的证券品种选择,这一类组合的投资者通常根据对不同资产类别的预期收益率的判断而选择不同时机改变固定收益类和股权类资产的配置比重,并且根据对不同证券品种的预期收益率的判断而开展积极的证券交易。
D组合则是消极的资产类别配置与消极的证券品种选择,这一类组合的投资者将长期坚持其既定的在不同类别资产上的配置比重,并将长期持有具体资产类别的指数基金。
B组合根据对不同资产类别的预期收益率的判断而选择不同时机改变固定收益类和股权类资产的配置比重,但是对于具体资产品种的选择则倾向于消极持有。
C组合消极开展资产类别配置选择,但是在具体的资产品种选择上将根据对不同证券品种的预期收益率的判断而开展积极的证券交易。
4.从长期来看,投资的风险和回报是正相关的,为什么短期而言并不一定如此?参考解答:从长期来看,投资的风险和回报之间的正相关关系是金融市场在长期处于相对均衡状态时的结果,我们将在第七章和第八章进一步讨论背后的理论机制。
另一方面,由于金融资产的收益具有波动性,比如股票投资收益的波动性较高,有可能在某一个特定短期获得较高的收益,也有可能在某一个特点短期招致较大亏损,但是投资该股票承担的风险并没有发生大的变化,因此风险和回报之间的正相关关系在短期内未必成立。
投资学课后习题答案

第一章1. 答:交易机制指市场的交易规则和保证规则实施的技术以及规则和技术对定价机制的影响。
它的主要研究内容包括:从市场微观结构的角度去看,价格是在什么样的规则和程序中形成的,并分析交易机制对资产交易的过程和结果的影响。
2. 答:报价驱动机制与指令驱动机制的区别在于:①价格形成方式不同。
在采用做市商制度的市场上,证券的开盘价格和随后的交易价格是由做市商报出的,而指令驱动制度的开盘价与随后的交易价格都是竞价形成的。
前者从交易系统外部输入价格,后者的成交价格是在交易系统内部生成的。
②信息传递范围与速度不同。
采用做市商机制,投资者买卖指令首先报给做市商,做市商是唯一全面及时知晓买卖信息的交易商,成交量与成交价随后才会传递给整个市场。
在指令驱动机制中,买卖指令、成交量与成交价几乎同步传递给整个市场。
③交易量与价格维护机制不同。
在报价驱动机制中,做市商有义务维护交易量与交易价格。
而指令驱动机制则不存在交易量与交易价格的维护机制。
④处理大额买卖指令的能力不同。
做市商报价驱动机制能够有效处理大额买卖指令。
而在指令驱动机制中,大额买卖指令要等待交易对手的买卖盘,完成交易常常要等待较长时间。
其它交易机制还包括混合交易机制、特殊会员制度等。
3. 答:一般来说,做市商市场的流动性要高于竞价市场,即投资者在竞价市场所面临的执行风险要大于做市商市场。
但是,竞价市场的透明度要好于做市商市场,同时,做市商市场的平均交易成本要高于竞价市场。
竞价市场的优点:①透明度高。
在指令驱动制度中,买卖盘信息、成交量与成交价格信息等及时对整个市场发布,投资者几乎可以同步了解到交易信息。
透明度高,有利于投资者观察市场。
②信息传递速度快、范围广。
指令驱动制度几乎可以实现交易信息同步传递,整个市场可以同时分享交易信息,很难发生交易信息垄断。
③运行费用较低。
投资者买卖指令竞价成交,交易价格在系统内部生成,系统本身表现出自运行特征。
这种指令驱动系统,在处理大量小额交易指令方面,优越性较明显。
第8版投资学精要课后答案中文

收益%=价格变动的%×总投资/投资者初始股权=价格变动的%×1 . 3 3 3 例如,当股票价格从 8 0 上涨至 8 8 时,价格变动百分率为 1 0%,而投资者收益百分率是 1 . 3 3 3 倍, 即 1 3 . 3 3%: 收益的%= 1 0%×20 000 美元/15 000 美元= 1 3 . 3 3% b. 250 股股票价值为 2 5 0P。股权为 2 5 0P-5 000。你会在 ( 2 5 0P-5 000)/250P=0.25 或当 P= 2 6 . 6 7 美元时 收到追加保证金的通知。 c. 但是现在你借入的是 10 000 美元而不是 5 000 美元。因此,股权仅为 2 5 0P-10 000 美元。 你 会在 ( 2 5 0P-10 000)/250P=0.25 或当 P= 5 3 . 3 3 美元时 收到追加保证金的通知。账户上股权越少,你就越容易接到追加保证金的通知。 d. 保证金贷款加上累计利息在一年后为 5 000 美元×1.08=5 400 美元。因此,你的账户的股权 为 2 5 0P-5 400 美元。初始股权为 15 000 美元。因此,你在一年后的收益率情况如下: [(250×8 8 美元-5 400 美元)-15 000 美元]/15 000 美元=0.106 7,或 1 0 . 6 7%。 (ii) [(250×80 美元-5 400 美元)-15 000 美元]/15 000 美元=-0.026 7,或-2.67%。 (iii) [(250×7 2 美元-5 400 美元)-15 000 美元]/15 000 美元=-0 . 1 6 0,或-1 6 . 0%。 I n t e l 股票价格变化和投资者收益百分率的关系由下式给定: 收益的%=价格变动的%×(总投资/投资者的初始股权)-8%×(借得的资金/投资者的初始股权) 例如,当股票价格从 8 0 上涨到 8 8 时,价格变动的百分比为 1 0%,而投资者收益百分率的变动 为 1 0%×(20 000/15 000)-8%×(5 000/15 000)=10.67% e. 250 股股票价值为 2 5 0P。股权为 2 5 0P-5 400。你将会在 ( 2 5 0P-5 400)/250P=0.25 或当 P= 2 8 . 8 0 美元时 收到追加保证金的通知。 下载 2. 假设投资者卖出 Intel 公司的 250 股股票,每股作价 80 美元,给经济人 15000 美元开立卖空 账户。 a. 如果投资者的保证金账户的资金无利息,一年后的 Intel 股价变为(i)88 美元(ii)80 美元 (iii)72 美元,投资者的回报率是多少?假设 Intel 不支付红利。 -13.3% ; 0; 13.3%
威廉夏普投资学课后习题答案解析第九章

1. There are ten key assumptions underlying the CAPM:1. Investors evaluate portfolios by analyzing expected returns and standarddeviations over a one-period time horizon.2. Everything else equal, investors prefer portfolios with greater expectedreturns.3. Everything else equal, investors prefer portfolios with lower standarddeviations.4. Assets are infinitely divisible.5. Investors may borrow or lend at a single riskfree interest rate.6. Taxes and transaction costs are immaterial.7. All investors have the same one-period time horizon.8. All investors borrow and lend at the same riskfree rate.9. All investors have immediate and costless access to all relevant information.10. Investors possess homogeneous expectations regarding the expected returnsand risks of securities.3. The separation theorem states that an investor's optimal risky portfolio can bedetermined without reference to the investor's risk-return preferences.Assuming that every investor has the same expectations regarding expected returns and risks for available securities, and assuming that everyone faces the same riskfree rate, then the efficient set must be the same for all investors. This implies that every investor will hold the same risky portfolio. (That risky portfolio is represented by the point of tangency between a ray emanating from the riskfree asset and extending into risk-return space and tangent to the curved Markowitz efficient set.) The only difference in portfolios held by investors will be with respect to the amount of riskfree lending or borrowing undertaken, which will depend on the investors' individual risk-return preferences.6. If investors wish to hold more units of a security than are available, then they willbid up the price of the security, thereby reducing its expected return. The lower expected return will cause investors to reduce their desired holdings of the security.Conversely, if investors wish to hold fewer units of a security than are available, then they will bid down the security's price, thereby increasing its expected return.The higher expected return will cause investors to wish to hold more units of the security.This process will drive the price of the security toward its equilibrium value at which point the number of units investors wish to hold will equal the number of units outstanding. This equilibrating process will produce market clearing prices for all securities. Further, the riskfree rate will move to a level where the total amount of money borrowed will equal the supply of money available for lending.7. Investor does not require any adjustments by an investor in the market portfolio.Every security in the market portfolio is represented in proportion to its marketvalue relative to the market value of all securities. The market value of a secu rity is the units of the security outstanding times the market price of the security. Thus as relative prices of securities change, their relative market values and therefore their proportions of the market portfolio change concomitantly. No adjustment is required on the part of the investor.10. The equation of the Capital Market Line (CML) is:r p = r f + [(r M - r f )/ M ]* pIn this case, the market portfolio is composed of two securities, A and B . Thu s the expected return of the market portfolio is:r M = (X A ⨯ r A ) + (X B ⨯ r B )= (.40 ⨯ 10%) + (.60 ⨯ 15%)= 13.0%The standard deviation of the market portfolio is:[]2/122222B A AB B A B B A A M X X X X σσρσσσ++== {[(.40)² ⨯ (20)²] + [(.60)² ⨯ (28)²]+ [2 ⨯ (.40) ⨯ (.60) ⨯ (.30) ⨯ (20) ⨯ (28)]}½= [64 + 282.2 + 80.6]½ = 20.7%Therefore the equation for the CML is:r p = 5.0% + [(13.0% - 5.0%)/20.7%] ⨯ p= 5.0% + .39p12. The standard deviation of the market portfolio can be shown to equal the squareroot of the weighted average of the covariances of all its component securities with it. In the case of the this four security portfolio: M = [.20 ⨯ 242 + .30 ⨯ 360 + .20 ⨯ 155 + .30 ⨯ 210]½= (250.4)½ = 15.8%14. According to the CAPM, all investors will hold the market portfolio combinedwith riskfree borrowing or lending. Therefore all investors will be concerned with the risk (or standard deviation) of the market portfolio. The standard deviation of the market portfolio can be shown to be a function of the covariances with it of each of the securities that make up the market portfolio. Therefore th e contribution that each security makes to the market portfolio's risk will be directly related to its covariance with the market portfolio. Risk averse investors will demand higher returns from securities exhibiting higher covariances with the market portfolio.15. With respect to risk, the investor ultimately is concerned with the standarddeviation of his or her portfolio. Therefore, in evaluating a well-diversified portfolio, the relevant measure of risk is standard deviation. However, the contribution of an individual security to a portfolio's standard deviation is not the standard deviation of the security. That is, a portfolio's standard deviation is n ot simply the weighted average of the standard deviations of the component securities. The appropriate measure of a security's risk is the contribution that it makes to the standard deviation of a well-diversified portfolio. That contribution is reflected in the security's covariance with the portfolio.18. Oil is incorrect. The CAPM implies that it is possible for a security to have apositive standard deviation and an expected return less than the riskfree rate. Th e CAPM relationship specifies that:r p = r f + (r M - r f ) iM Thus a security with a negative covariance with the market portfolio would havean expected return less than the riskfree rate. In practice, however, few, if any , securities have a negative covariances with surrogates for the market portfolio.19. The beta of a security is calculated as:βσσi iM M =2Therefore:βA ==292151302.βB ==180150802. βC ==225151002.20. The beta of a portfolio is given by:ββp i i i n X ==∑1In Kitty's case:ßp = (.30 ⨯ .90) + (.10 ⨯ 1.30) + (.60 ⨯ 1.05)= 1.0322. a.b. r i = r f + (r M - r f )βi= 6% + (10% - 6%)ßi= 6% + (4%)ßi c. r A = 6% + (4%)(.85)= 9.4% r B= 6% + (4%)(1.20) = 10.8%24. A security that plots above the SML would be considered an attractive investment.The expected return offered by such a security is greater than that required given its risk. Investors should wish to add such a security to their portfolios.26. Market (or systematic) risk is the portion of a security's total risk that is related tomovements in the market portfolio and hence to the beta of the security. By definition, because the market portfolio is perfectly diversified, market risk in a portfolio cannot be reduced through diversification.Nonmarket (or unique or unsystematic) risk is the portion of a security's total riskthat is not related to moves in the market portfolio. Rather, it is related to even ts specific to the security. As a result, unique risk in a portfolio can be reduced through diversification.28. Two relationships are necessary to identify the missing data in the table:(1) r i = r f + (r M - r f )βi61218240.000.50 1.00 1.50 2.00E x p e c t e d R e t u r n (%)BetaR f =(2) ()2222i M p i εσσβσ+= Using these equations, consider security D first: 7.0 = r f + (r M - r f ) ⨯ 0 r f = 7.0% Next consider security B : 19.0 = 7.0 + (r M - 7.0) ⨯ 1.5 r M = 15.0% Next consider security C : 15.0 = 7.0 + (15.0 - 7.0) ßC ßC = 1.0 Further: (12)² = (1.0)² ⨯ σM 2 + 0 σM 2 = 12% Next consider security A : r A = 7.0 + (15.0 - 7.0)(.8) r A = 13.4% Further: A = [(.8)² ⨯ (12)² + 81]½= 13.2% Returning to security B : B = [(1.5)² ⨯ (12)² + 36]½ = 19.0% Finally, consider security E : 16.6 = 7.0 + (15.0 - 7.0) ßE ßE = 1.2 Further: (15)² = (1.2)² ⨯ (12)² + 2i εσ 2i εσ = 17.6。
威廉夏普 投资学课后习题答案解析第八章
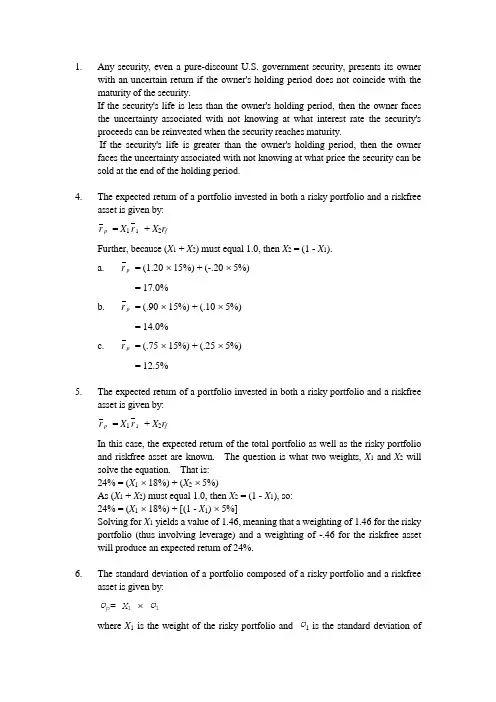
1. Any security, even a pure-discount U.S. government security, presents its ownerwith an uncertain return if the owner's holding period does not coincide with the maturity of the security.If the security's life is less than the owner's holding period, then the owner faces the uncertainty associated with not knowing at what interest rate the security's proceeds can be reinvested when the security reaches maturity.If the security's life is greater than the owner's holding period, then the owner faces the uncertainty associated with not knowing at what price the security can be sold at the end of the holding period.4. The expected return of a portfolio invested in both a risky portfolio and a riskfreeasset is given by:= X1r1+ X2r fpFurther, because (X1 + X2) must equal 1.0, then X2 = (1 - X1).a. r p = (1.20 ⨯ 15%) + (-.20 ⨯ 5%)= 17.0%b. r p = (.90 ⨯ 15%) + (.10 ⨯ 5%)= 14.0%c. r p = (.75 ⨯ 15%) + (.25 ⨯ 5%)= 12.5%5. The expected return of a portfolio invested in both a risky portfolio and a riskfreeasset is given by:= X1r1+ X2r fpIn this case, the expected return of the total portfolio as well as the risky portfolio and riskfree asset are known. The question is what two weights, X1 and X2 will solve the equation. That is:24% = (X1⨯ 18%) + (X2⨯ 5%)As (X1 + X2) must equal 1.0, then X2 = (1 - X1), so:24% = (X1⨯ 18%) + [(1 - X1) ⨯ 5%]Solving for X1 yields a value of 1.46, meaning that a weighting of 1.46 for the risky portfolio (thus involving leverage) and a weighting of -.46 for the riskfree asset will produce an expected return of 24%.6. The standard deviation of a portfolio composed of a risky portfolio and a riskfreeasset is given by:=X1⨯1pwhere X1 is the weight of the risky portfolio and 1 is the standard deviation ofthe risky portfolio. As X1 = (1 - weight of the riskfree asset), then:a. X1 = 1 - (-.30) = 1.30, thus:= 1.30 ⨯ 20%p= 26.0%b. X1 = 1 - .10 = .90, thus:= .90 ⨯ 20%p= 18.0%c. X1 = 1 - .30 = .70, thus:= .70 ⨯ 20%= 14.0%p7. The standard deviation of a portfolio invested in a risky portfolio and a riskfreeasset is given by:= X1⨯1pAs the standard deviation of Oyster's total portfolio is 20%, solving for the proportion invested in the risky portfolio (X1) gives:20% = X1⨯ 25%X1= .80The expected return of a portfolio invested in both a risky portfolio (with proportion X1) and a riskfree asset with proportion X2 or (1 - X1) is:r p = (.80 ⨯ 12%) + [(1 - .80) ⨯ 7%]= 11.0%8. Both Hick and Patsy are correct. Borrowing at the riskfree rate to invest more thanone's initial wealth in a risky portfolio is equivalent to purchasing the risky portfolio on margin. Further, borrowing at the riskfree rate is equivalent to takinga short position in the riskfree asset and investing the proceeds of the short sale inthe risky portfolio.9. The efficient set becomes all the portfolios that can be constructed through acombination of a single risky portfolio and lending or borrowing at the riskfree rate.The efficient set will therefore consist of all portfolios along a ray emanating from the riskfree asset, tangent to the curved Markowitz efficient set (that is, the efficient set without riskfree borrowing or lending), and continuing on out into risk-return space. The tangency point represents the optimal combination of risky assets for the investor.10. Riskfree borrowing and lending permits the investor to create any combination ofportfolios allocated between a risky portfolio (contained in the feasible set of risky portfolios) and the riskfree asset. These combinations lie on rays emanating from the riskfree asset. The more a ray is tilted to the northwest, the more desirable is the associated set of portfolios to the investor.Because the feasible set of risky portfolios is concave, the ray combining the riskfree asset and a risky portfolio, tilted as far as possible to the northwest, mustbe tangent to the feasible set of risky portfolios at only one point. This ray is the efficient set under riskfree borrowing and lending. All other portfolios in the feasible set of risky portfolios (including the "old"efficient set) will lie to the south and/or east of this "new" efficient set and, therefore, are dominated by the portfolios of the new efficient set. That is, these other portfolios offer less expected return and/or more risk than the portfolios lying on the efficient set generated under riskfree borrowing and lending.12. The feasible set now becomes the area between two rays, each emanating from theriskfree asset. The ray to the northwest is the efficient set. The ray to the southeast will connect the riskfree asset and generally the lowest expected return asset. Any combination of risk and return between these two rays can be created by appropriately combining a risky portfolio with riskfree borrowing or lending.13. The efficient set will be the same for both investors because it representsinvestment opportunities, not preferences. (Of course, the two investors may have different expectations regarding available expected returns and risks.)The more risk-averse investor's indifference curves will be more steeply slopedthan the indifference curves of the less risk-averse investor.The optimal portfolio of the more risk-averse investor will lie to the southwest ofthe less risk-averse investor's optimal portfolio. Both optimal portfolios, of course, will lie on the efficient set. The more risk-averse investor's optimal portfolio likely will lie to the southwest of the tangency portfolio, implying lending at the riskfree rate. Conversely, the less risk-averse investor's optimal portfolio likely will lie to the northeast of the tangency portfolio, implying borrowing at the riskfree rate.14. a. The riskfree asset has a zero variance and has zero covariance with otherassets. Thus, examining the variance-covariance matrix, the third security must be the riskfree asset.b. r p = (X 1 ⨯ r 1) + (X 2 ⨯ r 2)= (.50 ⨯ 10.1%) + (.50 ⨯ 7.8%)= 9.0%σσp i n i j ij j n X X =⎡⎣⎢⎤⎦⎥==∑∑1112/= (X 1X 1 11 +X 2X 2 22 + 2X 1X 2 12)½= {[(.50)² ⨯ 210] + [(.50)² ⨯ 90]+ (2) ⨯ (.50) ⨯ (.50) ⨯ (60)}½= [52.5 + 22.5 + 30]½ = [105]½ = 10.2% c. r tp = (.75 ⨯ r p ) + (.25 ⨯ r 3) = (.75 ⨯ 9.0%) + (.25 ⨯ 5.0%)= 8.0%= .75 ⨯p= .75 ⨯ 10.2%tp= 7.7%15. The efficient set would be composed of the southwest portion of the curvedMarkowitz efficient set (that is, the efficient set without riskfree borrowing or lending) up to the tangency portfolio (when both riskfree borrowing and lending are permitted), where it would then become a ray emanating from the tangency portfolio and extending out into risk-return space. If this ray were extended to the southwest, it would intersect the return axis at the riskfree rate.16. The effect is to increase both expected return and risk.The investor is leveraging his or her invested position. Since the optimal risky portfolio has a higher expected return than the riskfree asset, the expected return on the leveraged risky portfolio is higher than that of the unleveraged portfolio.However, because the risky portfolio's return is variable, the leveraged risky portfolio's return is more variable and hence more risky than the return on the unleveraged risky portfolio.17. Your optimal risky portfolio would not change (assuming the feasible investmentopportunities did not change). It would remain the only risky portfolio lying on the efficient set. However, your allocations to the riskfree asset and the risky portfolio would change as your risk preferences changed. As you became less risk averse, you would decrease (increase) your riskfree lending (borrowing) and move to the northeast along the efficient set.18. The efficient set becomes divided into three segments. The first segment is astraight line between the lending rate on the return axis and tangent to the curved Markowitz efficient set (that is, the efficient set without riskfree borrowing or lending). The second segment lies to the northeast of the first. It is a straight line tangent to the curved Markowitz efficient set, extending northeast into risk-return space. While this line does not extend to the return axis, if it did it would intersect the axis at the borrowing rate. The third segment lies between the first two. It is the portion of the curved Markowitz efficient set that lies between the two tangency portfolios.。
投资学第9章习题及答案
投资学第9章习题及答案投资学第9章习题及答案篇一:投资学第九版课后习题答案--第10、11章第10章5、因为投资组合F的β=0,所以其预期收益等于无风险利率对于投资组合A,风险溢价与β的比率为(12-6)/=5 对于投资组合E,风险溢价与β的比率为(8-6)/=对比表明,这里有套现机会存在。
例如,我们能创建一个投资组合G,其包含投资组合A和投资组合F,并且两者有相等的权重,使它满足β等于;这样投资组合F的期望收益和β为:E(rG ) = ( × 12%) + ( × 6%) = 9%βG = ( × ) + ( × 0%) =对比投资组合G和投资组合E,投资组合G跟E具有相同的β值,但具有更高的期望收益。
因此通过买入投资组合G,并卖出相同数量投资组合E资产就可以实现套现机会。
这种套现利润:rG –rE =[9% + ( × F)] ? [8% + ( × F)] = 1%6、设无风险利率为rf,风险溢价因素RP,则:12% = rf + ( × RP)9% = rf + ( × RP)解之得: rf=3%,RP=%7、a、由题目知,买进100万美元等权重的正α值的股票并同时卖出100万美元的等权重的负α值的股票;假定市场风险为0;则预期收益为:$1,000,000*$1,000,000*(-)=$40,000b、对于分析师分析的20只股票,每只股票持有时都分别为$100,000,市场风险为0,公司持有的收益标准差为30%,所以20只股票的方差为20 × [($100,000 × )* ($100,000 × )] = $18,000,000,000故标准差为$134,164a、如果分析师分析的是50只股票,那么每只股票持有时都分别为$40,000,计算收益方差:50 × [(40,000 × )* (40,000 × )] = 7,200,000,000故标准差为$84,853;由于总投入资金不变,α值不变,故其期望收益也不变,为$40,0008、2a、?2??2?2M??(e)2?A?(?202)?252?881222?2B?(?20)?10?5002?C?(?202)?202?976b、如果资产种类很多,并且具有相同的收益特征,每一个种类的充分分散投资组合将存在唯一的系统风险,因为非系统性风险随着n的无穷大会趋近于0,因此充分分散的投资组合的超额收益方差的均值为:2 ?A?2562?B?400C2?576C、市场中不存在套现机会第11章9、答案:C。
《投资学(第6版)》课后习题参考解答.docx
第一章一、单项选择题1.下列选项中,()不是投资的特点。
A.投资通常是刚性兑付B.投资的复杂性和系统性C.投资周期相对较长D.投资项目实施的连续性和资金投入的波动性E.投资金融答案:A。
应为"投资具有风险性”。
2.下列选项中,()不是投资对经济增长的影响或作用的表现。
A.从资源配置角度看,投资影响经济结构,从而促进经济增长B.国民收入水平下降的年份,年度投资规模也相应减少,以保证人民生活水平改善的步伐C.从要素投入角度看,投资供给对经济增长有推动作用,增加生产资料供给,为扩大再生产提供物质条件D.从要素投入角度看,投资需求对经济增长有拉动作用,增加一笔投资会带来大于这笔投资额数倍的国民收入增加答案:B。
B为投资的特点之三。
年度投资规模的增长具有波动性。
年度投资规模与国民经济形势和国民收入多少密切相关。
二、多项选择题1.投资的要素包括()。
A.投资主体B.投资客体C.投资目的D.投资方式E.投资金额答案:ABCD。
2.投资学的研究方法包括()。
A.理论与实践相结合B.实证分析与规范分析相结合C.历史分析与比较分析相结合D.系统分析与定量分析相结合E.静态分析与动态分析相结合答案:ABCDE。
三、判断题1.从1992年开始,尽管我国经济体制改革不断深入,但社会各界对投资概念、投资范围的认识并未变化,投资只包括直接投资,即将资金直接投入建设项目形成固定资产和流动资产。
()答案:错。
解释:投资概念、投资范围的认识也不断深化,投资包括直接投资也包括间接投资,即购买有价证券,形成金融资产。
2.无论哪一种方式的金融投资,都是货币资金转化为金融资产,没有直接实现实物资产的增加。
现实生活中实物投资与金融投资具有相互依存和相互促进的关系,金融投资以实物投资为基础,除了某些特殊的金融投资外,并不转化为实物投资。
()答案:对。
3.尽管社会主义市场经济不断发展与完善,但我国原有的以国家投资为主的投融资格局仍未被打破。
《投资学》课后习题答案
《投资学》课后习题答案张元萍《投资学》课后习题答案第一章能力训练答案选择题思考题1.投资就是投资主体、投资目的、投资方式和行为内在联系的统一,这充分体现了投资必然与所有权相联系的本质特征。
也就是说,投资是要素投入权、资产所有权、收益占有权的统一。
这是因为:①反映投资与所有权联系的三权统一的本质特征,适用于商品市场经济的一切时空。
从时间上看,无论是商品经济发展的低级阶段还是高度发达的市场经济阶段,投资都无一例外地是要素投入权、资产所有权、收益占有权的统一;从空间上看,无论是在中国还是外国乃至全球范围,投资都无一例外地是这三权的高度统一。
②反映投资与所有权联系的三权统一的本质特征,适用于任何投资种类和形式。
尽管投资的类型多种多样,投资的形式千差万别,但它们都是投资的三权统一。
③反映投资与所有权联系的三权统一本质特征贯穿于投资运动的全过程。
投资的全过程是从投入要素形成资产开始到投入生产,生产出成果,最后凭借对资产的所有权获取收益。
这一全过程实际上都是投资三权统一的实现过程。
④反映投资与所有权联系的三权统一本质特征,是投资区别于其他经济活动的根本标志。
投资的这种本质特征决定着投资的目的和动机,规定着投资的发展方向,决定着投资的运动规律。
这些都使投资与其他经济活动区别开来,从而构成独立的经济范畴和研究领域。
2.金融投资在整个社会经济中的作用来看,金融投资的功能具有共性,主要有以下几个方面:(1)筹资与投资的功能。
这是金融投资最基本的功能。
筹资是金融商品服务筹资主体的功能,投资是金融商品服务投资主体的功能。
社会经济发展的最终决定力量是其物质技术基础,物质技术基础的不断扩大、提高必须依靠实业投资。
(2)分散化与多元化功能。
金融投资促进了投资权力和投资风险分散化,同时又创造了多元化的投资主体集合。
金融投资把投资权力扩大到了整个社会。
(3)自我发展功能。
金融投资具有一种促进自己不断创新和发展的内在机制。
(4)资源配置优化功能。
投资学8~9章课后习题
投资学课后作业 第八章 指数模型3. 其他条件保持不变,公司特定风险越大,积极组合所占的比重越小,投资者会偏向于投资指数组合。
4.因为我们已经用市场指数表示了市场收益溢价,剩下的当然是非市场收益溢价。
当市场收益溢价为0时,α所表示的就是非市场收益溢价。
对于积极投资者而言,找到非零的α,代表夏普比率会相对其他投资组合更大,即相同的风险,收益会更高,所以积极型投资者更容易被α值大的股票吸引。
其他条件保持不变,α变大,夏普比率变大。
5.a.估计60个期望值、60个方差、C 602=1770个协方差b.单指数模型公式R i =αi +βi ∗R M +e i σ2=βi 2σM 2+σ2(e i ) 需要估计60个期望值、60个βi 、60个σ2(e i )、1个βi 2σM 2、1个R M6.a. σi2=βi 2σM 2+σ2(e i ),带入数值,解得σA=34.78%,σB=47.93%b.E r p =0.3∗E r A +0.45∗E r B +0.25∗r f ,代入数值,得E r p =14% β=0.3∗βA +0.45∗βB+0.25∗βf ,带入数值,得β=0.78σ2=βi 2σM2+σ2 e ,其中,βi 2σM2=0.782∗0.222=0.0294,σ2 e =0.32∗σ2 e A +0.452∗σ2 e B ,带入数值,得σ2 e =0.0405, σ2=0.0699,σ=26.44%7.从图中我们可以看到A 的回归线比较平缓,散点离回归线比较远,说明A 的特定风险大;B 的回归线比较陡峭,说明B 的系统风险大,散点比较接近回归线,模拟的比较好,。
a. A 的特定风险大b. B 的系统风险大c. Bd. Ae. B 8. a. A b. A c. A d.-0.2% 9. σi2=βi 2σM2+σ2e i =βi 2σM2R2, 带入数值,得σA =31.3%,σB=69.28%10. βA 2σM2=0.72∗0.22=1.96%,σ2 e A =9.797%−1.96%=7.837%,同理,得βB 2σM2=5.76% σ2 e B =4.22%11.Cov R A ,R B =βA βB σM2, 代入数值,得Cov R A ,R B =3.36%,ρ=Cov R A,R B,带入数值,得ρ=0.155σAσB12. Cov R A,R M=βAβMσM2, 代入数值,得Cov R A,R M=2.8%,同理,得Cov R M,R B=4.8%13.组合P的方差σp2=0.62∗σA2+0.42∗σB2+0.6∗0.4∗σAσB,带入数值,得σp2=0.1282 σP=35.8%βP=0.6∗0.7+0.4∗1.2=0.9, βP2σM2=3.24%,σ2e P=9.58%, Cov R P,R M=0.3614.基本思想与13题一样,这里就不再列出式子而直接写答案了:标准差为21.55%,与市场的协方差为0.3,非系统风险2.40%,系统风险19.15%16.αA=0.11−0.06−0.8∗0.12−0.06=0.02αB=0.14−0.06−1.5∗0.12−0.06=−0.01,通过比较,我会选择α大的股票17.a.b.α=-(0.61*1.6%+1.13*4.4%+1.69*3.4%+1.7*4.0%)=-16.9% β=2.08最优组合是指数组合的权重为1.047c.夏普比率为0.3662,积极组合的贡献为0.0184d.投资于短期国债的比例为0.5685,投资于股票组合的比例为(1-0.5685)第九章 资本资产定价模型8. 贴现率i=r f +β(r M −r f ),带入数值,得i=22.4% NPV= (CI −CO )t (1+i)t100,带入数值,得NPV=18.09美元,当NPV<=0时,i<=0.3573, 则β最大为3.47 9.a.各为2和0.3b.期望收益率各为18%和9%c.整体经济的证券市场线的斜率为1,纵坐标截距为6%d.每只股票的截距分别为-0.06和0.003e.8.7%10.不可能,因为A 的β比B 的要大,但是A 的收益却比B 的要小,这样的组合是无效的。