美联储资产负债表
美联储资产负债表_20021226
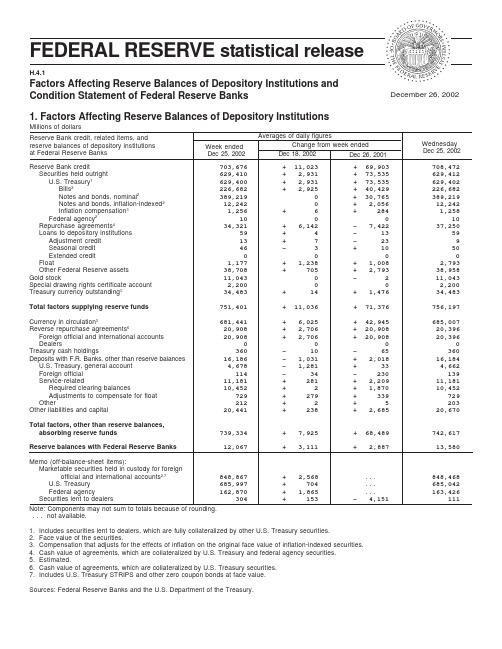
Reserve Bank credit, related items, and reserve balances of depository institutions at Federal Reserve BanksReserve Bank credit703,676 + 11,023 + 69,903 708,472Securities held outright 629,410 + 2,931 + 73,535 629,412U.S. Treasury 1629,400 + 2,931 + 73,535 629,402Bills 2226,682 + 2,925 + 40,429 226,682Notes and bonds, nominal 2389,219 0 + 30,765 389,219Notes and bonds, inflation-indexed 2 12,242 0 + 2,056 12,242Inflation compensation 3 1,256 + 6 + 284 1,258Federal agency 210 0 0 10Repurchase agreements 434,321 + 6,142 - 7,422 37,250Loans to depository institutions 59 + 4 - 13 59Adjustment credit 13 + 7 - 23 9Seasonal credit 46 - 3 + 10 50Extended credit 0 0 0 0Float1,177 + 1,238 + 1,008 2,793Other Federal Reserve assets 38,708 + 705 + 2,793 38,958Gold stock11,043 0 - 2 11,043Special drawing rights certificate account 2,200 0 0 2,200Treasury currency outstanding 534,483 + 14 + 1,476 34,483Total factors supplying reserve funds751,401 + 11,036 + 71,376 756,197Currency in circulation 5681,441 + 6,025 + 42,945 685,007Reverse repurchase agreements 620,908 + 2,706 + 20,908 20,396Foreign official and international accounts 20,908 + 2,706 + 20,908 20,396Dealers0 0 0 0Treasury cash holdings360 - 10 - 65 360Deposits with F.R. Banks, other than reserve balances 16,186 - 1,031 + 2,018 16,184U.S. Treasury, general account 4,678 - 1,281 + 33 4,662Foreign official 114 - 34 - 230 139Service-related11,181 + 281 + 2,209 11,181Required clearing balances10,452 + 2 + 1,870 10,452Adjustments to compensate for float 729 + 279 + 339 729Other212 + 2 + 5 203Other liabilities and capital20,441 + 238 + 2,685 20,670Total factors, other than reserve balances,absorbing reserve funds 739,334 + 7,925 + 68,489 742,617Reserve balances with Federal Reserve Banks12,067+ 3,111+ 2,88713,580Memo (off-balance-sheet items):Marketable securities held in custody for foreignofficial and international accounts 2,7 848,867 + 2,568 . . . 848,468U.S. Treasury 685,997 + 704. . . 685,042Federal agency 162,870 + 1,865 . . . 163,426Securities lent to dealers 304 + 153 - 4,151 111December 26, 2002Factors Affecting Reserve Balances of Depository Institutions and Condition Statement of Federal Reserve Banks1. Factors Affecting Reserve Balances of Depository InstitutionsMillions of dollarsAverages of daily figuresNote: Components may not sum to totals because of rounding.. . .not available.1.Includes securities lent to dealers, which are fully collateralized by other U.S. Treasury securities.2.Face value of the securities.pensation that adjusts for the effects of inflation on the original face value of inflation-indexed securities.4.Cash value of agreements, which are collateralized by U.S. Treasury and federal agency securities.5.Estimated.6.Cash value of agreements, which are collateralized by U.S. Treasury securities.7.Includes U.S. Treasury STRIPS and other zero coupon bonds at face value.Sources: Federal Reserve Banks and the U.S. Department of the Treasury.Change from week ended Wednesday Dec 25, 2002Week ended Dec 25, 2002 Dec 18, 2002 Dec 26, 2001Note: Components may not sum to totals because of rounding.1.Includes securities lent to dealers, which are fully collateralized by other U.S. Treasury securities.2.Face value of the securities.pensation that adjusts for the effects of inflation on the original face value of inflation-indexed securities.4.Cash value of agreements, which are collateralized by U.S. Treasury and federal agency securities.5.Includes assets denominated in foreign currencies, which are revalued daily at market exchange rates.6.Cash value of agreements, which are collateralized by U.S. Treasury securities.7.Includes exchange-translation account reflecting the daily revaluation at market exchange rates of foreign exchange commitments.AssetsGold certificate account11,039 0 - 6Special drawing rights certificate account 2,200 0 0Coin1,011 - 24 - 55Securities, repurchase agreements, and loans 666,721 + 7,269 + 60,420Securities held outright 629,412 + 5 + 73,405U.S. Treasury 1629,402 + 5 + 73,405Bills 2226,682 0 + 40,293Notes and bonds, nominal 2389,219 0 + 30,765Notes and bonds, inflation-indexed 2 12,242 0 + 2,056Inflation compensation 3 1,258 + 5 + 291Federal agency 210 0 0Repurchase agreements 4 37,250 + 7,250 - 13,000Loans59 + 14 + 14Items in process of collection (1,076) 13,239 + 4,439 + 8,017Bank premises 1,540 + 6 + 21Other assets 537,357 + 817 + 1,764Total assets (1,076)733,107 + 12,506 + 70,162LiabilitiesFederal Reserve notes, net of F.R. Bank holdings 651,891 + 6,292 + 41,390Reverse repurchase agreements 6 20,396 - 1,509 + 20,396Deposits(0)29,704 + 4,781 - 1,380Depository institutions24,701 + 6,758 - 1,070U.S. Treasury, general account 4,662 - 1,933 - 194Foreign official 139 - 33 - 94Other(0) 203 - 10 - 20Deferred availability cash items(1,076) 10,447 + 2,181 + 6,515Other liabilities and accrued dividends 72,461 + 43 - 133Total liabilities(1,076)714,898 + 11,787 + 66,787Capital accounts Capital paid in 8,382 + 6 + 1,025Surplus7,312 0 + 600Other capital accounts2,516 + 714 + 1,751Total capital18,209+ 720+ 3,374H.4.12. Consolidated Statement of Condition of All Federal Reserve BanksMillions of dollarsChange sinceWednesday Dec 26, 2001Eliminations from consolidationWednesday Dec 25, 2002Wednesday Dec 18, 20023. Maturity Distribution of Loans and Securities, December 25, 2002Millions of dollars Federal agency securitiesWeeklychanges Holdings U.S. Treasury securities 1Holdings Weeklychanges LoansRepurchase agreements 2Note:Components may not sum to totals because of rounding. . . .Not applicable.1.Includes the original face value of inflation-indexed securities and compensation that adjusts for the effects of inflation on the original face value of such securities.2.Cash value of agreements classified by remaining maturity of the agreements.Reverse repurchase agreements 2Within 15 days 57 33,670 - 13,583 0 0 21,250 20,39616 days to 90 days 2 146,846 + 12,584 0 0 16,000 091 days to 1 year141,815 + 999 10 0. . . . . . Over 1 year to 5 years . . . 173,936 + 1 0 0. . . . . . Over 5 years to 10 years . . . 53,298 + 3 0 0. . . . . . Over 10 years. . .79,838+ 20. . . . . .All 59 629,402 + 5 10 0 37,250 20,396Assets, liabilities, and capitalMaturity。
中央银行:美联储资产负债表演变及其政策内涵

一、危机前美联储资产负债表(2007.8)
资产 (亿美元)
证券 政府短期债券
7800 2770
政府长期债券
5039
回购协议 贷款 黄金 外汇和其他资产 总计
360 0.28 110 467 8737
负债(亿美元)
90% 通货
8074
93%
银行准备金
184
2%
逆回购
1.传统贴现窗口 –降低再贴现率 –07年6月1.49亿美元 –08年10月1119亿美元
2.定期拍卖贷款TAC –交易对象为银行 –扩展了质押品
–国债、优质企业债 –联邦机构债 –机构担保抵押债券MBS
3.商业票据融资便利CPFF
美联储
贷款
本息
CPFF LLC
资金
CP
商业票据发行人
4.定期资产支持证券融资便利TALF • 向合格证券持有者融资
– 学生贷款支持证券 – 消费贷款支持证券 – 中小企业贷款支持证券等 • 鼓励投资合格ABS • 推动相关贷款一级市场
(三)特定机构贷款支持
•Maiden Lane LLC
贝尔斯登
•Maiden Lane Ⅱ LLC AIG
•Maiden Lane Ⅲ LLC
图:贝尔斯登 AIG
四、危机后美联储负债结构变化
2008.3-5
2009.3——2012.12
–2009年QE1启动后增持 • 危机救助转向实施量化宽松
BACK
2. 大规模购买新型债券
• 联邦机构债 –房地美、房利美和吉利美债券
• 机构担保MBS债券 –由券商发行三家机构担保的MBS
• 美联储优先购买上述பைடு நூலகம்类债券
美联储资产负债表_2001年
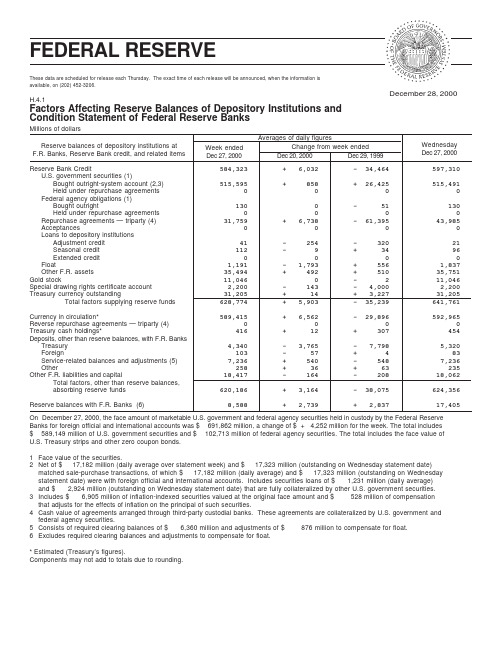
Reserve Bank Credit584,323 + 6,032 - 34,464 597,310U.S. government securities (1)Bought outright-system account (2,3) 515,595 + 858 + 26,425 515,491Held under repurchase agreements 0 0 0 0Federal agency obligations (1)Bought outright130 0 - 51 130Held under repurchase agreements 0 0 0 0Repurchase agreements — triparty (4) 31,759 + 6,738 - 61,395 43,985Acceptances0 0 0 0Loans to depository institutionsAdjustment credit 41 - 254 - 320 21Seasonal credit 112 - 9 + 34 96Extended credit 0 0 0 0Float1,191 - 1,793 + 556 1,837Other F.R. assets 35,494 + 492 + 510 35,751Gold stock11,046 0 - 2 11,046Special drawing rights certificate account 2,200 - 143 - 4,000 2,200Treasury currency outstanding31,205 + 14 + 3,227 31,205Total factors supplying reserve funds 628,774 + 5,903 - 35,239 641,761Currency in circulation*589,415 + 6,562 - 29,896 592,965Reverse repurchase agreements — triparty (4) 0 0 0 0Treasury cash holdings*416 + 12 + 307 454Deposits, other than reserve balances, with F.R. BanksTreasury 4,340 - 3,765 - 7,798 5,320Foreign103 - 57 + 4 83Service-related balances and adjustments (5) 7,236 + 540 - 548 7,236Other258 + 36 + 63 235Other F.R. liabilities and capital18,417 - 164 - 208 18,062Total factors, other than reserve balances,absorbing reserve funds 620,186 + 3,164 - 38,075 624,356Reserve balances with F.R. Banks (6)8,588+ 2,739+ 2,83717,405December 28, 2000These data are scheduled for release each Thursday. The exact time of each release will be announced, when the information is available, on (202) 452-3206.H.4.1Factors Affecting Reserve Balances of Depository Institutions and Condition Statement of Federal Reserve BanksMillions of dollarsAverages of daily figuresReserve balances of depository institutions at F.R. Banks, Reserve Bank credit, and related items On December 27, 2000, the face amount of marketable U.S. government and federal agency securities held in custody by the Federal Reserve Banks for foreign official and international accounts was $ 691,862 million, a change of $ + 4,252 million for the week. The total includes $ 589,149 million of U.S. government securities and $ 102,713 million of federal agency securities. The total includes the face value of U.S. Treasury strips and other zero coupon bonds.1Face value of the securities.2Net of $ 17,182 million (daily average over statement week) and $ 17,323 million (outstanding on Wednesday statement date)matched sale-purchase transactions, of which $ 17,182 million (daily average) and $ 17,323 million (outstanding on Wednesday statement date) were with foreign official and international accounts. Includes securities loans of $ 1,231 million (daily average)and $ 2,924 million (outstanding on Wednesday statement date) that are fully collateralized by other U.S. government securities.3Includes $ 6,905 million of inflation-indexed securities valued at the original face amount and $ 528 million of compensation that adjusts for the effects of inflation on the principal of such securities.4Cash value of agreements arranged through third-party custodial banks. These agreements are collateralized by U.S. government and federal agency securities.5Consists of required clearing balances of $ 6,360 million and adjustments of $ 876 million to compensate for float.6Excludes required clearing balances and adjustments to compensate for float.* Estimated (Treasury’s figures).Components may not add to totals due to rounding.Change from week ended Wednesday Dec 27, 2000Week ended Dec 27, 2000Dec 20, 2000Dec 29, 1999ASSETSGold certificate account11,046 0 - 2Special drawing rights certificate account 2,200 0 - 4,000Coin 946 - 8 + 743Loans117 - 8 - 2,755Acceptances0 0 0Repurchase agreements — triparty (1) 43,985 + 18,275 - 78,885Federal agency obligations (2)Bought outright130 0 - 51Held under repurchase agreements 0 0 0U.S. government securities (2)Bought outright—Bills182,530 - 97 + 557Notes (3) 240,176 + 1,047 + 21,710Bonds (4)92,784 + 1 + 9,806Total bought outright (5)515,491 + 952 + 32,074Held under repurchase agreements0 0 0Total U.S. government securities515,491 + 952 + 32,074Total loans and securities559,723 + 19,219 - 49,617Items in process of collection (771) 10,087 - 2,247 + 3,162Bank premises 1,455 + 3 + 99Other assets (6)34,268 + 548 + 435 TOTAL ASSETS (771)619,724 + 17,514 - 49,182LIABILITIESFederal Reserve notes563,160 + 6,370 - 37,761Reverse repurchase agreements — triparty (1) 0 0 0DepositsDepository institutions24,787 + 10,921 + 8,058U.S. Treasury—general account 5,320 + 539 - 20,603Foreign—official accounts83 - 144 - 151Other(0) 235 + 24 + 52Total deposits(0) 30,426 + 11,342 - 12,643Deferred availability cash items(771) 8,077 - 120 + 1,445Other liabilities and accrued dividends (7)4,341 - 34 - 137TOTAL LIABILITIES (771)606,003 + 17,557 - 49,096CAPITAL ACCOUNTS Capital paid in 7,024 + 2 + 592Surplus2,679 0 - 3,273Other capital accounts4,018- 45+ 2,596H.4.1(a)Consolidated Statement of Condition of all Federal Reserve BanksMillions of dollarsChange SinceWednesday Dec 29, 1999Eliminations from ConsolidationWednesday Dec 27, 2000Wednesday Dec 20, 20001Cash value of agreements arranged through third-party custodial banks.2Face value of the securities.3Includes $ 5,367 million of inflation-indexed securities valued at the original face amount and $ 425 million of compensation that adjusts for the effects of inflation on the principal of such securities.4Includes $ 1,538 million of inflation-indexed securities valued at the original face amount and $ 104 million of compensation that adjusts for the effects of inflation on the principal of such securities.5Net of $ 17,323 million matched sale-purchase transactions outstanding at the end of the latest statement week. Includes securities loans of $ 2,924 million that are fully collateralized by other U.S. government securities.6Includes assets denominated in foreign currencies, revalued monthly at market exchange rates.7Includes exchange-translation account reflecting the monthly revaluation at market exchange rates of foreign exchange commitments.Maturity Distribution of Loans and Securities, December 27, 2000Millions of dollarsFederal agency obligations(2)Weeklychanges Holdings U.S. government securities (1,2)Holdings Weeklychanges LoansRepurchase Agreements—Triparty (3)1Includes $ 6,905 million of inflation-indexed securities valued at the original face amount and $ 528 million of compensation that adjusts for the effects of inflation on the principal of such securities.2Includes face value of securities held under repurchase agreements classified by the remaining maturity of the agreements.3Cash value of agreements arranged through third-party custodial banks classified by remaining maturity of the ponents may not add to totals due to rounding.ReverseRepurchase Agreements—Triparty (3)Within 15 days 110 19,889 + 954 0 0 33,010 016 days to 90 days 7 110,832 - 1,017 0 0 10,97591 days to 1 year125,620 - 34 0 0—————— Over 1 year to 5 years ——— 132,792 + 1,046 130 0—————— Over 5 years to 10 years ——— 55,461 + 2 0 0——————Over 10 years ——— 70,896 + 1 0 0——————Total117515,491+ 95213043,985。
中国人民银行资产负债表及与美联储对比

➢ 对其他存款性公司的债权:包括商业银行和信用合作社。
➢ 对其他金融性公司的债权:包括政策性银行、证券公司、保险公司、资产管理 公司、信托投资公司、金融租赁公司等。央行对这些金融机构发放的信用贷款 以及购买特定金融机构发行的债券等。
中央银行学
近年我国货币政策
➢ 2009年—2012年货币政策.docx ➢ 2009年:适当调整完善了支农再贷款政策,同时对西部地区和粮食主产区安排增加
支农再贷款额度100亿元。适当上调金融机构短期外债指标,强调增量部分全部用于 支持境内企业进出口贸易融资,促进对外贸易健康平稳发展。
➢ 2010年:中国人民银行于1月14日、2月12日、 5月2日、10月20日1、1月10日 12月10日、12月26日先后7次调整金融机构的存贷款基准利率。 ➢ 2011年:近年来对存贷款利率调整最多的一年
中央银行学
特点
1. 资产和负债的规模扩大,创新工具增加。 2. 国债占据了美联储资产的最主要部分。 3. 回购操作基本停止,基础货币大幅增长。
中央银行学
分析
次贷危机后,虽然美国实行宽松的货币政策,但是流通中的 通货的变化并不大。美联储没有明显增加流通中的通货,法 定存款准备 金变动不大。 从美联储资产负债表的变化可以看出,美联储应对次贷危机, 推出不少创新 性的救援和贷款便利措施,使其资产负债表表 的信贷资产项目增添了多项内容。
中央银行学
3、贷款和融资 3.1 定期拍卖信贷(TAF) 3.2 PDCF(Dealer Credit) 3.3 AMLF 3.4 TALF(定期资产支持 债券贷 款) 3.5 CPFF(商业票据)
美联储资产负债表中的银行存款准备金
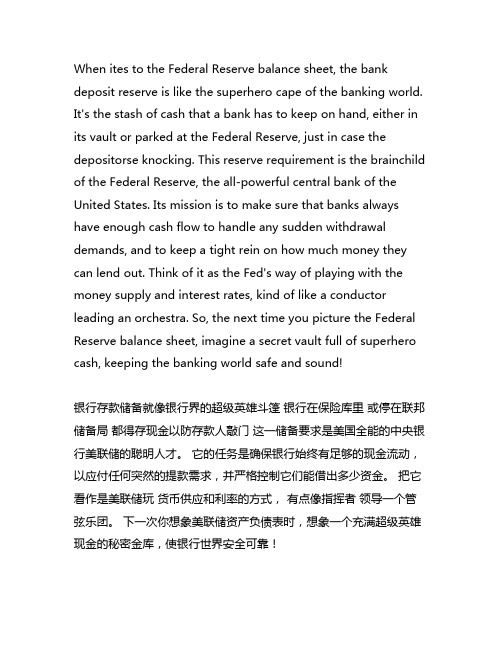
When ites to the Federal Reserve balance sheet, the bank deposit reserve is like the superhero cape of the banking world. It's the stash of cash that a bank has to keep on hand, either in its vault or parked at the Federal Reserve, just in case the depositorse knocking. This reserve requirement is the brainchild of the Federal Reserve, the all-powerful central bank of the United States. Its mission is to make sure that banks always have enough cash flow to handle any sudden withdrawal demands, and to keep a tight rein on how much money they can lend out. Think of it as the Fed's way of playing with the money supply and interest rates, kind of like a conductor leading an orchestra. So, the next time you picture the Federal Reserve balance sheet, imagine a secret vault full of superhero cash, keeping the banking world safe and sound!银行存款储备就像银行界的超级英雄斗篷银行在保险库里或停在联邦储备局都得存现金以防存款人敲门这一储备要求是美国全能的中央银行美联储的聪明人才。
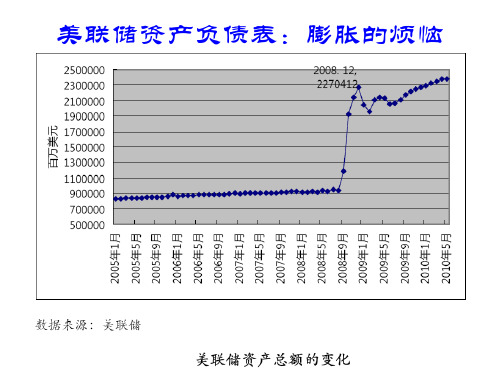
美联储资产负债表:膨胀的烦恼
美联储资产负债表:膨胀的烦恼
2007年底美国联储资产负债表(单位:十亿美元)
资产 项目 黄金 特别提款权 硬币 证券、回购、TAC、贷款 直接购买政府机构债券 持有政府机构回购协议 再贷款 其他 资产总额 金额 11.0 2.2 1.7 826.1 779.6 46.0 0.5 40.0 885.0 100 53.7 22.0 比重% 项目 现钞 逆回购协议 存款 存款机构存款 美国财政部存款 托收现金 其他 资本 负债与资本合计 负债 金额 776.7 37.4 26.2 21.1 4.7 17.8 5.9 17.8 885.0 100 36.3 比重%
2008年底美国联储资产负债表(单位:十亿美元)
资产 项目 金额 比重% 特别提款权 硬币 证券、回购、TAC、贷款 直接购买政府机构债券 持有政府机构回购协议 定期信用招标(TAC)* 商业票据融资工具(CPFF) ** 其他贷款
11.0
2.2 1.7 1213.7 497.0 80.0 450.2 332.0 187.0 14.7 53.7 22.0
现钞
逆回购协议 存款 存款机构存款 美国财政部存款 托收现金 其他 资本
849.7
88.3 1242.0 819.4 407.3 2.5 33.7 21.1
37.6
55.0 36.3
其他资产 资产总额
619.8 2258.7 100 负债与资本合计 2258.7 100
关注以下问题
• (1)2008年美国联储资产负债规模发生了近3倍的剧烈 变化,请简要解释原因。 • (2)美国联储极少使用再贷款,为何在2008年进行大规 模的TAC(相当于再贷款)活动? • (3)为什么美国联储在2008年大规模直接介入对商业票 据的购买(CP,即公司本票,融资券)? • (4)请简要分析美国联储资产负债规模的膨胀与美元币 值稳定之间的关系。 • (5)金融稳定是中央银行货币政策的最终目标之一,请 阐述对该目标的理解。
资产负债表对宏观经济的影响分析

资产负债表对宏观经济的影响分析2017年,美联储公布3月份货币政策例会纪要显示,只要美国经济增长表现继续符合美联储预期,大多数美联储官员认为今年晚些时候可能适合开始缩减资产负债表。
这是美联储首次就缩减资产负债表的时机作出明确表态。
如果首次听到“缩表”这个词儿,可能会感到莫名其妙。
那么,缩表到底是什么?会对美国经济,全球经济造成什么样的影响?“表”是指中央银行的资产负债表,“缩表”意思是中央银行主动缩减资产负债表规模的行为。
对于中央银行来说,有左侧资产的增进,才能有右侧负债的跟进,而资产的规模则决定着央行货币政策的空间与尺度。
2008年之后,为提振经济复苏,美联储开启三轮量化宽松,印钞购买债券,为实体经济注入流动性,同时资产负债表大幅膨胀,而资产负债表的规模,大致对应着基础货币的规模,货币成倍数放大,就得到广义货币供应量。
“缩表”意味着要将资产与负债两端降下来,实现货币政策正常化,回收流动性,从国际上将美元抽回,加速新兴经济体资本外流,更重要的会对高杠杆高负债国家造成更大冲击。
下图是2002年迄今美联储资产负债表规模变动情况。
图 1 美国GDP与美联储资产变动从2009年到2014年,美联储进入市场大量购买国债和MBS,将其资产负债表规模从2007年的9000亿美元急剧扩张到2014年底的4.5万亿美元左右。
图 2 美国基础货币存量与环比增速从基础货币的环比增速来看,自从08年量化以来,货币增速波动率明显增大。
但近年随着国内经济转暖,就业上升,失业率稳定,美联储也希望尽早将货币政策回归正常,同时回收因QE而投放的过多流动性,强美元以引资本回流。
由于美元在全球货币体系中处于核心地位,各新兴经济体的汇率都主要盯住美元。
无论是美联储加息抑或缩表,对新兴经济体的汇率会造成冲击。
同时对于所有美元计价物来说,美元总量的变少会导致美元更贵,而资产价格更低。
所以美联储缩表会导致所有资产的重估。
实际上,缩表要比加息的影响大得多,加息从狭义上来看只是通过刺激美元强势,引导资本回流的一个间接工具。
2011年美国货币当局资产负债表分析

一、2011年末美国货币当局 资产负债的主要来源 及运用投向
二、基础货币主要通过 哪些渠道投放的
三、与2007年末相比有哪些变化 及影响变化的主要原因
一、2011年末美国货币当局资产负债的主要来源及运用投向
主要来源:负债方主要来自存款和联邦储备券,存款占59.10%,其中银行存 款占53.58%,联邦储备券占35%,其次是财政部存款占3.12%,逆回购协议
占3.02%,外国和其他存款占2.40%。
主要运用投向:资产方主要是美国政府证券,占89.5%。
二、基础货币主要通过哪些渠道投放的
美联储对基础货币的投放有三个渠道: 1、购入美国政府债券 2、再贴现贷款 3、持有的黄金及特别提款权 从表中可以看出,购买美国政府债券是投放基础货币的最主要渠道,2011年以持有政府债 券资产形式投放的基础货币约26224.64亿美元,占总资产的89.5%。通过持有黄金及特别 提款权投放的货币16237亿美元,占资产中的0.55%。
2、负债规模分析以及变动原因 2.1负债占比情况
2007年负债8943.14亿美元,其中联邦储备券占比为88.5%,2011年负债为
29285.85亿美元,联邦储备券占比为35%,银行存款占比为53.58%,净增量分别为 2427.19亿美元、15578.28亿美元,增幅分别为30.65%、13618.57%。 2.2负债项目结构以及变化原因 ①美联储发行的联邦储备券数量上升,商业银行存入美联储的储备金中,超 额准备金急剧膨胀,而扩大资产项目主要靠扩大负债项目中准备金规模提供资金。 ②美国财政部的补充融资计划,财政部滚动发行70天限期特别国债,将筹集 的资金存入专门账户,使存款增加,为美联储投放流动性和购买金融资产提供资金 支持。 ③在危机后期,美国终止了短期贷款,并主动削弱准备金存量,与银行、两 房等金融机构签署大规模的逆回购协议。将超额准备金改造为定期存款,同时在公
- 1、下载文档前请自行甄别文档内容的完整性,平台不提供额外的编辑、内容补充、找答案等附加服务。
- 2、"仅部分预览"的文档,不可在线预览部分如存在完整性等问题,可反馈申请退款(可完整预览的文档不适用该条件!)。
- 3、如文档侵犯您的权益,请联系客服反馈,我们会尽快为您处理(人工客服工作时间:9:00-18:30)。
次贷危机以来美联储资产负债表的变化作者:唐欣语发布时间:2009-05-04 09:33 来源:21世纪经济报道2007年下半年以来,美国次贷危机愈演愈烈,美联储为应对金融危机采取了大量拯救措施,为市场提供流动性,恢复市场信心。
这导致美联储资产负债表的规模与结构发生显著变化,本文欲予以分析。
危机发生前的2007年6月底,美联储资产负债表非常简洁:在资产方,联储持有的美国财政部证券占据大头(2007年6月底占比为87.9%);在负债方,流通中的货币占据大头(2007年6月底占比为90%),但金融危机改变了这一切。
联储资产负债表的规模迅速膨胀,总规模由2007年6月的8993亿美元上升到目前的21217亿美元,不到两年时间增长了1.36倍。
资产方的结构分析首先,美联储在减持美国财政部债券。
2007年6月底联储持有财政债券为7904亿美元,2009年4月8日为5055.2亿美元,减持了36%;相应地,财政债券在资产方的占比也从87.9%下降到目前的37.6%()。
联储减持财政债券,主要是因为通过公开市场操作投放的货币不具有指向性,而救市必须“专款专用”,因此它通过减持国债回笼资金,再通过其它专项计划投放给特定机构。
这可以理解为:联储一手通过多种创新工具向市场投放流动性,一手用卖出国债的方式回收流动性。
其次,新资产项目显著增多、数额巨大。
第一,在“证券”项目(附表1中1.1项)下,从2009年1月起开始设置“MBS(抵押贷款债券)”栏,用于反映联储收购的由房利美、房地美、吉利美担保的MBS。
该收购计划于2008年11月宣布,计划收购总量将达到MBS市场的1/9,即5000亿美元,意在提高MBS市场的流动性,压低MBS的利率,从而压低长期住房抵押贷款利率,重整楼市,促进美国经济复苏。
目前此项目余额为2364亿美元,占资产方余额的11.2%。
第二,新设“定期拍卖信贷”(Term Auction Credit)项目(附表1中1.3项),用于反映“定期拍卖便利”(Term Auction Facility,简称TAF)所投放的信贷。
2007年下半年次贷危机恶化时,美联储历次降低再贴现利率和联邦基金目标利率,并使二者的息差缩小到25个基点,旨在鼓励银行从贴现窗口(在资产负债表上表示为“一级信贷”、“次级信贷”和“季节性信贷”三者之和)融资。
联储从贴现窗口投放的资金大大增加,由2007年6月的1.49亿美元增加到2008年10月的最高值1119亿美元。
但从总量上看,传统的贴现窗口投放的信贷规模仍非常有限。
金融机构到联储申请再贴现,容易让市场对其支付能力产生怀疑。
为了减轻再贴现窗口的名誉影响,联储推出了TAF机制,该机制允许存款类金融机构使用更广泛的抵押品,通过拍卖机制获得联储的短期贷款。
此项目余额已达4672.77亿美元,占资产方余额的22%,成为流动性投放的重要渠道。
第三,在“其他信贷”栏目(附表1中1.4项)下新设4个栏目:2008年3月起开设“一级交易商信贷机制”栏目,用于反映“一级交易商信贷便利”所发放的信贷。
一级交易商提供合格的抵押品,以再贴现利率从联储获得隔夜拆借资金。
通过这一机制发放的信贷,在2008年10月达到最高值1476亿美元之后一直下降,至176亿美元左右,表明一级交易商资金紧张的局面已有所缓解。
2008年9月起开设“资产支持商业票据货币市场共同基金流动性工具”栏目,用于反映“资产支持商业票据货币市场共同基金流动性便利”(AMLF)所发放的信贷。
AMLF旨在为银行从货币市场共同基金购买资产支持商业票据(ABCP)提供资金。
通过AMLF机制发放的信贷在2008年10月达到最高值1458亿美元之后一直下降,至49亿美元左右,说明货币市场基金市场资金紧张的局面也已缓解。
2008年12月起开设“给AIG的贷款”栏目。
自2008年9月以来,美国政府四次对AIG施以援手,美联储给予贷款支持。
该项目目前余额为455亿美元,在资产方占比2.1%。
2009年3月起开设“定期资产支持证券贷款便利”(TALF)栏目,以反映TALF 发放的信贷。
TALF计划旨在向资产支持证券的持有者以这些证券作为抵押品发放贷款,这些抵押品范围比较宽泛,包括学生贷款、消费类贷款和小企业贷款支持的证券,此举意在提振消费者贷款。
此栏目首次出现(2009年3月25日)时余额为6.71亿美元,到2009年4月8日已提高至46.92亿美元,在资产方占比0.2%。
第四,新设“所持LLC的商业票据融资便利(简称CPFF)净额”栏目(附表1中1.5项),反映CPFF发放的信贷。
根据CPFF机制,联储设一个特殊目的机构(SPV),来向票据发行者购买无担保商业票据和资产担保商业票据,这意味着联储可以绕开金融机构直接对工商企业实施融资支持。
该项目目前余额为2506亿美元,在资产方占比为11.8%,成为投放流动性的一个重要渠道。
第五,新设“所持Maiden Lane LLC(共三家)资产净额”栏目(附表1中1.6项)。
Maiden Lane是美国拯救贝尔斯登的产物。
此项目目前余额为722亿美元,在资产方占比3.4%。
第六,“央行间货币互换”项目(附表1中1.7项)的金额迅速增加。
危机爆发以来,联储与14家外国中央银行签订了双边货币互换协议,这些国家央行从联储获得美元,并贷给国内的金融机构。
该项目金额在2008年12月达到最高值5827亿美元后逐渐下降,目前为3128亿美元,在资产方占比为14.7%。
负债方的结构分析美联储的资产负债表与一般企业一样,资产方反映资金的运用,负债方反映资金的来源。
美联储大举向市场投放流动性(即资产方膨胀)的行为引起了人们普遍的担忧。
但我们仔细分析其资产负债表,会发现情况并非如此。
首先,“流通中的货币”得到较好控制。
该项目余额由2007年6月的8097亿美元增长到目前的9012亿美元,增长了11%,与资产负债总规模增长了130%相比,增幅并不大。
可见美国并未真正大肆开动印钞机。
“流通中的货币”在负债方的占比从90%下降到42.5%,说明在负债方必然有其他项目提供了融资。
以下分析发现,靠的是美国财政部和金融机构大量增加在美联储的存款。
其次,新增“美国财政部补充存款账户”。
2008年9月联储与财政部达成协议,由美国财政部通过增发国债将筹措到的资金转入财政部在美联储新设立的“补充融资账户”中,这为联储提供了资金来源。
美国财政部在联储的存款(一般账户加补充账户)占负债方的比重从2007年6月的0.5%上升到2008年12月底的16.6%,目前为11.1%。
最后,储备余额(金融机构在联储的存款)迅猛增加,从2007年6月的72亿美元增加到目前的8386亿美元,增长了约116倍,在负债方的占比从0.8%上升到39.5%。
由于2008年10月联储宣布给存款机构的法定存款准备金和超额储备金账户付息,鼓励了银行将资金留在联储供其使用。
由此可以得到一个清晰的美联储筹集、运用资金的图景,即财政部将增发国债筹集到的资金存入联储,联储用各种创新工具投放到市场,金融机构则将得到的流动性通过超额储备的方式存回联储,从而使流动性留在了银行体系内。
这解释了为什么联储资产负债表规模急剧膨胀,“流通中的现金”却得到了较好的控制。
评价与展望因此,美国目前的定量宽松货币政策释放出来的现钞并不像想象的那么泛滥,美联储守住了货币的底线,货币供应量的增长还算温和(表2)。
2009年2月的M1、M2同比增量仅为13.66%和9.78%,这在危机时期并不算高,说明货币乘数低,商业银行信心尚未完全恢复,不愿意放款。
现在大家普遍关注的是:当信贷市场和经济开始复苏时,联储能否顺利完成非正常流动性工具的退出,将资产负债表的规模缩小到危机前的正常水平。
否则,势必引起通胀,给美国和世界经济带来灾难。
可喜的是,从目前伯南克的表态来看,他是有清醒认识的,“随着金融条件的正常化,我们会将贷款利率设定在对借款人越来越无吸引力的水平。
此外,一旦信贷市场条件实质上出现正常化,也必须逐步取消一些计划——这些计划是根据《联邦储备法》的第13条授权,即必须确认金融市场条件是‘异常和危机状态’才能采取的特殊计划。
”笔者也相信在信贷市场复苏后,联储资产负债表的规模显著缩小会很快完成。
而且,资产方的流动性投放工具大部分是短期的,随着信贷市场的改善,金融机构的资金需求自然会减少,这部分资产也会自然消失。
负债方的储备余额也会下降,直至资产负债表逐渐恢复正常。
现在评价美联储采取的危机应对措施为时尚早,但“非常时期需要有非常措施”,这为我们提供了新鲜的案例,值得进一步跟踪、观测。
FEDERAL RESERVE statistical releaseH.4.1Factors Affecting Reserve Balances of Depository Institutions andCondition Statement of Federal Reserve BanksApril 9, 20091. Factors Affecting Reserve Balances of Depository InstitutionsMillions of dollarsReserve Bank credit, related items, and Averages of daily figuresreserve balances of depository institutions at Week ended Change from week ended WednesdayFederal Reserve Banks Apr 8, 2009 Apr 1, 2009 Apr 9, 2008 Apr 8, 2009Reserve Bank credit 2,069,605 + 20,954 +1,203,081 2,068,836Securities held outright 796,917 + 23,420 + 236,100 801,353U.S. Treasury securities (1) 505,518 + 19,299 - 55,299 508,414Bills (2) 18,423 0 - 63,405 18,423Notes and bonds, nominal (2) 443,610 + 19,251 + 7,845 446,488Notes and bonds, inflation-indexed (2) 39,378 0 + 941 39,378Inflation compensation (3) 4,108 + 48 - 679 4,127Federal agency debt securities (2) 54,761 + 3,908 + 54,761 56,288Mortgage-backed securities (4) 236,638 + 214 + 236,638 236,651Repurchase agreements (5) 0 0 - 99,179 0Term auction credit 467,277 - 1 + 367,277 467,277Other loans 122,028 - 13,264 + 79,267 115,230Primary credit 49,159 - 10,576 + 38,977 48,335Secondary credit 64 + 64 + 64 62Seasonal credit 3 0 - 14 3Primary dealer and other broker-dealer credit (6) 17,600 - 1,888 - 14,962 13,400Asset-Backed Commercial Paper Money MarketMutual Fund Liquidity Facility 4,938 - 1,712 + 4,938 3,664Credit extended to American InternationalGroup, Inc. (7) 45,571 + 859 + 45,571 45,073Term Asset-Backed Securities Loan Facility 4,692 - 11 + 4,692 4,692Other credit extensions 0 0 0 0Net portfolio holdings of Commercial PaperFunding Facility LLC (8) 250,597 + 6,300 + 250,597 251,226Net portfolio holdings of LLCs funded throughthe Money Market Investor Funding Facility (9) 0 0 0 0Net portfolio holdings of Maiden Lane LLC (10) 26,344 + 49 + 26,344 26,398Net portfolio holdings of Maiden Lane II LLC (11) 18,391 - 67 + 18,391 18,227Net portfolio holdings of Maiden Lane III LLC (12) 27,476 - 171 + 27,476 27,350Float -2,283 + 4 - 1,576 -2,781Central bank liquidity swaps (13) 312,839 + 3,011 + 291,839 313,396Other Federal Reserve assets (14) 50,018 + 1,673 + 6,544 51,160Gold stock 11,041 0 0 11,041 Special drawing rights certificate account 2,200 0 0 2,200 Treasury currency outstanding (15) 38,870 + 14 + 177 38,870Total factors supplying reserve funds 2,121,716 + 20,968 +1,203,258 2,120,948Note: Components may not sum to totals because of rounding. Footnotes appear at the end of the table.1. Factors Affecting Reserve Balances of Depository Institutions (continued)Millions of dollarsReserve Bank credit, related items, and Averages of daily figuresreserve balances of depository institutions at Week ended Change from week ended Wednesday Federal Reserve Banks Apr 8, 2009 Apr 1, 2009 Apr 9, 2008 Apr 8, 2009Currency in circulation (15) 901,195 + 1,997 + 86,092 902,793 Reverse repurchase agreements (16) 66,057 - 3,429 + 27,140 66,972Foreign official and international accounts 66,057 - 3,429 + 27,140 66,972Dealers 0 0 0 0 Treasury cash holdings 316 + 5 - 38 321 Deposits with F.R. Banks, other than reserve balances 260,290 - 9,547 + 247,670 260,944 U.S. Treasury, general account 35,981 - 11,148 + 30,854 23,684U.S. Treasury, supplementary financing account 199,928 - 6 + 199,928 199,928Foreign official 1,135 + 25 + 1,037 1,617Service-related 4,428 - 2 - 2,617 4,428Required clearing balances 4,428 - 2 - 2,617 4,428Adjustments to compensate for float 0 0 0 0Other 18,818 + 1,583 + 18,468 31,287Other liabilities and capital (17) 55,229 - 245 + 10,400 55,221Total factors, other than reserve balances,absorbing reserve funds 1,283,086 - 11,221 + 371,263 1,286,251Reserve balances with Federal Reserve Banks 838,630 + 32,189 + 831,995 834,696Note: Components may not sum to totals because of rounding.1. Includes securities lent to dealers under the overnight and term securities lending facilities; referto table 1A.2. Face value of the securities.3. Compensation that adjusts for the effect of inflation on the original face value of inflation-indexedsecurities.4. Guaranteed by Fannie Mae, Freddie Mac, and Ginnie Mae. Current face value of the securities, which isthe remaining principal balance of the underlying mortgages.5. Cash value of agreements.6. Includes credit extended through the Primary Dealer Credit Facility and credit extended to certainother broker-dealers.7. Excludes credit extended to consolidated LLCs.8. Refer to table 7 and the note on consolidation accompanying table 10.9. Refer to table 8 and the note on consolidation accompanying table 10.10. Refer to table 4 and the note on consolidation accompanying table 10.11. Refer to table 5 and the note on consolidation accompanying table 10.12. Refer to table 6 and the note on consolidation accompanying table 10.13. Dollar value of foreign currency held under these agreements valued at the exchange rate to be used whenthe foreign currency is returned to the foreign central bank. This exchange rate equals the market exchange rate used when the foreign currency was acquired from the foreign central bank.14. Includes other assets denominated in foreign currencies, which are revalued daily at market exchange rates.15. Estimated.16. Cash value of agreements, which are collateralized by U.S. Treasury securities.17. Includes the liabilities of Commercial Paper Funding Facility LLC, the LLCs funded through the Money Market Investor Funding Facility, Maiden Lane LLC, Maiden Lane II LLC, and Maiden Lane III LLC to entities otherthan the Federal Reserve Bank of New York, including liabilities that have recourse only to the portfolioholdings of these LLCs. Refer to table 4 through table 8 and the note on consolidation accompanying table 10. Sources: Federal Reserve Banks and the U.S. Department of the Treasury.。