管理经济学托马斯版Chap004
管理经济学课件第四章 84页PPT文档
(二)生产函数:表示在一定时期内, 在技术水平不变的情况下,生产中所使 用的各种生产要素的数量与所能生产的 最大产量之间的关系。
如果用:
Q表示产量
L表示劳动
K表示资本
N表示土地
E表示企业家才能
1.生产函数 产量Q与生产要素L、K、N、E等投入存在着一定依存关系。 Q = f(L、K、N、E)--- 生产函数
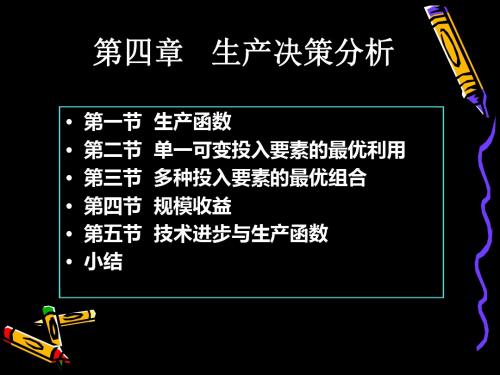
第四章 生产决策分析
• 第一节 生产函数 • 第二节 单一可变投入要素的最优利用 • 第三节 多种投入要素的最优组合 • 第四节 规模收益 • 第五节 技术进步与生产函数 • 小结
通过本章学习,要了解生产函数 的概念,掌握单一可变投入要素 的最优利用,掌握多种投入要素 最优组合,了解科布-道格拉斯 函数,规模经济。
厂商
1.厂商的组织形式. (1) 个人企业:单个人独资经营的厂商组织 。 (2)合伙制企业:两人以上合资经营的厂商 。 (3)公司制企业:按公司法建立和经营的具有法人资格的
厂商组织 。
2.交易成本:围绕着交易所产生的成本。
签约、监督和执行契约的成本。
签约时面临的偶然因素所带来的损失。 这些偶然 因素太多而无法写进契约。
E.平均产量曲线与边际产量曲线交于边际产 量曲线的最大值点上
三、单一要素连续投入的三个生产阶段
与边际报酬递减规律的3阶段有点区别:MP和AP最高点
Q
L不足
合 G K不足
理
B
区 域
TP
Ⅰ
ⅡⅢ
A
E F AP
O
L1 L2 L3
MP L
第一个阶段 平均产出递增,生产 规模效益的表现;
第二个阶段 平均产出递减,总产 出增速放慢;
经济学原理 Chap004
C H A P T E R4A p p l i c a t i o n s o fS u p p l y a n d D e m a n dCHAPTER OVERVIEW AND TEACHING TIPSIn Chapter 3 you explained the laws of supply and demand, and you familiarized students with the effects of changes in supply and demand. This leads naturally to the related question, “By how much?” How large are the responses to changes in the market, and on what does this responsiveness depend? This chapter introduces students to the concept of elasticity and exposes them to two types of elasticities: price elasticity of demand and price elasticity of supply. These concepts are difficult for students, particularly for those who have math anxiety. Emphasize the importance of percent-age changes in the numerator and denominator of the elasticity equations, and distinguish between price elasticity of demand and the slope of the demand curve. Do not hesitate to spend class time working through examples that illustrate the relationships between the price elasticity of demand and supply, and the demand and supply curves.The final section of the chapter provides students with the opportunity to apply market analysis and elasticity concepts in the arena of public policy-making. Distinguish carefully between the party who writes the check to the gov-ernment for a tax and the party who bears the economic burden of taxation. Just because taxes are often “paid” to the government by sellers does not mean that the sellers actually experience reduced incomes when new taxes are imposed. Price ceilings and price floors describe another type of government intervention into the operation of markets. LEARNING OBJECTIVES1.Define the term price elasticity of demand.2.Discuss the factors that determine whether price elasticity of demand is elastic, unitary-elastic, or inelastic, andcompare consumer behavior in the short run and the long run. Describe elastic and inelastic regions that exist along any demand curve.3.Calculate price elasticity of demand using a method of averages, ant interpret your result.4.Explain, using diagrams, the relationship between total revenue and price elasticity of demand.5.Define the term price elasticity of supply.6.Discuss the factors that determine whether price elasticity of supply is elastic, unitary-elastic, or inelastic, andcompare consumer behavior in the short run and the long run.7.Calculate price elasticity of supply using a method of averages, and interpret your result.8.Apply supply, demand, and elasticity concepts to the following situations and markets: (a) agriculture markets, (b)gasoline taxes, (c) minimum wages, and (d) energy price controls.SUGGESTED ANSWERS TO QUESTIONS IN THE TEXT1.A good harvest shifts a fairly inelastic supply curve to the right. Equilibrium moves down along a relativelyinelastic demand curve to support a (much) lower price, and hence lower farm revenues.2.More price elastic: perfume and ice cream because they are closer to luxuries than necessities; chocolate ice creamand automobiles because there are more substitutes for these goods than there are for ice cream and automobile tires, respectively.3.Demand would be inelastic, with E D= .5.4.Assume that demand and supply both show some price elasticity.a.Output and price up along supply curve (demand-curve shift), assuming apartments are normal goods.b.Output down and price (paid by renters) up along demand curve (supply shift).c.If this price is below equilibrium (which makes sense if the policy is to have an impact), this is a price ceiling,established to protect buyers. A shortage of apartments will result, with quantity demanded greater than quantity supplied.1516C HAPTER4: A PPLICATIONS OF S UPPLY AND D EMANDd.Output up and price down along demand curve (supply shift).e.Output down and price up along demand curve (supply shift).5.According to the text, a 10% increase in the minimum wage would decrease employment of teenagers between 1and 3 percent. The impact on the adult population is even smaller. Thus, income for teenagers and adults would rise. Thus, if I had to make a decision on increasing the minimum wage, and if raising wages for low-wage workers were important to me, I would certainly vote to increase the minimum.6.Minimum wages can increase the quantity of labor supplied and decrease the quantity of labor demanded. A bind-ing minimum wage therefore creates a surplus of labor. Price ceilings can have the opposite effect. A legal maximum interest rate can lead to a shortage of loanable funds, with lenders willing to supply fewer funds than demanders would like to borrow. See Figure 4-1 for an illustration of the impact of a minimum wage on the market for unskilled workers when the demand is relatively elastic for those workers. Area B is lost due to the minimum wage, area A is gained, resulting in smaller earnings overall.Figure 4-17.The $2000 tariff on imported automobiles will act like a tax in that market, shifting the supply curve to the left bythe amount of the tariff and resulting in lower quantities exchanged at a higher price. This will encourage con-sumers to substitute into autos produced by domestic firms, increasing the demand for those cars. The price and quantity exchanged of autos produced by domestic firms will rise, resulting in greater revenues for domestic automakers.8. a.Supply down by 5 percent with elasticity of 0.05 means that price must increase by 100 percent.b.Elasticity is a ratio of percentages; it is thus unitless.c.Supply down by 50 percent means that price must increase by 100 percent to keep the price elasticity equal to0.5. Crime should increase if addicts steal to feed their habits. A successful rehab program would shift demand in;quantity would fall by 50 percent and price would stay the same (the shifts would match).d.This policy would shift the supply of pork to the left, raising market prices. If, as argued in this chapter, thedemand for agriculture products is inelastic, higher prices will result in higher farm incomes.e.The income rectangle is larger after the minimum wage is increased. This tells us that the price elasticity ofdemand for unskilled workers if very low; changes in the wage have little impact on the quantity of these laborers demanded.9. a.See diagram.Figure 4-2C HAPTER4: A PPLICATIONS OF S UPPLY AND D EMAND17b.The vacancy rate will fall, there will be a shortage of apartments at the ceiling price.Figure 4-3c.The government might subsidize landlords in order to provide higher compensation for apartments.d.Rent controls limit the amount of compensation that landlords can receive for their property. This limits theirwillingness to maintain property, thus giving rise to the concerns of the European critic.10.The demand curve is given by P= 6.56 -.08Q, the supply curve is perfectly elastic at a price of $2.40 and then at aprice of $2.80. See diagram. The appropriate constant elasticity demand curve is Q = 87.2P-59.Figure 4-4DISCUSSION QUESTIONS1.Define the term elasticity. How does this concept help to explain the general shape and slope of a demand curve?2.True or false: The price elasticity of demand changes as price changes along a linear demand curve. Carefullyexplain your answer.3.I f price elasticity of demand changes along a demand curve, how can we say that a demand curve is relativelyelastic or inelastic? Explain.4.It is easy to understand why a large harvest of corn should lower the per unit price. Explain how that could actuallylower the total receipts farmers get from the corn harvest.5.Oil prices increased more than tenfold between 1973 and 1981 as a result of strategies employed by OPEC, an inter-national cartel. Are you surprised that even the richest societies chose to conserve their oil and related energy products? How might people conserve and economize when gasoline, heating fuels, and electricity have become more expensive per unit? How might the increase in gasoline prices in summer 2000 affect behavior?6.“Any demand curve is almost certain to have both an elastic and an inelastic range.” Can you give an exception? Isit realistic through the range of all prices and quantities?7.How does the introduction of the time element affect price elasticities of supply and demand?18C HAPTER4: A PPLICATIONS OF S UPPLY AND D EMAND 8.“Knowing how to calculate the slope of a straight line enables you to calculate the elasticity for any point on anycurve.” Discuss the relationship between price elasticity of demand and the slope of the demand curve.9.What is the difference between the price elasticity of demand and the price elasticity of supply?ernments interested in maximizing their total revenue have often taxed products like salt, tobacco, and alcohol.What does this suggest about the elasticity of demand for these goods? Why would they be good targets for taxation?11.Evaluate the following charge: If the government grants an industry a subsidy of $1 per unit and the price does notfall by the full $1, then the industry is cheating the consumer.12.Under what circumstances might black markets arise? What can be done about them? Are black markets necessari-ly bad?13.Suppose the government wishes to set a lower bound on the price of wheat. Compare and contrast the methods itcan use to achieve this goal with respect to the what, how, and for whom questions.14.Many economists are against minimum-wage laws. Discuss why a legal minimum wage set above equilibrium maylead to unemployment. How do the price elasticities of demand and supply help to determine the extent of this unemployment? Can people who earn lower wages be helped in ways that will not lead to unemployment? (Think about both sides of the market as you answer this question.)15.According to some estimates, the total revenues from the sale of pornography in Denmark declined by 25 percent inthe year immediately following the liberalization of the censorship laws. From this evidence, some sociologists have determined that legalizing this type of activity reduces the demand for it. Do you agree? Why or why not?What effects on the supply side might be deduced?16.What factors are likely to make demand for a commodity either elastic or inelastic? What factors are likely toinfluence elasticity of supply?17.How do you think a minimum-wage law might affect the market for unskilled labor? For skilled labor?ESSAY QUESTIONS1.The Brazilian government used to destroy a substantial portion of its coffee harvest to increase its revenue fromcoffee exports. What conditions are essential to make this type of policy economically beneficial for the country?2.A witness in a recent congressional hearing argued that consumers budgeted a fixed amount of expenditure for theproducts of his industry. Assuming his statements to be correct, what is the elasticity of demand for the industry’s products? Why?3.On a straight-line demand curve, point out the ranges where demand is elastic, inelastic, and unitary elastic. Whydoes the elasticity vary along a straight-line demand curve? Draw a graph that relates these regions to the slope of a total revenue curve.4.Consider two markets, the apple market and the orange market. Draw a supply-and-demand diagram for eachmarket. Indicate the equilibrium price and quantity of P0and Q0, respectively.a.I f there were an outbreak of an apple disease, illustrate the new equilibrium price and quantity in the applemarket by P1, Q1.b.How might this affect the orange market? Show these effects on your diagram.Redraw the original diagram for the apple market. Now suppose the government wishes to encourage the production of apples and gives the producers of apples a subsidy of x dollars per apple.c.Indicate the new equilibrium price and quantity in the apple market by P2, and Q2, respectively.d.Explain whether the equilibrium price will increase or decrease by more or less than the amount of the subsidyper apple.e.Shade in the total subsidy the government will pay to the apple industry each period.f.Describe how this subsidy will be shared between consumers and producers.5.The supply and demand curves for wheat are very inelastic. Those for sugar are very elastic. If a sales tax of $1 perunit is put on each of these goods, in which case will the incidence fall largely on the consumer and in which case largely on the producer? In which case is the revenue raised by the tax higher? Use diagrams to illustrate your answers.6.Elasticity is the same as slope. Comment on the validity of this statement.7.Explain the relationship between the elasticity of demand and revenue of a business.。
托马斯管理经济学课件第一讲课件

培养跨学科的思维方式,结合其 他领域的知识提高决策质量。
关注全球化和国际市场的动态, 拓展企业的国际视野和竞争力。
THANKS
感谢观看
资源配置和生产决策
资源配置的原则和方法
原则
效率、公平和经济可行性。
方法
市场机制、计划配置、混合经济等。
生产决策的制定和优化
制定
根据市场需求、企业目标和技术条件 确定生产计划。
优化
通过生产要素的最佳组合实现成本最 小化或利润最大化。
生产效率和生产力的提升
效率
投入与产出之间的比例,低投入 高产出。
02
它探讨如何利用稀缺资源,通过合理配置和有效利用,实现企
业经济效益的最大化。
管理经济学融合了微观经济学、宏观经济学、计量经济学等学
03
科的理论和方法,为企业经营提供科学的决策依据。
管理经济学的重要性
管理经济学有助于企业制定合理的战 略规划和经营策略,提高市场竞争力。
管理经济学为企业提供了一种系统化 的决策方法,有助于减少决策中的主 观性和盲目性,降低经营风险。
管理经济学对于培养企业经营 管理人才、提高企业经济效益 具有重要意义。
课程目标
掌握管理经济学的基 本概念、原理和方法。
培养创新思维和批判 性思维,提高综合素 质。
学会运用管理经济学 理论分析实际问题, 提高解决实际问题的 能力。
02
管理经济学概述
管理经济学的定义
01
管理经济学是一门研究如何将经济学原理和方法应用于企业管 理决策的学科。
响。
管理经济学未来的发展趋势
1
更加注重跨学科的研究,如心理学、社会学等究数字化和人工智能对管理经济学的影响, 以及如何运用新技术提高企业效率和竞争力。
管理经济学托马斯版Chap.ppt

Y M PX X PY PY
5-13
Consumer’s Budget Constraint
(Figure 5.5)
5-14
Typical Budget Line (Figure 5.6)
• M A
PY Y M PX X PY PY
Quantity of Y
•B
M
Quantity of X
• Substitution effect • Income effect
5-25
Substitution & Income Effects
• Substitution effect
• Change in consumption of a good after a change in its price, when the consumer is forced by a change in money income to consume at some point on the original indifference curve
• Nonsatiation
• More of a good is always preferred to less
5-5
Utility
• Benefits consumers obtain from goods & services they consume is utility
• A utility function shows an individual’s perception of the utility level attained from consuming each conceivable bundle of goods
Thomas12e_Chapter3托马斯管理经济学章

06
托马斯管理经济学 的实践意义和价值
对企业管理的指导作用和实践意义
帮助企业制定合理的战略规划 提高企业的市场竞争力 优化企业的资源配置 提高企业的经济效益
对政府政策制定和公共管理的启示和借鉴价值
政府政策制定:借鉴托马斯管理经济学的理论和方法制定更加科学、有效 的政策。
公共管理:借鉴托马斯管理经济学的理论和方法提高公共管理的效率和质 量。
对学术界产生了 深远的影响推动 了管理经济学的 发展
感谢观看
汇报人:
企业社会责任和可持续发展
企业社会责任:关 注环境保护、员工 福利、社会责任等
方面的问题
可持续发展:关注 企业的长期发展注 重资源的合理利用
和环保
社会责任和可持续 发展的关系:社会 责任是实现可持续
发展的重要手段
企业社会责任和可 持续发展的应用: 在企业管理中注重 社会责任和可持续 发展可以提高企业 的竞争力和形象促 进企业的长期发展。
管理经济学与心理学的交叉研究:探讨管理者的心理因素对经济决策的影响
管理经济学与计算机科学的交叉研究:利用大数据和人工智能技术提高经济决策的准确性和 效率
管理经济学与环境科学的交叉研究:关注经济活动对环境的影响寻求可持续发展的解决方案
管理经济学与金融学的交叉研究:探讨金融市场对经济决策的影响以及如何利用金融工具进 行风险管理
市场需求:消费者对环保和绿色产品 的需求为企业提供市场机会
绿色发展:企业需要采用环保技术和 生产方式提高资源利用效率
社会责任:企业需要承担社会责任关 注环境保护和可持续发展
政策支持:政府对环保和绿色发展的支 持为企业提供政策支持和激励
投资机会:环保和绿色发展领域的投 资机会为企业提供新的投资方向
管理经济学托马斯版Chap005.pptx

Chapter 5: Theory of Consumer Behavior
McGraw-Hill/Irwin
The Consumer’s Optimization Problem
MU U X
5-12
Consumer’s Budget Line
• Shows all possible commodity bundles that can be purchased at given prices with a fixed money income
M PX X PYY
or
Quantity of Y
Indifference Map (Figure 5.4)
IV III II I
Quantity of X
5-11
Marginal Utility
• Addition to total utility attributable to the addition of one unit of a good to the current rate of consumption, holding constant the amounts of all other goods consumed
• Individual consumption decisions are made with the goal of maximizing total satisfaction from consuming various goods and services
• Subject to the constraint that spending on goods exactly equals the individual’s money income
管理经济学 第四章
Scatter Diagram
Prepared by Robert F. Brooker, Ph.D.
Regression Analysis
• Regression Line: Line of Best Fit • Regression Line: Minimizes the sum of the squared vertical deviations (et) of each point from the regression line. • Ordinary Least Squares (OLS) Method
Estimation Procedure
n
ˆ b=
∑(X
t =1 n t =1
t
− X )(Yt − Y )
t
ˆ ˆ a = Y − bX
∑(X
− X)
2
Prepared by Robert F. Brooker, Ph.D.
Copyright ©2004 by South-Western, a division of Thomson Learning. All rights reserved.
Copyright ©2004 by South-Western, a division of Thomson Learning. All rights reserved.
Slide 12
Tests of Significance
Example பைடு நூலகம்alculation
Time
1 2 3 4 5 6 7 8 9 10
Prepared by Robert F. Brooker, Ph.D.
Copyright ©2004 by South-Western, a division of Thomson Learning. All rights reserved.
管理经济学托马斯版Chap005

•Z •B •N •16 •20 •24 00 0
•Quantity of X
•Panel A – Changes in money income
•A •100
•C
•B
•D
•12
•20
•25
5
0
0
•Quantity of X
•Panel B – Changes in price of X
•Px=$5
•20
0 •Quantity of X
•Demand for X
•50•65 •90
•Quantity of X
•Price of X ($)
Market Demand & Marginal Benefit
• List of prices & quantities consumers are willing & able to purchase at each price, all else constant
• Substitution effect • Income effect
Substitution & Income Effects
• Substitution effect
• Change in consumption of a good after a change in its price, when the consumer is forced by a change in money income to consume at some point on the original indifference curve
•
3 •= •5
•+ •(-2)
- 1、下载文档前请自行甄别文档内容的完整性,平台不提供额外的编辑、内容补充、找答案等附加服务。
- 2、"仅部分预览"的文档,不可在线预览部分如存在完整性等问题,可反馈申请退款(可完整预览的文档不适用该条件!)。
- 3、如文档侵犯您的权益,请联系客服反馈,我们会尽快为您处理(人工客服工作时间:9:00-18:30)。
Chapter 4: Basic Estimation Techniques
McGraw-Hill/Irwin
Basic Estimation
• Parameters
Performing a t-Test
• First determine the level of significance
• Probability of finding a parameter estimate to be statistically different from zero when, in fact, it is zero
Yˆ aˆbˆX
Sample Regression Line
(Figure 4.2)
Sales (dollars)
S
70,000 60,000 50,000 40,000 30,000 20,000 10,000
0
•• •
SSii=6600,,000000
•
ei
•
•
SˆiŜi =464,367,3676
zero)
• Slope parameter (b) gives the change in Y associated with a one-unit change in X:
bY X
Simple Linear Regression
• Parameter estimates are obtained by
Unbiased Estimators
• An estimator is unbiased if its average value (or expected value) is equal to the true value of the parameter
Relative Frequency Distribution*
choosing values of a & b that minimize the
sum of squared residuals
• The residual is the difference between the actual
and fitted values of Y: Yi – Ŷi
• The sample regression line is an estimate of the true regression line
Regression Analysis
• Regression analysis
• A statistical technique for estimating the parameters of an equation and testing for statistical significance
the true values of a & b
• â& bˆ are random variables computed using
data from a random sample
• The distribution of values the estimates might take is centered around the true value of the parameter
(Figure 4.3)
R elativefrequencyofb ˆ
1
R elativeFreq u en cyD istrib u tion *
forbˆw h enb5
0
1 2 3 4 5 6 7 8 9 10
L e a s t-s q u a re s e s tim a te o fb (b ˆ)
• The coefficients in an equation that determine the exact mathematical relation among the variables
• Parameter estimation
• The process of finding estimates of the numerical values of the parameters of an equation
*Also called a probability density function (pdf)
Statistical Significance
• Must determine if there is sufficient statistical evidence to indicate that Y is truly related to X (i.e., b 0)
Simple Linear Regression
• Simple linear regression model relates dependent variable Y to one independent (or explanatory) variable X
YabX
• Intercept parameter (a) gives value of Y where regression line crosses Y-axis(value of Y when X is
• Probability of a Type I Error
•
Sample regression line Ŝi = 11,573 + 4.9719A
2,000
4,000
6,000
8,000
A
10,000
Advertising expenditures (dollars)
Unbiased Estimators
• The estimates â& bˆ do not generally equal
• Eveple will produce an estimate bˆ that is
different from zero
• Test for statistical significance using
t-tests or p-values