
德国Zahner IM6e电化学工作站操作手册
Ivium电化学工作站中文操作手册

Ivium 电化学工作站中文操作手册
2
五 标准方法控制模式…………………………………………………………………………………23 1. 标准方法控制模式………………………………………………………………………………23 2. 测量的顺序………………………………………………………………………………………23 3. 方法列表…………………………………………………………………………………………23 4. 测量结果…………………………………………………………………………………………24 5. 图形选项…………………………………………………………………………………………25 6. 图例说明窗………………………………………………………………………………………25 7. 数据显示工具菜单………………………………………………………………………………26 8. 图形工具单………………………………………………………………………………………27 9. 图形弹出式菜单…………………………………………………………………………………29 10. 测量结果数据列表………………………………………………………………………………29 11. 文件菜单…………………………………………………………………………………………30 12. 选项菜单…………………………………………………………………………………………30 13. 工具菜单…………………………………………………………………………………………31 14. 帮助菜单…………………………………………………………………………………………32
EIS测试和数据的导出

IM6e电化学阻抗谱测试及数据处理Liu XiaoQun2008.10电化学阻抗谱:EIS (Electrochemical Impedance Spectroscopy)IM6e 仪器参数:测试频率:10u~1MHZ 电流:±100nA~±2A交流电压: 1mV~1V; 测试电压: 小于10v专用鼠标按键功能:点击左键:表确认(有时与键盘中的“Enter回车”键同效)中键:退出,或返回至上一层目录/面版右键:load数据时使用来选中需要的文件。
EIS测试操作步骤:一、开机进入主面版:开机:打开与电化学工作站相连接的电脑→打开电化学工作站位于仪器后面的开关。
打开测试软件:双击桌面上的测试软件快键方式 ,稍后进入以下界面:输入“D”,进入“Thales”软件,稍后出现Thales引导界面:点击左键确认,进入以下界面:二、EIS测试:1、线路连接和校准1)线路连接选择“EIS”,进行EIS控制面版:点击“check cell connection”设置线路连接面版,根据样品要求进行线路连接。
每次测试前必须检查连线,确保正确后才能进行测试。
通常是否加buffer由电池开路电压决定,当开路电压<4.0V时,不加buffer测试;当开路电压>4.0V时,加buffer测试。
2-Electrode 电池,对称电池,膜片等3-Electrode 三电极电池连线方式一:2-Electrode no buffe r双电极(不使用缓冲器)连线:IM6e 电化学池连接Test Electrode Power Output 到Working Electrode (电池正极)连接Test Electrode Sense Input 到 WorkingElectrode(电池正极)Electrode(电池负极)连接Reference Electrode input 到 CounterElectrode(电池负极)连接Counter Electrode Output 到 Counter点击“2-Electrode with buffer ”,按以上图示连线,检查正确后按中键退出。
电化学工作站(简易说明)
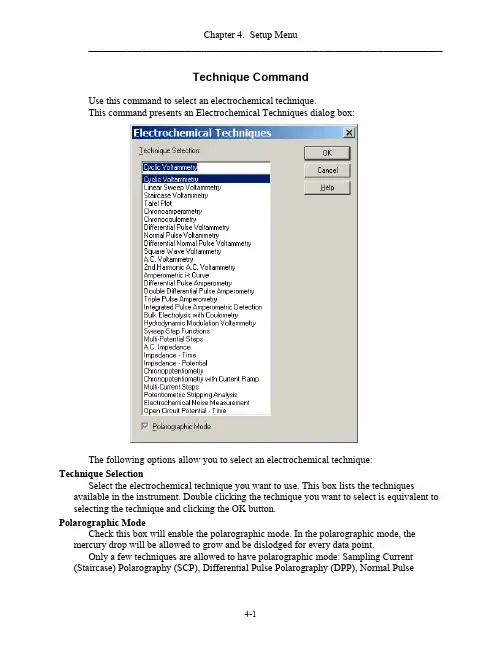
________________________________________________________________________Technique CommandUse this command to select an electrochemical technique.This command presents an Electrochemical Techniques dialog box:The following options allow you to select an electrochemical technique:Technique SelectionSelect the electrochemical technique you want to use. This box lists the techniques available in the instrument. Double clicking the technique you want to select is equivalent to selecting the technique and clicking the OK button.Polarographic ModeCheck this box will enable the polarographic mode. In the polarographic mode, the mercury drop will be allowed to grow and be dislodged for every data point.Only a few techniques are allowed to have polarographic mode: Sampling Current (Staircase) Polarography (SCP), Differential Pulse Polarography (DPP), Normal Pulse________________________________________________________________________ Polarography (NPP), Differential Normal Pulse Polarography (DNPP), A.C. Polarography (ACP), and Second Harmonic A.C. Polarography (SHACP).Once polarographic mode is enabled, stripping mode is disabled. In order to set stripping mode by using the Stripping Mode command in Control Menu, you have to uncheck the polarographic mode.This command has a toolbar button:________________________________________________________________________Parameters CommandUse this command to set experimental parameters.This command presents a Parameter dialog box so you can select the parameters you want to use.Depending on the technique, the parameters dialog box will be different. The followings are the parameters for different techniques:Parameters for Cyclic VoltammetryParameters for Linear Sweep VoltammetryParameters for Sampled Current VoltammetryParameters for Tafel PlotParameters for ChronoamperometryParameters for ChronocoulometryParameters for Differential Pulse VoltammetryParameters for Normal Pulse VoltammetryParameters for Differential Normal Pulse VoltammetryParameters for Square Wave VoltammetryParameters for A.C. VoltammetryParameters for 2nd Harmonic A.C. VoltammetryParameters for Amperometric i-t CurveParameters for Differential Pulse AmperometryParameters for Double Differential Pulse AmperometryParameters for Triple Pulse AmperometryParameters for Integrated Pulse Amperometric DetectionParameters for Bulk Electrolysis with CoulomteryParameters for Hydrodynamic Modulation VoltammetryParameters for Sweep-Step FunctionsParameters for Multi-Potential StepsParameters for A.C. ImpedanceParameters for Impedance - TimeParameters for Impedance - PotentialParameters for ChronopotentiometryParameters for Chronopotentiometry with Current RampParameters for Multi-Current StepsParameters for Potentiometric Stripping AnalysisParameters for Open Circuit Potential - TimeFor details of the parameters of each technique, see the description of individual dialog box of related techniques.This command has a toolbar button:________________________________________________________________________Parameters for Cyclic VoltammetryIn Cyclic Voltammetry (CV), potential is scanned from Init E toward either High E or Low E depending on the Init P/N. The potential will then scan back. The following diagram shows the potential waveform applied as the function of time. The current is recorded as the function of potential.The following are the experimental parameters, their range and descriptions:Parameters Range Description Init E (V)-10 - +10Initial potential High E (V)-10 - +10High limit of potential scan Low E (V)-10 - +10Low limit of potential scan Init P/NPositive or Negative Initial scan direction Scan Rate (V/s)1e-6 - 20000Potential scan rate Sweep Segments1 - 1000000Sweep segments, each segments is half cycle Sample Interval (V)1e-6 - 0.064Data sampling interval Quiet Time (sec)0 - 100000Quiescent time before potential scan Sensitivity (A/V)1e-12 - 0.1Sensitivity scale Auto SensCheck or Uncheck Automatic sensitivity switching during run Scan Complete CyclesCheck or Uncheck Scan complete cycles Auxiliary SignalRecordingCheck or Uncheck Simultaneously external signal recording when the scan rate is less than 0.25V/sNotes:P o t e n t i a l (V )Init ETime (s)High EScan Rate (V/s)Segment 1Segment 2Segment 3Low E________________________________________________________________________1.High E and Low E should be at least 0.01 V apart.2.If unreasonable High E and Low E are entered, the system will automatically readjust them.3.Depending on the Init E, High E and Low E value, the system will automatically readjust initial scan direction.4.The maximum potential scan range is 13.1V.5.The potential increment is 0.1 mV if the scan rate is below 500 V/s. The potential increment is 1 mV at the scan rate of 5000 V/s, and 4 mV at 20000 V/s.6.The sample interval can be 1 mV When the scan rate is below 1000 V/s. The sample interval is 2 mV at the scan rate of 2000 V/s, 5 mV at 5000 V/s, and 20 mV at 20000 V/s. If the scan rate is high, the data sampling interval will be automatically increased.7.When large number of sweep segments are involved, the data sampling interval will be automatically increased up to 0.02V. If the scan rate is higher than 0.5V/s, the number of sweep segments will be limited by the memory size (64000 points). If the scan rate is below 0.5V/s, the maximum data length set by the System command will take effect. When the scan rate is low, the specified sweep segments will be executed, but only limited number of segments will be stored. Large sweep segments might be useful for conditioning of electrodes.8.When scan rate is below 0.01 V/s, the sensitivity scale during run can be automatically switched according to the current level. When it is activated, the sensitivity selection will have no effect on the measurement. However, the automatic sensitivity switching range will be from 1e-8 - 0.1 A/V, instead of 1e-12 - 0.1 A/V. The Picoamp Booster will not work either. In order to select higher sensitivities, automatic sensitivity switching option needs to be disabled.9.Scan Complete Cycles will only work for Sweep Segments at 3, 5, 7, 9, (odd numbers) and if Initial E is different from High E and Low E. When it works, the last segment will stop at Initial E instead of High E or Low E.10.If the scan rate is lower than 0.25V/s, it is possible to record external voltage signal (such s spectroscopic signal) simultaneously with the voltammogram. Use the 9-pin D-connector on the real panel for signal input. Check the User's Manual for the pin-out and signal level requirements.________________________________________________________________________Parameters for Linear Sweep VoltammetryIn Linear Sweep Voltammetry (LSV), potential is scanned from Init E toward Final E.The following diagram shows the potential waveform applied as the function of time. The current is recorded as the function of potential.The following are the experimental parameters, their range and descriptions:Parameters Range Description Init E (V)-10 - +10Initial potential Final E (V)-10 - +10Final potential Scan Rate (V/s)1e-6 - 20000Potential scan rate Sample Interval (V)1e-6 - 0.064Data sampling interval Quiet Time (sec)0 - 100000Quiescent time before potential scan Sensitivity (A/V)1e-12 - 0.1Sensitivity scale Auto SensCheck or Uncheck Automatic sensitivity switching during run Auxiliary SignalRecording Check or Uncheck Simultaneously external signal recording when the scan rate is lessthan 0. 25V/sNotes:1.Init E and Final E should be at least 0.01 V apart.2.The maximum potential scan range is 13.1 V.3.When the scan rate is high, the data sampling interval will be automatically increased.P o t e n t i a l (V )Init ETime (s)Final EScan Rate (V/s)4.The potential increment is 0.1 mV if the scan rate is below 500 V/s. The potential increment is 1 mV at the scan rate of 5000 V/s, and 4 mV at 20000 V/s.5.The sample interval can be 1 mV When the scan rate is below 1000 V/s. The sample interval is 2 mV at the scan rate of 2000 V/s, 5 mV at 5000 V/s, and 20 mV at 20000 V/s. If the scan rate is high, the data sampling interval will be automatically increased.6.When scan rate is below 0.01 V/s, the sensitivity scale during run can be automatically switched according to the current level. When it is activated, the sensitivity selection will have no effect on the measurement. However, the automatic sensitivity switching range will be from 1e-8 - 0.1 A/V, instead of 1e-12 - 0.1 A/V. The Picoamp Booster will not work either. In order to select higher sensitivities, automatic sensitivity switching option needs to be disabled.7.If the scan rate is lower than 0.25V/s, it is possible to record external voltage signal (such s spectroscopic signal) simultaneously with the voltammogram. Use the 9-pin D-connector on the real panel for signal input. Check the User's Manual for the pin-out and signal level requirements.8. Linear polarization resistance plot can be obtained by the Special Plots command under the Graphics menu.Parameters for Tafel PlotIn Tafel Plot (TAFEL), potential is scanned from Init E toward Final E. The potential may be scanned back. The following diagram shows the potential waveform applied as the function of time. The logarithm of current is recorded as the function of potential.The following are the experimental parameters, their range and descriptions:Parameters Range Description Init E (V)-10 - +10Initial potential Final E (V)-10 - +10Final potential Sweep Segments1 - 2Sweep segments, each segments is half cycle Hold Time at Final E (s)0 - 100000Potential hold time atfer 1st sweep segent Scan Rate (V/s)1e-6 - 0.1Potential scan rate Quiet Time (sec)0 - 100000Quiescent time before potential scan Sensitivity (A/V)1e-12 - 0.1Sensitivity scale Auto Sens Check orUncheck Automatic sensitivity switching during runNotes:1.Init E and Final E should be at least 0.01 V apart.2.Corrosion rate calculation can be obtained by Special Analysis command under the Analysis menu.P o t e n t i a l (V )Init ETime (s)Final EScan Rate (V/s)Segment 1Segment 2Hold TimeSystem CommandUse this command to set up the serial communication port, current polarity, potential axis and current axis.This command presents a System Setup dialog box:The following options allow you to set up your system:Communication PortSelect the communication port to link the PC to the instrument.Com Port SpeedSelect the communication port speed to link the PC to the instrument. Standard is guaranteed to work with any computer. Fast may or may not work with a particularcomputer. When Fast is chosen, the real time data transfer will be done at higher scan rate or shorter sample interval.Current PolarityYou can either select cathodic current as positive current or anodic current as positive current. You should set this before experiment, otherwise the experimental results (peaks and waves) will not be reported properly.________________________________________________________________________ Potential AxisYou can set positive potential axis either left or right. This is meaningful only for voltammetric or polarographic modes.Current AxisYou can set positive current axis either up or down.Line FrequencySet line frequency according to what is applied. This helps set default sample interval in certain techniques to reduce the interference from the line frequency.Windowsif you are using English Windows, please choose English. If you are using Chinese, Japanese, or Korean Windows, check Oriental. Oriental Windows shows slightly bigger letters than English Windows. The Technique selection field may be truncated if you select English Windows. Also oriental Windows does not support certain symbols. For instance, symbol "µ" will not be displayed properly. Choose oriental Windows will use "u" instead of "µ".Data LengthThe default data length is 128K. The longer the data length, the more computer resource will be used. It is recommended not to use long data length unless necessary. Using long data length will need large computer memory such as 256M, 512M RAM or more. It will also slow down the system and prohibit other programs to run.After you change the data length setting in the System Setup command, please exit the program and restart the program so that the data length can be set properly. Otherwise the program may crash.If the data is acquired and saved with long data length setting, but read back with shorter data length setting, the program may crash. Therefore once you used long data length setting, you should not set to shorter data length later. Please think carefully before you decide to increase the data length.Save retrieve data during runCheck this option will allow data to be saved on the hard drive during run. In case experiment does not complete due to external interference or interruption, misscommunication, partial data can be recovered. This is useful for very slow experiments.Hours of experimental data can be recovered.This option is not active by default. If you do not run very slow experiments, you can re-run the experiment if the experiment is interrupted by accident.To retrieve experimental data of last run, you should use Retrieve command under the File menu.Present Data Override WarningIf your experimental data is not saved before running a new experiment or opening an existing file on the disk, your unsaved data will be overridden. This option will allow system to issue a warning before the data is lost.Save Text File As WellNormally only binary data files is saved. Binary file contains more information (including experimental control information) but small in size. This option allows you to________________________________________________________________________ save text file as well whenever you save the binary data. This is useful for those who want toexport data to other software, such as spreadsheet software.Erase ADC Calibration CoefficientsThe analog-to-digital converter (ADC) calibration coefficients are stored in the instrument non-volatile memory. ADC calibration is carried out in CH Instruments before the instrument is shipped. You use this command only if you want to recalibrate the ADC. After you erase ADC calibration coefficients, you will see a prompt of ADC calibration when you run next hardware test or experiment.________________________________________________________________________Hardware Test CommandUse this command to test the system hardware. The system will test digital and analog circuitry.After the test, the system will display the Hardware Test Results dialog box:Digital Circuitry TestThe software version and the last revision date for the Flash ROM is shown.Potential and current offset testIf test is failed, the error message will be given.Sensitivity scale testIf test is failed, the error message will be given. Most times the error is related to leakage current.Gain testThere are 3 gain stages. If test is failed, the error message will be given.Analog Test SummaryThe test results of analog circuitry are summarized. A message of “Analog circuitry test OK.” will appear if no error is detected, otherwise an error message will appear. In case there is error and the cause is due to the analog-to-digital converters, it will also be reported.If you see analog test error, please repeat the test several times and see if the error is consistent. Record the error message and contact the factory for servicing._____________________________________________________________________________________Open Circuit Potential CommandUse this command to measure the open circuit potential.The open circuit potential is the potential between the working electrode and reference electrode while no current flows through the cell. This is an important parameter. It tells you what is the initial state before you start experiment. You can then figure out if the compound under study is oxidizable or reducible.After the measurement, the system will display the open circuit potential value through the Open Circuit Potential dialog box. Click OK to close the dialog box after you read it._____________________________________________________________________________________iR Compensation CommandUse this command to test the solution resistance and the cell time constant, as well as to enable or disable automatic or manual iR compensation.This command presents an iR Compensation dialog box:The following options allow you to set iR compensation parameters:iR Comp Test ResultsIf you click the iR Test button, the system will engage solution resistance and cell time constant test. The result will be reported here.After that the system will test the stability by gradually increase the compensation level until the desired compensation level is reached or if the system is no longer stable. The actually allowed compensation level and the uncompensated resistance will be displayed.The uncompensated resistance is calculated from the measured resistance and the allowed compensation level.Please note that the maximum allowed resistance compensation may also be limited to the feedback resistor of the i/E converter.iR Comp TestBefore start iR compensation test, you should check the test parameters.Test E is the test potential where no electrochemical reaction will occur. When the system is doing test, it applies a potential step around the test potential. The test result is good only if the electrochemical cell can be equivalent to a solution resistance in series witha double layer capacitor. The range of Test E is -10V - +10V.You may adjust the potential step amplitude. The larger the amplitude, the higher the signal-to-noise ratio. However, too large amplitude may cause faradaic current to flow. A step amplitude of 0.05V is recommended. The range of Step Amplitude is 0.01 - 0.25 V._____________________________________________________________________________________ The compensation level is the percentage of resistance you want to compensate based on the measured solution resistance. The range of this parameter is 0 - 200%. The default value is 100%.Overshoot level is the criterion of the stability test. As the amount of positive feedback increases, the system might become unstable. Before the potentiostat start to oscillate, the overshoot in current response to the potential pulse will appear. The higher the allowedovershoot level, the higher the possible compensation level, but the worse the systemstability. The range of this parameter is 0 - 100%. The default level is 2%.If you click the iR Test button, the system will engage solution resistance and stability test. The result will be reported in the iR Comp Test Results Box.For more details about the iR compensation, please see “Intelligent, Automatic Compensation of Solution Resistance”, P. He, and L. R. Faulkner, Anal. Chem., 58, 517-523 (1986).iR Compensation for Next RunWhen this box is checked, the iR compensation for next run is enabled. You may not be able to enable iR compensation if the automatic compensation is set and the iR compensation test has not been conducted or the sensitivity scale has been altered. This option can also be turned on or off from Run Status command under Control menu.iR Comp EnableIf the option "Once" is chosen, the iR compensation will only be applied to next run and then disabled. If you want the same compensation conditions to be applied to the consecutive runs, choose "Always" option. Click the proper radio button to select the option.iR Comp ModeYou can choose automatic iR compensation or manual iR compensation. The automatic iR compensation will be based on the iR compensation test results. You can also choose manual iR compensation by entering the resistance value you want to compensate. Click the proper radio button to select the option.Manual Compensation ResistanceIf you select manual iR compensation, you should enter the resistance value that you want system to compensate. Be careful about the compensation level. If the compensation level is close or exceeds the actual solution resistance, the potentiostat will oscillate. Please also notice that the maximum allowed resistance compensation may be limited to thefeedback resistor of the i/E converter.This parameter has no effect if automatic iR compensation is selected.This command has a toolbar button:。
电化学工作站Parstat2263操作指南
电化学工作站Parstat2263操作指南一:电化学工作站简介电化学工作站是集电化学分析方法于一体的电化学通用仪器。
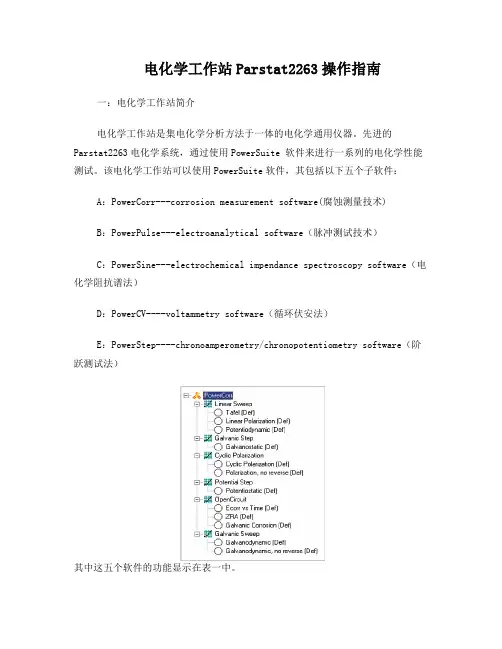
先进的Parstat2263电化学系统,通过使用PowerSuite 软件来进行一系列的电化学性能测试。
该电化学工作站可以使用PowerSuite软件,其包括以下五个子软件:A:PowerCorr---corrosion measurement software(腐蚀测量技术)B:PowerPulse---electroanalytical software(脉冲测试技术)C:PowerSine---electrochemical impendance spectroscopy software(电化学阻抗谱法)D:PowerCV----voltammetry software(循环伏安法)E:PowerStep----chronoamperometry/chronopotentiometry software(阶跃测试法)其中这五个软件的功能显示在表一中。
表一:五个子软件的功能二:电化学工作站对样品的要求电化学工作站一般把样品做成空气电极并采用三电极体系方式进行测量,并要求正确连接三电极体系,其步骤如下:a:将制备的空气电极(工作电极)安装到模具上,注意透气层在外,并固定好螺丝。
b:将配置好的35%KOH溶液倒入到模具内,要求溶液的液面高于工作电极上表面。
c:将辅助电极(铂电极)和参比电极(银/氯化银电极)插入到含35%KOH的电解液的模具内。
(注意:两电极间的距离、及与工作电极间的距离及位置)d:将绿色的电线所带的鳄鱼夹WE(即工作电极)和土色线SE(辅助工作电极)同时连接到空气电极上。
将银/氯化银参比电极连接到白色线连接的鳄鱼夹RE参比电极上将铂电极连接到红色线连接的鳄鱼夹CE辅助电极上。
三:电化学工作站操作1:把电话学工作站通过数据线连接到电脑主机USB接口上。
2:将电化学工作站接地,即将黑线所连接的鳄鱼夹通过导线连接到地上。
Reference 600 电化学工作站操作说明书

Reference 600 电化学工作站操作说明书目录一、Gamry Framework二、循环伏安测量(Cyclic Voltammetry)三、电化学阻抗谱测量(Electrochemical Impedance Spectroscopy)四、直流腐蚀测量(DC corrosion)五、脉冲伏安测量(Pulse Voltammetry)附录:Reference 600 电化学工作站快速入门指南一、Gamry Framework1.0 主菜单●Experiment:已安装的软件包;最近运行的实验;运行指定脚本。
●File和Edit:属于常用菜单,在此不再作说明。
●Analysis:启动Gamry Echem Analyst进行数据分析。
●Options:定制Framework设置。
①Path:定制Framework存取文件路径。
②Editor:定制在Framework编辑器窗口移位键的宽度;设置恢复编辑器状态选项。
③Editor Font:Framework编辑器窗口字体。
④Setup Font:Framework设置对话框字体。
⑤View Device Status Bar:选中View Device Status Bar则显示设备状态栏。
绿色指示器表示仪器可用,橘黄色指示器表示仪器正在使用中。
●Windows:控制编辑器和运行窗口在Framework中的显示。
1.1运行窗口(Runner Windows)●F2-Skip:通常实验完成后按F2-Skip关闭运行窗口,其快捷键为F2。
●F1-Abort:取消实验,其快捷键为F1。
●F3-Pause:暂停实验,其快捷键为F3。
●F3-Continue:撤消暂停。
●Curve List:控制显示在运行窗口中的曲线,大多数实验并不只产生一条曲线。
1.3 设置控制按钮(Setup Control Buttons)●Default:恢复所有参数为默认值。
flottweg s6e操作手册

《Flottweg S6E 操作手册:全面解读与使用指南》1. 前言在工业领域,离心机是一种常见的分离设备。
而 Flottweg S6E 系列离心机作为离心机行业的领军产品,其性能和操作性备受瞩目。
本文将深入探讨 Flottweg S6E 离心机的操作手册,帮助读者全面了解并掌握其使用方法。
2. Flottweg S6E 操作手册概述Flottweg S6E 操作手册是一本全面的使用指南,旨在帮助用户正确、安全地操作离心机。
手册包含了离心机的组成部分、安装、操作步骤、维护和故障排除等内容,为用户提供了全面的操作指导。
3. 组件及其功能1) 离心机滑动轴承2) 离心机转子3) 驱动系统4) 健康与安全5) 离心机控制面板6) 清洗和维护在手册中,将详细介绍每个组件及其功能,以便用户能够全面了解离心机的构造和工作原理。
4. 安装与操作步骤Flottweg S6E 操作手册将详细介绍离心机的安装步骤,包括安装前的准备工作、安装过程中的注意事项等。
还会全面阐述离心机的操作步骤,包括开机、设定参数、监控离心机运行状态等,以帮助用户正确并高效地操作离心机。
5. 维护与故障排除手册中将重点介绍离心机的维护方法,包括日常维护、定期维护等内容,以确保离心机的正常运行和延长其使用寿命。
手册还将详细介绍离心机可能出现的故障及排除方法,帮助用户在使用过程中遇到问题时能够及时处理。
6. 个人观点和理解作为 Flottweg S6E 离心机的操作手册撰写者,我深切理解用户对于该设备的需求。
我相信,通过本手册的全面解读与使用指南,用户将能够更加全面、深入地了解和掌握 Flottweg S6E 离心机的操作方法,从而提高生产效率,确保设备的长期稳定运行。
7. 总结Flottweg S6E 操作手册是一本全面的使用指南,涵盖了离心机的组件、安装、操作、维护和故障排除等方面。
通过本手册的详细介绍,用户将能够全面了解并掌握 Flottweg S6E 离心机的使用方法,为工业生产提供可靠的支持。
EIS简要操作说明书
EIS简要操作说明书2. EIS主界面进入主菜单界面,单击图标进入EIS主界面。
在EIS主界面可以设置各种测量参数,比如,扫描模式、频率范围、每一数量级取点数和测量周期,还可以进入各个子界面,比如,Series Measurement, Control Potentiostat或Display Spectrum2.1 文件操作2.1.1 打开单击图标,如果仪器内存中没有数据,会跳过子菜单。
单击Open后,打开文件浏览器,只显示EIS数据文件(文件扩展名.ism)。
选择路径和文件,单击LOAD按钮载入文件到Thales软件。
单击EIS主界面的DisplaySpectrum图标显示图形。
接下来的信息框显示被载入数据的测量参数。
单击框内可以关闭它。
提示:打开一个文件将关闭恒电位仪并根据被载入数据的参数设置自动配置恒电位仪。
载入一个文件是用以前使用过的设置执行新的测量的一种简单的方法。
2.1.2 保存通常完成一次EIS测量之后会有数据在仪器内存。
单击Save按钮一个描述框会打开,你可以输入测量参数和记录。
其中几行由软件自动填写(比如,电位,电流和测量时间),其它几行留空由用户填写。
最后三行为序列测量信息保留。
一个序列EIS测量运行时,它们会由软件自动填写。
接受输入信息,点击右上角的按钮放弃输入信息,点击按钮。
找到希望存储的路径(文件夹名称不可以使用中文)。
输入文件名并点击按钮保存数据;点击按钮取消保存。
2.2 显示谱图点击这个图标可以显示仪器内存中数据的谱图点击这个图标可以改变图形类型选择图形类型2.3 阻抗谱分析点击这个图标进入SIM页,可以做等效电路并拟合。
了解更多信息,请查阅说明书的SIM章节。
2.4 信号采集(需相关配件,通常无需了解此项)3. 电极连接方式首先连接测量体系到Zennium的前端。
标准阻抗体系(1 Ω到100 MΩ),用随仪器附带的其中一套电极引线。
提醒:短电极引线测量效果要稍好一些。
Autolab 电化学工作站操作规程
、Autolab 电化学工作站操作规程辽宁省新能源电池重点实验室一、开机1)先开启电化学工作站电源开关。
2)再开启电脑电源开关,计算机会自动连接到仪器。
3)连接正常时,在电脑显示屏右下角出现一个图标。
二、测试步骤将各电极连接到仪器。
1. 点击桌面上“Nova 1.8” 图标,(或选择:开始----所有程序----Autolab----Nova 1.8),开启电化学测量程序Nova。
2. 选择测量程序:view----set up view(或工具栏中的左数第四个按钮)。
Procedures包括三部分:Autolab(用于实验),Standards(测试仪器模块功能,需用到标准仿真电池,一般不用),My procedures(个人定义的测试程序)Procedures----Autolab----双击测试程序(或点右键Open for editing)。
在窗口右侧界面可编辑当前程序,点“+”号打开下级程序,鼠标放在相应数字处,单击打开编辑窗口修改(如打不开,是不可修改的项目)。
Procedure修改完后,如下次试验可能还用,选中第一列第一行,单击,打开程序名修改框另命名,然后,File----Save procedures as new,则修改后的程序保存在My procedures中。
开始测试,点界面左下角的Strart按钮,程序开始执行,此时,界面自动转到Measurement view,显示实时测量结果。
测试中出现的异常情况,记录在最下行的User log message中。
3. 测试完后,查看和导出数据。
View----Analysis view(或工具栏左数第七个按钮),打开数据分析界面,双击界面上方的程序名,调入实验结果,单击左侧的相应“+”号,打开数据项,蓝色或红色的标志为采集的数据,单击,图显示。
(X、Y轴显示项更改,在X=Potential applied处单击右键,打开菜单选Time,则图的X轴显示为时间,同理,Y轴也可更改。
电化学工作站操作手册
输出的是I-V曲线
对应的参数设定
4.3 Staircase Voltammetry
下图是SCV 技术的输出电压随时间变化图
输出的是I-V曲线
对应的参数设定
4.3 Tafel Plot
下图是TAFEL 技术的输出电压随时间变化图
输出的是log(I)-V曲线
对应的参数设定
5.2 微分脉冲伏安法使用方法
图标,选择Differential Pulse Voltammetry,点击OK。
在控制界面中点击 中设置参数。
图标,在弹出的对话
Init E (V): 起始电位,-10 - +10 Final E (V):最高电位,-10 - +10 Incr E(V):电位增幅,±0.001 - ±0.05 Amplitude(V):增幅,0.001 - 0.5 Pulse Width(sec):脉冲宽度,0.001 - 10 Pulse Period(sec):脉冲周期,0.01 - 50 Quiet Time(sec):静止时间,0 - 100000 Sensitivity (A/V):灵敏度,1e-12 - 0.1
计时电流法(Chronoamperometry)
下图是CA 技术的输出电压随时间变化图
输出的是I-t曲线
对应的参数设定
4.4 计时电量法 (Chronocoulometry)
下图是CC 技术的输出电压随时间变化图
输出的是通过电极的电量-t曲线
对应的参数设定
4.5 A.C. Voltammetry
下图是IMP 技术的输出电压随时间变化图
五 常用电化学试验操作及参数设置
5.1 循环伏安法使用方法
Autolab电化学工作站仪器的基本操作步骤
Autolab 电化学工作站使用说明1、开机前,检查电化学工作站与电脑的USB接线连接是否正常,保持正确连接。
2、接通电化学工作站主电源,按动电化学工作站前操作面板电源按钮Power键,即打开工作站。
3、启动电脑,并进入Windows操作系统。
4、在启动电脑的同时,电脑会自动检测与电化学工作站的连接情况以及电化学工作站内部设备是否运作正常。
自检完毕后,位于电脑屏幕右下角任务栏处的Autolab之Interface小图标正常显示,可进行下一步操作。
5、进行电化学方法测试前,首先将电化学工作站测量插头(分别是工作电极WE,反馈电极SE,辅助电极CE,参比电极RE)与电解池正确连接,注意电极的正负。
以经典的三电极电解槽为例,其中阴极为测量电极(即工作电解),接线方法为:WE与SE串连接后并与阴极连接,RE与参比电极连接,CE与辅助电极即阳极连接。
6、若进行基本电化学方法测试,点击Autolab之GPES图标,出现该测量界面,进行基本电化学测试,选择相应的Procedure/Method,输入相应的参数,确定参数输入无误后,点击Start按钮,进行测试。
测试完毕后,需要手动保存数据,以免数据丢失,特别需要注意的是保存路径中不能出现中文,否则不能保存数据,也不能打开数据。
7、若进行交流阻抗测试,点击Autolab之FRA图标,出现该测量界面,可行进行交流阻抗测试,选择相应的Procedure/Method,输入相应的参数,确定参数输入无误后,点击Start按钮,进行测试。
测试完毕后,需要手动保存数据,操作同一。
8、在测试间隙待机状态下,四根电极接线不宜空置,需要与实际体系连接,或插回Dummy Cell中,防止短路。
9、测试结束后,关闭电化学工作站的基本操作为:首先关闭软件操作界面,退出软件后,关闭电化学工作站前操作面板的电源按钮Power键,即关闭电化学工作站,最后切断电源。