Forecasting
pytorch-forecasting deepar 用法-概述说明以及解释
pytorch-forecasting deepar 用法-概述说明以及解释1.引言1.1 概述时间序列预测是一种重要的数据分析技术,它在各种领域中都得到了广泛的应用,例如金融预测、销售预测、天气预测等。
随着深度学习的发展,越来越多的基于神经网络的模型被应用于时间序列预测问题中。
PyTorch是一个流行的深度学习框架,它提供了丰富的工具和库,用于构建和训练神经网络模型。
其中,pytorch-forecasting是基于PyTorch 开发的一个用于时间序列预测的库,它提供了多种强大的算法和模型,用于解决不同类型的时间序列预测问题。
在pytorch-forecasting库中,deepar算法是其中一个被广泛应用的模型。
deepar算法基于深度学习的思想,通过引入递归神经网络和自回归机制,可以对时间序列数据进行连续的预测,并且能够捕捉到数据中的隐藏模式和周期性。
本文将对pytorch-forecasting库和deepar算法进行详细介绍。
首先,我们将对pytorch-forecasting库进行简介,包括其特点、使用方法和相关工具。
然后,我们将深入探讨deepar算法的原理和关键概念。
接着,我们将介绍deepar算法在时间序列预测中的应用场景,并分析其优势和适用性。
最后,我们将具体讲解deepar算法的使用方法,包括数据准备、模型构建、训练和预测等步骤。
通过本文的学习,读者将能够了解pytorch-forecasting库和deepar 算法的基本原理和使用方法,并且掌握如何应用这些技术解决实际的时间序列预测问题。
此外,我们还将对pytorch-forecasting的deepar算法进行评价,并提出可能的改进方向,以期进一步提升其预测性能和应用范围。
1.2 文章结构本文将详细介绍pytorch-forecasting deepar 的用法和应用。
文章分为三大部分:引言、正文和结论。
在引言部分,我们将首先概述本文要探讨的主题,并介绍pytorch-forecasting deepar 的背景和意义。
P190阅读理解43Forecasting Methods天气预报的方法
预示
. The method 方法 a forecaster (天气)预报员 chooses 选择
经验
】依靠 the ①experience
of the forecaster (天气)预报员,
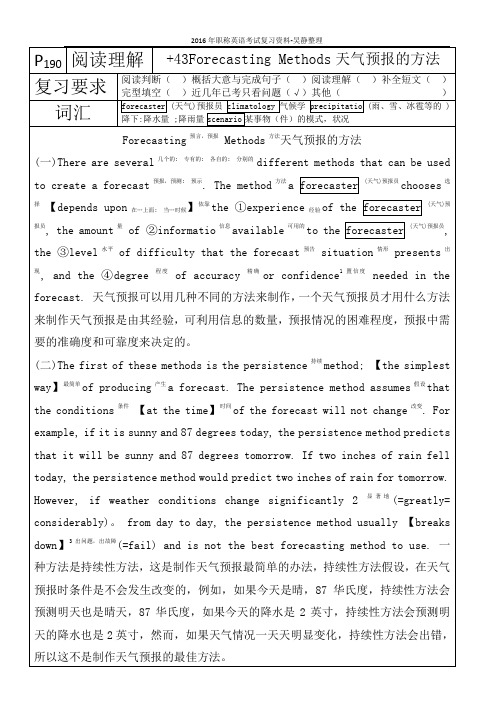
the amount 量 of ②informatio 信息 available 可用的 to the forecaster (天气)预报员, the ③ level 水平 of difficulty that the forecast 预告 situation 情形 presents 出现, and the ④degree
Forecasting 预言,预报 Methods 方法天气预报的方法 (一)There are several 几个的;
专有的; 各自的; 分别的
different methods that can be used
to create a forecast 预报,预测; 【depends upon
在…上面; 当…时候
2016 年职称英语考试复习资料-吴静整理
P190 阅读理解 +43Forecasting Methods 天气预报的方法 阅读判断( )概括大意与完成句子( )阅读理解( )补全短文( ) 复习要求 完型填空( )近几年已考只看问题(√)其他( ) forecaster (天气)预报员 climatology 气候学 precipitatio (雨、雪、冰雹等的 ) 词汇 降下:降水量 ;降雨量 scenario 某事物(件)的模式,状况
weather in this forecast will behave the same as it did in the past. The analog method is difficult to use because it is virtually to find a predict analog. Various 各种各样的;
Forecasting

“Prediction is very difficult, especially if it's about the future.”
Nils Bohr
Objectives
• Give the fundamental rules of forecasting
• Calculate a forecast using a moving average, weighted moving average, and exponential smoothing • Calculate the accuracy of a forecast
Actual demand (past sales) Predicted demand
What’s Forecasting All About?
From the March 10, 2006 WSJ:
Ahead of the Oscars, an economics professor, at the request of Weekend Journal, processed data about this year's films nominated for best picture through his statistical model and predicted with 97.4% certainty that "Brokeback Mountain" would win. Oops. Last year, the professor tuned his model until it correctly predicted 18 of the previous 20 best-picture awards; then it predicted that "The Aviator" would win; "Million Dollar Baby" won instead.
天气预报英语介绍
天气预报英语介绍Weather forecasting is the science of predicting what the weather will be like at a specific time in a particular location. It involves collecting data from various sources, analyzing this information, and using computer models to project future weather conditions. Meteorologists studyvarious elements such as temperature, humidity, wind patterns, precipitation, and atmospheric pressure to generate an accurate forecast.One of the key tools in weather forecasting is satellite technology. Satellites orbiting the Earth provide real-time images and data about cloud cover, storm systems, and atmospheric conditions. This information helps meteorologists to track weather fronts and severe weather events, such as hurricanes and thunderstorms. Radar systems also play acrucial role, enabling forecasters to observe precipitationin real-time and provide warnings for severe weather.Meteorological data is typically collected from a variety of sources, including weather stations, buoys in oceans, and aircraft. These observations are gathered in a centralized location and analyzed using sophisticated computer algorithms. Prediction models simulate weather behavior based on current conditions and historical data, allowing forecasters to make educated predictions about the weather.Weather forecasts are usually communicated throughvarious platforms, including television, radio, the internet, and mobile applications. They typically include information about temperature, chances of precipitation, wind speed, and potential severe weather conditions. Most forecasts covershort-term periods, such as daily or weekly forecasts, but some models can predict weather conditions several weeks in advance.One of the challenges in weather forecasting is the inherent unpredictability of the atmosphere. Weather systems are complex and can change rapidly, making precise long-term predictions difficult. Forecasters often use a range of forecasts to provide a more comprehensive view, emphasizing the possibility rather than certainty of certain conditions.Advancements in technology have significantly improved the accuracy of weather forecasts over the years. With the introduction of supercomputers and sophisticated modeling techniques, meteorologists can analyze vast amounts of data more efficiently, enhancing the reliability of predictions. Despite this progress, it is essential for the public to understand that forecasts are not infallible, and sudden changes in the weather can occur.Overall, weather forecasting is an essential service that impacts daily life, from agriculture to transportation, and even emergency management during natural disasters. As ourunderstanding of meteorology continues to evolve, so too will the methods and accuracy of weather forecasting, helping individuals and communities better prepare for the ever-changing weather.。
forecasting
Y轴截距
斜率
Y = a + bX
因变量(反应变量) 自变量(解释变量)
线性回归模型 (Linear Regression)
Y
回归方程 Y = a + bX
因变量
X 自变量
预测总是不准确的 Forecast is always wrong!
预测的结果很少能够与实际完全相符; 大多数预测方法假设系统在一段时间内保持稳定;
产品需求数量
第1年
第2年
第3年
第4年
移动平均法(Moving Average)
MA 是一列算术平均值 主要用于数据序列不存在趋势或趋势不明显的情形
通常用于平滑数据波动, 能够反映数据在一段时间内的总体走 势
计算公式: 前n期需求总和 / n
加权移动平均(Weighted Moving Average)
定量预测
用于市场形势稳定或存在大 量历史数据的情形
– 新产品
– 新技术 主要利用决策者的直觉及经 验进行预测 – 如预测商品网络销量
– 已有产品
– 已存在的技术 主要利用数量方法进行预测
– 如预测彩色电视机的销量
定性方法(Qualitative Methods)
各部门主管集体讨论法
时间序列模型
因果模型
移动平均
指数平滑
趋势外推
线性回归
时间序列预测(Time Series)
时间序列即一列均匀分布的数据点 – 数据点可通过观察多个时间周期的反应变量获得 预测仅依赖于过去值 – 过去和当前发挥作用的因素变量在未来将继续施加影响
时间序列预测(Time Series)
周期 (Cycle) 趋势季节 (Season)
专业英语气象科技英语第三课 气象预报

Serve as 充当,作为
P1①National Meteorological Services perform a variety of activities in order to provide weather forecasts. ②The principal ones are data collection, the preparation of basic analyses and prognostic charts of short-and long-term forecasts for the public as well as special services for aviation, shipping , agricultural and other commercial and industrial users, and the issuance of severe weather warnings.
stations for severe weather . ②Under the World
Weather Watch (WWW) program, synoptic reports are made at some 4,000 land stations and by 7,000
ships. ③There are about 700 stations making
P7: During the first half of the century, short-range forecasts were based on synoptic principles, empirical rules and extrapolation of pressure changes.
IBM SPSS Forecasting 28使用手册说明书

时间序列建模器............................................................................................................................................ 3 为专家建模器指定选项............................................................................................................................ 4 自定义的指数平滑法模型........................................................................................................................ 5 自定义的 ARIMA 模型............................................................................................................................. 6 输出(O).................................................................................................................................................... 7 保存模型预测和模型指定项.................................................................................................................... 9 选项....................................................................................................................................................... 10 TSMODEL 命令的附加功能................................................................................................................... 10
数据、模型与决策 (14)
Session14 Forecasting
实际应用
Sales Forecasting 销售预测
预测
航空公司现在非常依赖于在收取不看重价格的商 务人员旅行支付的高额票价的同时向其他人提供 折扣票价以填满座位。座位的数目在不同的运费 等级上如何分配的决策对利润最大化来说是关键 的。美洲航空公司(American Airlines)使用对 每一种票价需求的统计预测来做出这项决策的
Session14 Forecasting 预测
Data, Model and Decisions 数据、模型与决策
Session 14
Forecasting
预测
Session14 Forecasting
Session Topics
预测
Some Forecasting Applications 一些预测实际应用 Types of Forecasting 预测的类型 Demand Management 需求管理 Qualitative Forecasting Methods 定性预测方法 Quantitative Forecasting Methods 定量预测方法
39.6% 41.6% 35.4% 48
Source: Nada Sanders and Karl Mandrodt (1994) “Practitioners Continue to Rely on Judgmental Forecasting Methods Instead of Quantitative Methods,” Interfaces, vol. 24, no. 2, pp. 92-100.
想想看!
Session14 Forecasting
- 1、下载文档前请自行甄别文档内容的完整性,平台不提供额外的编辑、内容补充、找答案等附加服务。
- 2、"仅部分预览"的文档,不可在线预览部分如存在完整性等问题,可反馈申请退款(可完整预览的文档不适用该条件!)。
- 3、如文档侵犯您的权益,请联系客服反馈,我们会尽快为您处理(人工客服工作时间:9:00-18:30)。
ForecastingWhy forecast?Features Common to all Forecasts∙Conditions in the past will continue in the future∙Rarely perfect∙Forecasts for groups tend to be more accurate than forecasts for individuals ∙Forecast accuracy declines as time horizon increasesElements of a Good Forecast∙Timely∙Accurate∙Reliable (should work consistently)∙Forecast expressed in meaningful units∙Communicated in writing∙Simple to understand and useSteps in Forecasting Process∙Determine purpose of the forecast∙Establish a time horizon∙Select forecasting technique∙Gather and analyze the appropriate data∙Prepare the forecast∙Monitor the forecastTypes of Forecasts∙Qualitativeo Judgment and opiniono Sales forceo Consumer surveyso Delphi technique∙Quantitativeo Regression and Correlation (associative)o Time seriesForecasts Based on Time Series Data∙What is Time Series?∙Components (behavior) of Time Series datao Trendo Cycleo Seasonalo Irregularo Random variationsNaïve MethodsNaïve Forecast – uses a single previous value of a time series as the basis of a forecast.Techniques for Averaging∙What is the purpose of averaging?∙Common Averaging Techniqueso Moving Averageso Exponential smoothingMoving AverageExponential SmoothingTechniques for TrendLinear Trend Equationline the of slope at of value pe riod time for fore cast from pe riods time of numbe r spe cifie d =====b ty a ty t t where t t 0:Curvilinear Trend Equationline the of slope at of value pe riod time for fore cast from pe riods time of numbe r spe cifie d =====b ty a ty t t where t t 0:Techniques for Seasonality∙ What is seasonality?∙ What are seasonal relatives or indexes?∙ How seasonal indexes are used:o Deseasonalizing datao Seasonalizing data∙ How indexes are computed (see Example 7 on page 109)Accuracy and Control of ForecastsMeasures of Accuracyo Mean Absolute Deviation (MAD)o Mean Squared Error (MSE)o Mean Absolute Percentage Error (MAPE) Forecast Control Measureo Tracking SignalMean Absolute Deviation (MAD)Mean Squared Error (or Deviation) (MSE)Mean Square Percentage Error (MAPE)Tracking SignalProblems:2 – Plot, Linear, MA, exponential Smoothing5 – Applying a linear trend to forecast15 – Computing seasonal relatives17 – Using indexes to deseasonalize values26 – Using MAD, MSE to measure forecast accuracyProblem 2 (110)National Mixer Inc., sells can openers. Monthly sales for a seven-month period were as follows:(a) Plot the monthly data on a sheet of graph paper.(b) Forecast September sales volume using each of the following:(1) A linear trend equation(2) A five-month moving average(3) Exponential smoothing with a smoothing constant equal to 0.20, assuming March forecast of19(000)(4) The Naïve Approach(5) A weighted average using 0.60 for August, 0.30 for July, and 0.10 for June(c) Which method seems least appropriate? Why?(d) What does use of the term sales rather than demand presume?EXCEL SOLUTION(a) Plot of the monthly dataHow to superimpose a trend line on the graph∙Click on the graph created above (note that when you do this an item called CHART will appear on the Excel menu bar)∙Click on Chart > Add Trend Line∙Click on the most appropriate Trend Regression Type∙Click OK(b) Forecast September sales volume using:(1) Linear Trend Equation∙Create a column for time period (t) codes (see column B)∙Click Tools > Data Analysis > Regression∙Fill in the appropriate information in the boxes in the Regression box that appearsCoded time periodSales dataCoded time period(2) Five-month moving average(3) Exponential Smoothing with a smoothing constant of 0.20, assuming March forecast of 19(000)∙Enter the smoothing factor in D1∙Enter “19” in D5 as forecast for March∙Create the exponential smoothing formula in D6, then copy it onto D7 to D11(4) The Naïve Approach(5) A weighted average using 0.60 for August, 0.30 for July, and 0.10 for JuneProblem 5 (110)A cosmetics manufactur er’s marketing department has developed a linear trend equation that can be used to predict annual sales of its popular Hand & Foot Cream.y t =80 + 15 twhere: y t = Annual sales (000 bottles) t0 = 1990(a) Are the annual sales increasing or decreasing? By how much?(b) Predict annual sales for the year 2006 using the equationProblem 15 (113)Obtain estimates of daily relatives for the number of customers at a restaurant for the evening meal, given the following data. (Hint: Use a seven-day moving average)Excel Solution∙Type a 7-day average formula in E6 ( =average(C3:c9) )∙In F6, type the formula =C6/E6∙Copy the formulas in E6 and F6 onto cells E7 to E27∙Compute the average ratio for Day 1 (see formula in E12)∙Copy and paste the formula in E12 onto E13 to E18 to complete the indexes for Days 2 to 7Problem 17 (113) – Using indexes to deseasonalize valuesNew car sales for a dealer in Cook County, Illinois, for the past year are shown in the following table, along with monthly (seasonal) relatives, which are supplied to the dealer by the regional distributor.(a) Plot the data. Does there seem to be a trend?(b) Deseasonalize car sales(c) Plot the deseasonalized data on the same graph as the original data. Comment on the two graphs.Excel Solution(a) Plot of original data (seasonalized car sales)(b) Deseasonalized Car Sales(c) Graph of seasonalized car sales versus deseasonalized car salesProblem 26 (115) – Using MAD, MSE, and MAPE to measure forecast accuracyTwo different forecasting techniques (F1 and F2) were used to forecast demand for cases of bottled water. Actual demand and the two sets of forecasts are as follows:(a) Compute MAD for each set of forecasts. Given your results, which forecast appears to be the mostaccurate? Explain.(b) Compute MSE for each set of forecasts. Given your results, which forecast appears to be the mostaccurate? Explain.(c) In practice, either MAD or MSE would be employed to compute forecast errors. What factors might leadyou to choose one rather than the other?(d) Compute MAPE for each data set. Which forecast appears to be more accurate?Excel Solution。