麦肯锡咨询报告原版Impact of
Enhancing the Impact of your Report Summary
Enhancing the Impact of your ReportSummaryA report summary is a crucial part of any document as it provides a brief overview of the key points and findings to the reader. In order to enhance the impact of your report summary, there are several key strategies that can be implemented.First and foremost, it is essential to ensure that the summary is clear, concise, and well-organized. The purpose of a report summary is to provide the reader with a quick understanding of the main points of the report without having to read the entire document. Therefore, it is important to summarize the key findings, conclusions, and recommendations in a clear and succinct manner.Additionally, it is important to tailor the summary to the target audience. Consider who will be reading the report and what information will be most important to them. This will help you prioritize the key points to include in the summary and ensure that it is relevant and engaging to the reader.Another important aspect of enhancing the impact of your report summary is to use visual aids and graphics to help communicate the information. Charts, graphs, and tables can help to illustrate key data points and make complex information more digestible for the reader. Visual aids can also help to break up the text and make the summary more visually appealing.Furthermore, it is important to highlight the main takeaways and implications of the report in the summary. This will help to emphasize the significance of the findings and recommendations and make it easier for the reader to understand the report's importance.In conclusion, enhancing the impact of your report summary involves creating a clear, concise, and well-organized summary that is tailored to the target audience, uses visual aids to communicate information, and highlights the main takeaways and implications of the report. By implementing these strategies, you can ensure that yourreport summary effectively communicates the key points and findings of your report and leaves a lasting impact on the reader.。
麦肯锡公司报告McKinsey and Company

Managing Intellectual Capital
McKinsey
In Client Relationship Mode
Business Concept
Focus on important management issues
First mover in strategy and org consulting
Codification should be utilized when:
Mature offerings Dealing with similar problems over and over again Standardized products and services People rely on explicit (easily codified) knowledge ( software code or market data)
-
Inexperienced associates Info transfer only – not a creative solution No external expertise
Bray/Telecom Europe
+ Bray's mobility
Transfer expertise
+ Documented learning + Building networks
Employment Contract
Empowered employees are responsible for company's competitiveness and their own development Top managers ensures company's competitiveness and employees' security Top managers support personal development and initiatives and ensure employability
WAVE系统介绍-原版

1
2
3
3. My recent updates lists any initiatives or actions you have edited in the last 7 days. Click an item to open it. 4. All initiatives shows all the initiatives of the project, with some key information (Progress, Owner, Last modification date…) 5. All actions shows shows all the initiatives of the project, with some key information (Progress, Owner, Last modification date…)
Contents of this user guide
Topic
Page #
▪
▪ ▪ ▪ ▪ ▪ ▪
Wave overview and key concepts
Basic navigation and Dashboard Content Explorer : Initiatives and Actions Creating a new Initiative Tracking Impact Reports
SOURCE: Wave team
Email: support@
McKinsey & Company
| 2
Key concepts in Wave
Wave is structured along two key elements: Initiatives and Actions An initiative can be defined as an improvement opportunity within the overall project. Initiatives are the “what” as in “What should we do?”. Initiatives themselves can be grouped e.g. by business unit, function, theme or geography by using initiative attributes or so-called “project structures”. Each initiative could potentially have impact on one or more key business metrics such as cost or revenue. An action is a task which must be executed in order to implement an initiative. Actions are the “how” as in “How will we do it?” Each action sits within one specific parent initiative. Each initiative can have multiple actions (or even none), and an action cannot exist without a parent initiative.
麦肯锡战略咨询手册(英文版)(PPT)
8
IIA. INDUSTRY DYNAMICS AND IMPLICATIONS – BACK-UP 3
A.3 What is the expected competitor conduct? What are the resulting opportunities and risks?
• Major industry competitor moves
+
Internal assessment
+Байду номын сангаас
• How does your current
business emphasis fit with industry opportunity and competitive landscape?
+
Financial projections
• What are the expected
alternatives IV. Exhibits
2
BU STRATEGIC PLAN DEVELOPMENT
Environmental and internal assessment
Industry dynamics and implications
+
Competitive assessment
Assessments and the resultant BU Strategic Plans
4
II. ENVIRONMENTAL AND INTERNAL ASSESSMENT
5
IIA. INDUSTRY DYNAMICS AND IMPLICATIONS – SUMMARY
A. What are the major changes in industry dynamics and the resulting opportunities and risks?
麦肯锡:运营绩效(英文版)

savings targeted for 2003
Overall financial impact
• From 1996 to 2000, CAGR
of revenues and net income 15% and 30%, respectively, in spite of plunge in aluminum prices
50% increase
1997
2000
1997
EVA (ROIC minus cost of capital) Per cent
1997
2000
2000
7% decrease
* Based on a set of 132 companies in 10 sectors (Industrial Machinery, Ferrous, Non Ferrous, Consumer Durables, Chemicals,
a factor of five
• P/E 20+ points higher
than other major players
• Make-to-order supply chain • Inventory level 60% lower • Receivables turns 45% higher
“excellent” companies for analysis
– ROIC > WACC (from 95-99) – ROIC > Industrial average
• Short-listed 12
“excellent companies” based on qualitative review of operations
【独家原文翻译56页版】麦肯锡大数据:创新、竞争和生产力的下一个前沿(原文翻译)
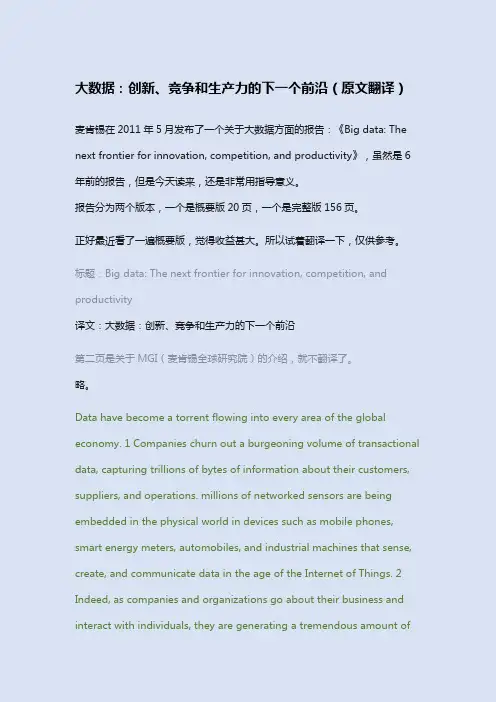
大数据:创新、竞争和生产力的下一个前沿(原文翻译)麦肯锡在2011年5月发布了一个关于大数据方面的报告:《Big data: The next frontier for innovation, competition, and productivity》,虽然是6年前的报告,但是今天读来,还是非常用指导意义。
报告分为两个版本,一个是概要版20页,一个是完整版156页。
正好最近看了一遍概要版,觉得收益甚大。
所以试着翻译一下,仅供参考。
标题:Big data: The next frontier for innovation, competition, and productivity译文:大数据:创新、竞争和生产力的下一个前沿第二页是关于MGI(麦肯锡全球研究院)的介绍,就不翻译了。
略。
Data have become a torrent flowing into every area of the global economy. 1 Companies churn out a burgeoning volume of transactional data, capturing trillions of bytes of information about their customers, suppliers, and operations. millions of networked sensors are being embedded in the physical world in devices such as mobile phones, smart energy meters, automobiles, and industrial machines that sense, create, and communicate data in the age of the Internet of Things. 2 Indeed, as companies and organizations go about their business and interact with individuals, they are generating a tremendous amount of digital“exhaust data,”i.e., data that are created as a by-product of other activities. Social media sites, smartphones, and other consumer devices including PCs and laptops have allowed billions of individuals around the world to contribute to the amount of big data available. And the growing volume of multimedia content has played a major role in the exponential growth in the amount of big data (see Box 1, “What do we mean by ‘big data’?”). Each second of high-definition video, for example, generates more than 2,000 times as many bytes as required to store a single page of text. In a digitized world, consumers going about their day—communicating, browsing, buying, sharing, searching—create their own enormous trails of data.译文:数据已成为流入全球经济各个领域的激流。
麦肯锡战略咨询报告写作模板-数据部分[精品文档]
AREA STACKED
Unit of measure Title Unit of measure
350
300
250
200
150
100
50
0 1996
1997
* Source:1Biblioteka 9819992000
Label 1 2001
2
Working Draft - Last Modified 01/07/2005 5:36:18 PM Printed
Working Draft
Last Modified 01/07/2005 5:36:18 PM China Standard Time Printed
CONFIDENTIAL
Title
CLIENT
Document Date
This report is solely for the use of client personnel. No part of it may be circulated, quoted, or reproduced for distribution outside the client organization without prior written approval from McKinsey & Company. This material was used by McKinsey & Company during an oral presentation; it is not a complete record of the discussion.
BAR BUTTERFLY
Unit of measure
Title Unit of measure
麦肯锡案例面试题:GreatBurger案例分析(英文
麦肯锡案例面试题:Great Burger 案例分析(英文,有答案)Practice CasesGreat BurgerIntroductionTo step through this case example, we will give you some information, ask a question, and then, when you are ready, give you a sample answer. We hope that the exercise will give you a sense of the flow of a case interview. (Please note, you can stop this exercise and pick up where you left off later. Your cookies must be on to usethis feature).In this exercise, you will answer a series of questions as the case unfolds. We provide our recommended answers after each question, with which you can compare your own answers. We want to emphasize that most questions in a case study do not have a single right answer. In a live case interview, we are more interested in your explanation of how you arrived at your answer, not just the answer itself. An interviewer can always assess different but equally valid ways of approaching an issue, and then bring you back to the particular line of inquiry that he or shewants to pursue.You should also keep in mind that in a live case, there will be far more interaction with the interviewer than this exercise allows. For example, you will have theopportunity to ask clarifying questions.Finally, a live case interview would typically be completed in 30 - 45 minutes, depending on how the case evolves. In this on-line exercise, there is no time limit.There are six questions in this on-line case study. This case study is designed to roughly simulate one during your interview, so you will not be able to skip ahead to the next question until you have answered the one you are on. You can refresh your memory of previous answers by clicking the highlighted Q&A links to the left. To print the answer, click on the print icon that appears in the TOP RIGHT corner.At the end, you can print the entire on-line case study at once.Start Case Study=============================================================================================================Client Goal: Should Great Burger acquire Heavenly Donuts as part of its growthstrategy?Our client is Great Burger (GB) a fast food chain that competes head–to-head with McDonald's, Wendy's, Burger King, KFC, etc.Description of Great BurgerGB is the fourth largest fast food chain worldwide, measured by the number of stores in operation. As most of its competitors do, GB offers food and "combos" for the three largest meal occasions: breakfast, lunch, and dinner.Even though GB owns some of its stores, it operates under the franchising business model with 85 percent of its stores owned by franchisees (individuals own and manage stores, pay franchise fee to GB, but major business decisions (e.g., menu, lookof store) controlled by GB).McKinsey studyAs part of its growth strategy GB has analyzed some potential acquisition targets including Heavenly Donuts (HD), a growing doughnut producer with both a U.S. andinternational store presence.HD operates under the franchising business model too, though a little bit differently than GB. While GB franchises restaurants, HD franchises areas or regions in which the franchisee is required to open a certain number of stores.GB's CEO has hired McKinsey to advise him on whether they should acquire HD or not.QUESTION 1What areas would you want to explore to determine whether GB should acquire HD?ANSWER 1Some possible areas are given below. Great job if you identified several of theseand perhaps others.∙Stand alone value of HD∙Growth in market for doughnuts∙HD's past and projected future sales growth (break down intogrowth in number of stores, and growth in same store sales) ∙Competition – are there any other major national chainsthat are doing better than HD in terms of growth/profit. Whatdoes this imply for future growth?∙Profitability/profit margin∙Capital required to fund growth (capital investment to opennew stores, working capital)Synergies/strategic fit∙Brand quality similar? Would they enhance or detract fromeach other if marketed side by side?∙How much overlap of customer base? (very little overlapmight cause concern that brands are not compatible, too muchmight imply little room to expand sales by cross-marketing) ∙Synergies (Hint: do not dive deep on this, as it will becovered later)Management team/cultural fit∙Capabilities/skills of top, middle management∙Cultural fit, if very different, what percent of keymanagement would likely be able to adjustAbility to execute merger/combine companies∙GB experience with mergers in past/experience inintegrating companies∙Franchise structure differences. Detail “dive” intofranchising structures. Would these different structuresaffect the deal? Can we manage two different franchisingstructures at the same time?=============================================================================================================The team started thinking about potential synergies that could be achieved by acquiring HD. Here are some key facts on GB and HD.QUESTION 2What potential synergies can you think of between GB and HD?ANSWER 2We are looking for a few responses similar to the ones below:∙Lower costs∙Biggest opportunity likely in corporate selling, general, and administrative expenses (SG&A) by integrating corporatemanagement∙May be some opportunity to lower food costs with larger purchasing volume on similar food items (e.g., beverages,deep frying oil), however overlaps may be low as ingredientsare very different∙GB appears to have an advantage in property and equipment costs which might be leveragable to HD (e.g., superiorskills in lease negotiation)Increase revenues∙Sell doughnuts in GB stores, or some selected GB productsin HD stores∙GB has much greater international presence thus likely hasknowledge/skills to enable HD to expand outside of NorthAmerica∙GB may have superior skills in identifying attractivelocations for stores as its sales per store are higher thanindustry average, whereas HD's is lower than industryaverage; might be able to leverage this when opening new HDstores to increase HD average sales per store∙Expand HD faster than it could do on own–GB, as a largercompany with lower debt, may have better access to capital=============================================================================================================QUESTION 3The team thinks that with synergies, it should be possible to double HD’s U.S. market share in the next 5 years, and that GB’s access to capital will allow it to expand the number of HD stores by 2.5 times. What sales per store will HD require in 5 years in order for GB to achieve these goals? Use any data from Exhibit 1 you need, additionally, your interviewer would provide the following assumptions foryou:∙Doughnut consumption/capita in the U.S. is $10/year today, and isprojected to grow to $20/year in 5 years.∙For ease of calculation, assume U.S. population is 300m.ANSWER 3You should always feel free to ask your interviewer additional questions to helpyou with your response.Possible responses might include the following:∙Market share today: $700M HD sales (from Exhibit 1) ÷ $3B U.S. market ($10 x 300M people) = 23% (round to 25% for simplicity sake)∙U.S. market in 5 years = $20 x 300 = $6B∙HD sales if double market share: 50% x $6B = $3B∙Per store sales: $3B/2.5 (1000 stores) = $1.2MDoes this seem reasonable?∙Yes, given it implies less than double same store sales growth and percapita consumption is predicted to double.=============================================================================================================QUESTION 4One of the synergies that the team thinks might have a big potential is the idea of increasing the businesses' overall profitability by selling doughnuts in GB stores. How would you assess the profitability impact of this synergy?ANSWER 4Be sure you can clearly explain how the assessment you are proposing would helpto answer the question posed.Some possible answers include:∙Calculate incremental revenues by selling doughnuts in GB stores(calculate how many doughnuts per store, times price per doughnut, timesnumber of GB stores)∙Calculate incremental costs by selling doughnuts in GB stores (costs of production, incremental number of employees, employee training,software changes, incremental marketing and advertising, incrementalcost of distribution if we cannot produce doughnuts in house, etc.) ∙Calculate incremental investments. Do we need more space in each store if we think we are going to attract new customers? Do we need to invest in store layout to have in-house doughnut production?∙If your answer were to take into account cannibalization, what would be the rate of cannibalization with GB offerings? Doughnut cannibalization will be higher with breakfast products than lunch anddinner products, etc.∙One way to calculate this cannibalization is to look at historiccannibalization rates with new product/offering launchings within GBstores∙Might also cannibalize other HD stores if they are nearby GB store–could estimate this impact by seeing historical change in HD’s sales whencompetitor doughnut store opens nearby=============================================================================================================QUESTION 5What would be the incremental profit per store if we think we are going to sell 50,000 doughnuts per store at a price of $2 per doughnut at a 60 percent margin with a cannibalization rate of 10 percent of GB's sales?ANSWER 5While you may find that doing straightforward math problems in the context of an interview is a bit tougher, you can see that it is just a matter of breaking the problem down. We are looking at both your ability to set the analysis up properlyand then do the math in real time.Based on correct calculations, your response should be as follows: Incremental profit = contribution from HD sales less contribution lost due tocannibalized GB sales= 50K units x $2/unit x 60% margin – 300K units x 10% cannibalization x $3/unitx 50% margin= $60K – 45K = 15K incremental profit/store=============================================================================================================QUESTION 6You run into the CEO of GB in the hall. He asks you to summarize McKinsey’s perspective so far on whether GB should acquire HD. Pretend the interviewer is theCEO–what would you say?ANSWER 6You may have a slightly different list. Whatever your approach, we love to see candidates come at a problem in more than one way, but still address the issue asdirectly and practically as possible.Answers may vary, but here is an example of a response:∙Early findings lead us to believe acquiring HD would create significantvalue for GB, and that GB should acquire HD∙Believe can add $15 thousand in profit per GB store byselling HD in GB stores. This could mean $50 million inincremental profit for North American stores (whereimmediate synergies are most likely given HD has littlebrand presence in rest of world)∙We also believe there are other potential revenue and costsynergies that the team still needs to quantify Once the team has quantified the incremental revenues, cost savings,and investments, we will make a recommendation on the price you shouldbe willing to payWe will also give you recommendations on what it will take to integratethe two companies in order to capture the potential revenue and cost savings, and also to manage the different franchise structures and potentially different cultures of GB and HD。
The impact of supply chain an
This article was downloaded by: [Zhejiang University]On: 09 May 2015, At: 20:22Publisher: Taylor & FrancisInforma Ltd Registered in England and Wales Registered Number: 1072954 Registered office: Mortimer House,37-41 Mortimer Street, London W1T 3JH, UKClick for updatesInternational Journal of Production ResearchPublication details, including instructions for authors and subscription information:/loi/tprs20The impact of supply chain analytics on operational performance: a resource-based viewBongsug (Kevin) Chae a, David Olson b& Chwen Sheuaa Department of Management, Kansas State University , Manhattan, KS, USAbCollege of Business Administration, University of Nebraska at Lincoln, Lincoln, NE, USA Published online: 04 Dec 2013.PLEASE SCROLL DOWN FOR ARTICLEThe impact of supply chain analytics on operational performance:a resource-based viewBongsug (Kevin)Chae a ,David Olson b and Chwen Sheu a *aDepartment of Management,Kansas State University,Manhattan,KS,USA;b College of Business Administration,University ofNebraska at Lincoln,Lincoln,NE,USA(Received 22September 2012;accepted 27October 2013)This study seeks to better understand the role of supply chain analytics (SCA)on supply chain planning satisfaction and operational performance.We de fine the architecture of SCA as the integration of three sets of resources,data management resources (DMR),IT-enabled planning resources and performance management resources (PMR),from the perspective of a resource-based view.Based on the data collected from 537manufacturing plants,we test hypotheses exploring the relationships among these resources,supply chain planning satisfaction,and operational performance.Our analysis supports that DMR should be considered a key building block of manufacturers ’business analytics initiatives for supply chains.The value of data is transmitted to outcome values through increasing supply chain planning and performance capabilities.Additionally,the deployment of advanced IT-enabled planning resources occurs after acquisition of DMR.Manufacturers with sophisticated planning technologies are likely to take advantage of data-driven processes and quality control practices.DMR are found to be a stronger predictor of PMR than IT planning resources.All three sets of resources are related to supply chain planning satisfaction and operational performance.The paper concludes by reviewing research limitations and suggesting further SCA research issues.Keywords:manufacturing management;supply chain management;data mining1.IntroductionFirms are under heavy pressure to improve supply chain planning and performance because of factors such as increasing uncertainty and competition.Manufacturers have adopted a variety of innovative technological and process-based solutions to obtain and sustain competitive advantage over their competitors.In supply chain management,there is growing interest in business analytics,which is also called supply chain analytics (SCA).SCA refers to the use of data and quantitative tools and techniques to improve operational performance,often indicated by such metrics as order ful filment and flexibility,in supply chain management (Hand field 2006;Davis-Sramek,Germain,and Iyer 2010;Davenport and O ’dwyer 2011;O ’dwyer and Renner 2011).There are numerous cases of successful SCA implementation by leading firms.For example,Proctor &Gamble and Walmart are reported to have signi ficantly improved operational ef ficiency through the use of data and analytical IT tools for supply chain decisions (Davenport and Harris 2007;Davenport and O ’dwyer 2011;O ’Dwyer and Renner 2011;SAS 2012).Tesco,one of the world ’s largest retailers,based in the UK,has experienced signi ficant cost savings through SCA over the years (Clark 2013).Analytics in SCM is not necessarily a new idea (Davenport and O ’dwyer 2011),since various quantitative techniques and modelling methods have long been used in manufacturing firms (Turban and Sepehri 1986;Shapiro 2000;Kusiak 2006;Trkman et al.2010).The recent surge of interest in SCA is accompanied by new challenges and opportunities in both business and information technology (IT)environments.These challenges include issues arising from managing large amounts of data (e.g.data availability and data quality)and dealing with environmental uncertainties (Hand field and Nichols 2004;Liberatore and Luo 2010;Huner et al.2011;Lavalle et al.2011;Manyika et al.2011).First,IT-based innovations have generated and captured ‘more data while also changing the nature of businesses ’(Kohli and Grover 2008,32).For instance,a leading consumer goods firm (Li &Fung)reported the flow of over 100gigabytes of data through the firm ’s supply chain network on a given day in 2009(Economist 2010).The opportunity to gain competitive advantage may thus arise from how firms manage data (Vosburg and Kumar 2001;Forslund and Jonsson 2007;Oliva and Watson 2011).Another major challenge for businesses is the increasing uncertainty in both demand (e.g.consumer market)and supply sides of their businesses.Dealing with demand and supply uncertainty by*Corresponding author.Email:csheu@©2013Taylor &FrancisInternational Journal of Production Research ,2014V ol.52,No.16,4695–4710,/10.1080/00207543.2013.861616D o w n l o a d e d b y [Z h e j i a n g U n i v e r s i t y ] a t 20:22 09 M a y 2015means of proper supply chain planning has been a major theme in many recent SCM studies (Oliva and Watson 2011;Demirkan and Delen 2012).In response to those challenges,SCA has been proposed as a promising approach to better manage data,utilise IT resources and prepare for effective supply chain planning (Hand field 2006;Davenport,Harris,and Morison 2010;Davis-Sramek,Germain,and Iyer 2010;Viswanathan and Sadlovska 2010).This new generation of analytic tools can develop a firm ’s IT and data management capabilities to enhance planning and improve operational performance (Kohli and Grover 2008;Shapiro 2010;Mithas,Ramasubbu,and Sambamurthy 2011).It is suggested that firms can use SCA from data acquisition (e.g.RFID)and repository (e.g.ERP)technologies to improve supply chain planning through IT-enabled planning and scheduling systems (Davenport and O ’dwyer 2011;O ’dwyer and Renner 2011).To date,however,there has been very limited empirical research in this data-driven innovative approach to SCM.SCA research is in its early stage and there is a general lack of theory and of empirical ing the resource-based view (RBV)as the theoretical base,this study expands the understanding of components and performance of SCA.The principal idea of the RBV is that the competitive advantage of a firm lies in its heterogeneous resources,which are valuable,inimitable and non-substitutable (Barney 1991).(Please see Armstrong and Shimzu 2007;Newbert 2007for a more comprehensive review of empirical research using RBV).Accordingly,we develop a theoretical per-spective on SCA as a valuable,inimitable and non-substitutable resource in manufacturing contexts that can be a source of sustained competitive advantage.SCA is a combination of three sets of data and IT-enabled SCM resources,which we refer to as data management resources (DMR),IT-based supply chain planning resources (IPR)and performance management resources (PMR)(Figure 1).Manufacturing firms acquire and use various IT and organisational resources (ORs)in these three aspects of SCA.Firms use diverse analytical and IT resources for acquiring,storing and retrieving data.DMR includes IT-related resources (e.g.RFID and ERP)and analytical capabilities (e.g.mathematical optimization techniques)for data acquisition and management.Also,different software tools (or IPR),from less sophisticated to more advanced,are used for supply chain planning in manufacturers.IPR represents these IT resources (e.g.advanced plan-ning systems)embedding various optimization and predictive analytics (e.g.mathematical programming and statistical analysis).Manufacturers put different degrees of investment in the use of data-oriented process and performance improvement methodologies such as statistical process control and Six Sigma,which are considered PMR.In this study,these three sets of analytics and IT resources are viewed as complementary,enabling each other.This perspective is developed with reference to the RBV theory,which acknowledges that resources are important for com-petitive advantage and,in particular,IT-related resources become more effective when combined with non-IT-related resources as complementarities.This study tests hypotheses exploring the relationships among those three dimensions of SCA and the link between SCA and user satisfaction of supply chain planning and SCM performance (e.g.reliability and flexibility).A major contribution of this study is that it offers empirical findings on the relatively new topic of businesses ’use of SCA.Particularly,the study ’s findings shed light on the importance of three sets of complementary IT-enabled resources for successfully taking advantage of business analytics for SCM,the signi ficant role of DMR as the key building block of SCA and the positive impact of SCA on operational performance.Section 2reviews relevant literature pertaining to SCA.Three types of IT and ORs are introduced from the RBV perspective.In Section 3,the research model is developed with the hypotheses of the relationships among types of resources and performance variables.The research methodology,including samples and measurements,is discussed in Section 4,followed by the presentation of statistical results in Section 5.Section 6discusses results,and Section 7concludes with managerial implications,research limitations and suggestions for future research.Data management resources (DMR)IT-ased supply chain planning resources (IPR)Performance managementresources (PMR)Operational PerformanceSupply Chain AnalyticsFigure 1.Conceptual model.4696B.Chae et al.D o w n l o a d e d b y [Z h e j i a n g U n i v e r s i t y ] a t 20:22 09 M a y 20152.Theoretical background2.1Resource-based viewThe RBV holds that resources vary across firms,and differences in resource levels that persist over time enable firms to sustain competitive advantage (Penrose 1959;Wernerfelt 1984;Barney 1991).Under RBV,various technological and organisational practices can be considered resources for acquiring sustained competitive advantage.For instance,organisational knowledge,managerial skills,backend integration,technology and manufacturing facilities are viewed as manufacturer resources (Dong,Xu,and Zhu 2009).Also,diverse SCM-related activities and practices (e.g.supply manage-ment practices and environmental management practices)are considered important resources for improving operational performance (Narasimhan and Schoenherr 2012;Blome,Schoenherr,and Rexhausen 2013).IT is often viewed as a firm resource in the RBV framework (Barney 1991;Wade and Hulland 2004)to create sustained competitive advantage (Barney 1991).Recent studies have studied the role of other resources as complemen-tarities in the effects of IT on firm performance (Powell and Dent-Micallef 1997;Tippins and Sohi 2003;Wade and Hulland 2004;Jeffers,Muhanna,and Nault 2008;Kohli and Grover 2008).Speci fically,IT becomes an effective firm resource when it is complemented by other resources or practices (Powell and Dent-Micallef 1997;Tippins and Sohi 2003;Nevo and Wade 2010).Kohli and Grover (2008,26)argued that ‘IT,as simply hardware and software tools,does not create value in isolation,but must be a part of a business value creating process with ‘other ’IT and organisational factors operating in a synergistic manner ’.These ‘other ’IT and organisational factors are called complementarities.The interaction of IT and complementarities would lead to competitive advantage (Wade and Hulland 2004).2.2Supply chain analyticsThe emergence of new terms,such as SCA,re flects a broad interest in leveraging the business value of supply chain data and harnessing the power of various analytical technologies and methods.Top performing companies are better at utilising their data for business planning and execution (Kiron et al.2011;Lavalle et al.2011)and this has led to the increase in supply chain integration and visibility (Viswanathan and Sadlovska 2010;O ’dwyer and Renner 2011).In general,academic research expects the bene fits of analytics in supporting supply chain operations (Trkman et al.2010;Davenport and O ’dwyer 2011).Manufacturers have used statistical modelling and optimization (Turban and Sepehri 1986;Shapiro 2000;Chellappa,Sambamurthy,and Saraf 2010;Davenport and O ’dwyer 2011)to help deal with supply chain problems (e.g.inventory optimization)on an ad hoc basis.However,the role that SCA plays,regarding both supply and demand factors,is growing in importance and deserves more thorough investigation.Demand factors include the massive amount of data generated from manufacturing activities and customer and supplier interaction,growing competition and uncertainty,and the need for enterprise-level planning on a daily or regular basis.Supply factors include powerful IT for data management and supply chain planning and advanced data-driven techniques for better process and quality control.2.3A RBV of SCAIn this study,firm resources (e.g.IT)as a source of sustained competitive advantage are used to conceptualise SCA,to test the relationships between different SCA-related resources and to predict their impact on supply chain planning satisfaction and operational performance.Theoretically,IT-enabled resource is an RBV-based construct and is supplemented with concepts from systems theory (Nevo and Wade 2010;Nevo and Wade 2011).The concept,de fined as ‘a system (or a subsystem,depending on one ’s perspective)comprised of an IT asset and an OR in a relationship ’(Nevo and Wade 2011,405),postulates IT assets as a potential resource for competitive advantage.This conceptual framework asserts that such potential can be realised when IT is integrated with other resources (Nevo and Wade 2010).Analytics,in general,does not refer to a particular technology,method or practice (Davenport,Harris,and Morison 2010;Trkman et al.2010;Turban et al.2011).Rather,it is a combination of multiple IT-enabled resources,which includes both IT assets and ORs,helping the use of ‘data,analytical IT,and fact-based management methodologies ’(Davenport and Harris 2007)in decision-making.Therefore,SCA is viewed as a combination of IT-enabled resources for manufacturing-related data management,supply chain planning and data-driven process and quality improvement.It is a data-driven,analytical decision-making approach to SCM supported by IT resources for data management,supply chain planning and evidence-based management methodologies.These IT-enabled resources would include enterprise IT infrastructure (e.g.ERP and RFID)and analytical methods for data management,technologies embedding optimization and predictive analytics (e.g.mathematical programming)for supply chain planning,and data-driven supply chain ORsInternational Journal of Production Research 4697D o w n l o a d e d b y [Z h e j i a n g U n i v e r s i t y ] a t 20:22 09 M a y 2015(e.g.statistical process control,Six Sigma)for improving manufacturing processes and performance.We give general de finitions of three types of SCA IT-enabled resources:DMR:Data has long been recognised as a critical asset for organisations (Marchand,Kettinger,and Rollins 2000).The information processing view asserts that ‘the greater the uncertainty of the task,the greater the amount of information that has to be processed between decision makers during task execution in order to achieve a given level of performance ’(Galbraith 1974,28).Thus,data management becomes critical for firm performance and IT serves as the infrastructure for data capture,manipulation and redistribution (Fairbank et al.2006).DMR represents the firm ’s IT resources for such activities as data acquisition,storage and retrieval.For example,ERP is an IT resource and serves as an integrated,single-instance database for ef ficient data management providing integrated data for manufacturing planning and control (Su and Yang 2010).Analytic techniques and methods can also be used to generate important manufactur-ing data or master data (e.g.lead time and batch size).Data management is an important dimension in the quality/process management literature (Flynn,Schroeder,and Sakakibara 1994;Nair 2006;Kaynak and Hartley 2008).IPR:IPR represents the IT resources embedding various optimization and predictive analytics,such as mathematical programming,simulation,statistical analysis and machine learning algorithms.These analytic techniques and methods are invaluable means for supply chain planning activities,such as master production planning,material requirements planning and capacity planning (Kreipl and Pinedo 2004;Stadtler 2005;V ollmann et al.2005;Hendricks,Singhal,and Stratman 2007).Supply chain planning software (e.g.Advanced Planning Scheduling)embed these analytics and also have the capability of accessing large data stores (Dehning,Richardson,and Zmud 2007).DMR is important for IPR since the data become inputs for supply chain planning.In general,the more sophisticated those technologies are,the more such analytic methods and data access capabilities are embedded (Singh 2003).PMR:While IPR is primarily used for supply chain planning;our use of PMR refers to the firm ’s resources focusing on closing the gap between planning and execution,through monitoring and correcting manufacturing processes and performance.This is another key area where analytical methods (and technolo-gies)can have positive impacts (Houghton et al.2004;Yang et al.2007;Turban et al.2011).PMR enables analytical thinking and fact-based management.These resources are data-driven SCM practices (Kannan and Tan 2005),often combined with performance metrics (Schroeder 2008),data visualisation of quality problems (Zu,Fredendall,and Douglas 2008)and analytical methods (Scheuermann,Zhu,and Scheuermann 1997).PMR becomes an integral component for SCA,since these ORs help monitor supply chain execution,control performance variability and improve the quality of planning and execution.These resources have been extensively surveyed in the literature (Rungtusanatham 2001;Shah and Ward 2003;Holweg 2007;Shah and Ward 2007;Schroeder 2008;Zu,Fredendall,and Douglas 2008),but with no focus on their data-oriented,analytical aspects.In summary,these three types of IT and ORs are related and synergistically affect supply chain planning,as well as SCM operational performance.In particular,DMR is expected to serve as the foundation of SCA,since IPR and PMR rely on data as inputs.Advanced IT resources for data management can enable the use of comprehensive and reliable data by IPR and PMR.However,these IT-enabled resources are complementary;DMR,IPR and PMR are not expected to drive performance individually,but,rather,they need to work together.3.Research model and hypothesesWhen SCA is viewed as a combination of IT-enabled resources,we expect there will be interactions among those elements (DMR,IPR,and PMR).Thus,we first consider three internal relationships:(H1)DMR are positively associated with IPR;(H2)DMR are positively associated with PMR;(H3)IPR are positively associated with PMR.Then,with two outcome latent variables –supply chain planning satisfaction and SCM operational performance –we explore the impact of SCA:(H4a)DMR are positively associated with supply chain planning satisfaction;(H4b)IPR are positively associated with supply chain planning satisfaction;(H4c)PMR are positively associated with supply chain planning satisfaction;(H5a)supply chain planning satisfaction are positively associated with SCM operational performance;and (H5b)PMR are positively associated with SCM operational performance.These hypotheses are presented in Figure 2.The remainder of this section provides the theoretical development of the research hypotheses.4698 B.Chae et al.D o w n l o a d e d b y [Z h e j i a n g U n i v e r s i t y ] a t 20:22 09 M a y 20153.1Linking IT-enabled resources of SCAManufacturing firms have different levels of IT-enabled resources for data management.Some firms possess advanced IT-enabled resources for data management,such as ERP and RFID,that can enable automatic data acquisition,high accuracy in manufacturing-related data quality,and easy data retrieval and use for SCM planning and control.For example,RFID offers many bene fits to supply chain management (Sellitto,Burgess,and Hawking 2007)and a major bene fit is data acquisition capability (Singh 2003;Delen,Hardgrave,and Sharda 2007).ERP is widely adopted as a centralised data repository (Bendoly 2003;Olson,Chae,and Sheu 2013).Some firms also use sophisticated mathematical models or analytical techniques to determine manufacturing-related master data (e.g.lead time).IPR involves processing a large volume of production,sales,delivery,and material data for effective planning and scheduling (Gustavsson and Wanstrom 2009;Dionne and Kempf 2011).A centralised corporate repository allows the same data to be used for all types of planning and helps such planning to correctly re flect the company ’s condition (Hendricks,Singhal,and Stratman 2007).Effective supply chain planning relies on ‘informational ’ef ficiency,meaning that data is collected,aggregated,and distributed for the planning process (Oliva and Watson 2011).Performance management practices or resources (PMR),such as quality management and Six Sigma,rely on manufacturers ’planning and execution data (Kannan and Tan 2005;Zu,Fredendall,and Douglas 2008).In other words,DMR can be a key contributor to PMR.As argued by Davenport,Harris,and Morison (2010,23):You cannot be analytical without data.Data are the basis for both supply chain planning and performance management.Supply chain planning relies on the availability of financial and operational data (Shapiro 2010;Oliva and Watson 2011).Thus,DMR are strongly required prior to IT-based supply chain resources (IPR).For example,IT-based resources for inventory control need to extract data from DMR such as ERP (Stadtler 2005;V ollmann et al.2005).Also,measuring and improving performance of quality and processes is not possible without access to properly managed data.Thus,quality data and reporting are important for and strongly associated with performance management (Kaynak and Hartley 2008;Mithas,Ramasubbu,and Sambamurthy 2011).Accordingly,we expect that DMR in fluences the adoptions of IPR and PMR:the adoption of advanced IPR and diverse PMR presupposes the existence of sophisticated DMR.H1.DMR positively affect IT-enabled supply chain planning resources (IPR).H2.DMR positively affect PMR.Manufacturers differ considerably in terms of their analytical capabilities used for supply chain planning activities,such as material planning,inventory control and shop floor control.Some manufacturers possess advanced planning technolo-gies,embedding optimization algorithms,data mining tools and so on.These analytics-embedded IT sources offer several bene fits,including reducing planning errors and potential disruption and increasing planning accuracy (Hendricks,Singhal,and Stratman 2007).While IPR might potentially lead to positive SCM outcomes,such as improved on-time delivery (Wu et al.2006),and financial outcomes,such as pro fitability (Hendricks,Singhal,and Stratman 2007),in the RBV of IT (Devaraj and Kohli 2003;Wade and Hulland 2004;Kohli and Grover 2008;Nevo and Wade 2010),their value is expected to be attained through complementary resources,PMR.Supply Chain AnalyticsData management resources (DMR)IT-based supply chain planning resources (IPR)Performance management resources (PMR)Supply chain planning satisfaction (SAT)SCM operational performance(SCP)H1H2H3H4aH4bH4cH5aH5bFigure 2.Research model.International Journal of Production Research4699D o w n l o a d e d b y [Z h e j i a n g U n i v e r s i t y ] a t 20:22 09 M a y 2015IPR in general increases visibility and coordination in manufacturing planning and control (Vollmann et al.2005).This stimulates firms to engage in sensing potential gaps between planning and execution and correcting errors in different areas.For example,IT-based planning reveals forecasting errors,overstocks and other issues,which require coordination to fix.As a result,IPR is expected to increase the need for performance management.Firms are likely to increase relevant resources for performance management.Among previous studies,Martinez-Lorente,Sanchez-Rodriguez,and Dewhurst (2004)suggested that IT resources are positively associated with supply chain practices,such as TQM.Thus,we posit thatH3.IT-enabled supply chain planning resources (IPR)positively affect PMR.3.2Relationships with outcome constructsThe impact of SCA on firm-level outcomes may be the result of both indirect and direct in fluences.The RBV of SCA indicates that DMR and IPR are more technological than organisational,while the opposite is true for PMR.Many RBV-based studies suggest that the impact of IT on performance is likely to be indirect,through non-IT factors or resources as complementary resources (Bharadwaj 2000;Wade and Hulland 2004;Devaraj,Krajewski,and Wei 2007;Jeffers,Muhanna,and Nault 2008;Nevo and Wade 2010).Therefore,we consider ‘supply chain planning satisfaction (SAT)’as an indicator for planning quality.Satisfaction is the level of favourable ‘attitude ’(Delone and Mclean 1992;Wixom and Todd 2005)toward supply chain planning.SAT is the measure for the perceived quality or performance of supply chain planning activities.Accordingly,we expect that each component of SCA positively in fluences supply chain planning satisfaction.IT resources,such as advanced data repository technology and supply chain planning software,are likely to in fluence the attitude toward supply chain planning.The literature shows that the quality of data and IT positively in fluences satisfaction,which in turn results in positive organisational impacts or bene fits (Delone and Mclean 1992;Wixom and Todd 2005;Petter and McLean 2009).In addition to DMC and IPR,process and performance management is important to the outcome of supply chain planning.The planning process is in fluential in supply chain planning performance (De Snoo,Wezel,and Jorna 2011).The implementation of data-driven performance practices has positive effects on planning quality,which in turn leads to operational improvement (De Leeuw and Van Den Berg 2011).As a result,we expect that DMR,IPR and PMR have positive impacts on supply chain planning satisfaction.H4a.DMR positively affect supply chain planning satisfaction (SAT).H4b.IT-enabled supply chain planning resources (IPR)positively affect supply chain planning satisfaction (SAT).H4c.PMR positively affect supply chain planning satisfaction (SAT).Finally,we expect that supply chain planning satisfaction and PMR positively affect SCM operational performance.DMR and IPR are mostly associated with the usage of information technology,and this leads us to consider their indirect impact on SCM performance.On the other hand,PMR represents more the data-driven,analytical SCM practices or methodolo-gies for improving SCM performance.Therefore,we expect a direct impact of PMR on SCM performance.For instance,studies show that the investment in quality and process improvement practices has positive effects on organisational or supply chain performance (SCP)(Merino-díaz De Cerio 2003).In addition,the literature suggests that satisfaction is linked with positive performance impacts on organisational bene fits (Delone and Mclean 1992;Petter and McLean 2009).H5a.Supply chain planning satisfaction (SAT)positively affects SCM operational performance (SCP).H5b.PMR positively affect SCM operational performance (SCP).4.Methodology 4.1Data collectionThe research data used in this paper were gathered by the Global Manufacturing Research Group (GMRG),an organisation of international academic researchers studying the effectiveness of manufacturing practices in the supply chain worldwide ( ).The GMRG developed its database using a common survey instrument for all countries.Standardised survey instruments are administered by the GMRG members in their respective countries.Rigorous translating and back-translating rounds were performed by multiple academics to ensure the equivalency,validity and reliability of the4700 B.Chae et al.D o w n l o a d e d b y [Z h e j i a n g U n i v e r s i t y ] a t 20:22 09 M a y 2015。
麦肯锡战略咨询手册英文
TABLE OF CONTENTS
I. Executive summary II. Environmental and internal assessment
A. Industry dynamics and its implications B. Competitive assessment C. Internal assessment III. Strategic definition and implications A. Strategy articulation B. Strategic initiatives C. Financial projection D. Risks/contingencies and strategic
Instructions: Exhibit 2,3 or 4 could provide
a useful framework for answering this question
9
IIA. INDUSTRY DYNAMICS AND IMPLICATIONS – BACK-UP 4
A.4 What are the present and future external factors that could present new opportunities and risks?
– Definition
– Sizing
Industry definition:
Instructions: Exhibit 1 could provide a useful framework for answering this question
Industry segmentation:
7
IIA. INDUSTRY DYNAMICS AND IMPLICATIONS – BACK-UP 2
- 1、下载文档前请自行甄别文档内容的完整性,平台不提供额外的编辑、内容补充、找答案等附加服务。
- 2、"仅部分预览"的文档,不可在线预览部分如存在完整性等问题,可反馈申请退款(可完整预览的文档不适用该条件!)。
- 3、如文档侵犯您的权益,请联系客服反馈,我们会尽快为您处理(人工客服工作时间:9:00-18:30)。
Impact of
Research & Innovation on Profitable Growth in Chemicals GPCA Research & Innovation Summit
Dubai, March 12, 2014
CONFIDENTIAL AND PROPRIETARY
Any use of this material without specific permission of McKinsey & Company is strictly prohibited
PPS POM PAR PTFE EPM EDPM iso.PP HOPE ABS PAN Epoxy PBT Silicone LLDPE PEEK PES PI PEI
LCP UF PF
PED PUR PIB PET PA SBB LDPE PMMA BR PS PVC
Skeptics say the "good old times for innovation are over"
1900
19201940
1960
1980
2000
"There is an overwhelming
consensus among analysts that chemical companies should not spend more on R&D"
European Chemical News
"Innovation will not be a
primary growth and value driver in chemicals"
UBS Equity Research
"Lack of innovation has been one of the industry's greatest
problems over the past decade"
Goldman Sachs "Rapid product innovation may not confer a competitive advantage"
ING
Decline of monomer innovation
Enthusiasts see a different picture
New products/ technologies
Industrial enzymes
Liquid crystals Agchem/GMO seeds Cultures
Alternative feedstock
Methanol to olefins Coal to olefins Biomass to chemicals, e.g., bioethanol to ethylene
Resource-efficient processes New catalysts
New processes, e.g., HPPO, fermentation, electrolysis Better and better solutions
Oilfield chemicals Films and coatings
for electronics, etc.
... and
many more
Top-down perspective Archetypes of successful
companies in chemicals –
Does Research & Innovation
play a role?
Bottom-up perspective Value creation through
innovation –
What does McKinsey’s
Innomatics TM database say?
Top-down perspective Archetypes of successful
companies in chemicals –
Does Research & Innovation
play a role?
Bottom-up perspective Value creation through
innovation –
What does McKinsey’s
Innomatics TM database say?
30
20
10
100
40
90
50
80
70
60
Chemicals egment size, indexed
Global, 2011, USD bn
Adhesives Various
Enzymes Cultures Coatings Catalysts
▪
Broad application of a technology capability/
platform (across various applicat-ions, at scale)
5-15%
▪Customer intimacy ▪
Process chain insights and “system” capabilities
▪New processes/ process
improvements ▪New applications ▪
BUT –feedstock access and conduct often more relevant
5-15%
<5%
Nutritional Products
Beyond stories and opinions…
Top-down perspective Archetypes of successful
companies in chemicals –
Does Research & Innovation
play a role?
Bottom-up perspective Value creation through
innovation –
What does McKinsey’s
Innomatics TM database say?
Innovation benchmarking –McKinsey's Innomatics™
Examples (all or selected businesses)
Industry benchmarking with > 20 companies and > 100 businesses
▪Return on innovation
▪Innovation best practices
In summary
Research & Innovation do contribute to
growth and value creation of the industry –
however, not necessarily for each company
There are very attractive “winning
positions” that rely heavily on the ability
to innovate at scale
Key observations/success factors for
innovation
▪Strategy –reflecting innovation
headroom/tailwind and own capabilities
▪Scale (and/or patience to build) –
critical mass and focus
▪Lab efficiency (and spirit) –work flows,
automation/IT, etc.。