
地图设计说明书
黑龙江科技大学
《地图学》
课程设计说明书
题目:哈尔滨市年月降水分布图
院(系):矿业工程学院
班级:城乡
姓名:周春燕
学号:
指导教师:王俊杰
地图学课程设计说明书
一、资料与数据的来源
、资料的来源
资料主要来源于网上查找的资料数据、这幅底图本身含有的内容和一些关于专题地图的资料,资料和数据是比较综合整理后。
该图的比例尺为:万,主要突出的区域是哈尔滨市,符合规定要求。
、数据的来源
①首先根据上课时老师的指导找一些关于专题地图的资料数据,比如哈尔滨市的旅游地图,人口分布图等。
在这过程中我确定了自己的专题地图的内容,并且结合了课程设计的需要,绘制了一幅哈尔滨市年月份降水量分布图。
②在哈尔滨市地图的基础上,应用了原有的资料如:边界线、县级的名称。
③根据自己设定的以哈尔滨市年月降水量分布为专题之后,通过对资料的收集和分析,并巧妙地借用了网络的优势,找到了准确可靠的哈尔滨市年月降水量分布数据和布局状况。
④在图书馆里面查阅相关资料,参考别人的专题地图的制作方法,和专题的布局所选用的一些图例进行参考和借鉴。
所以综合上述的资料和数据的来源主要为收集各种地图、影像、数据和文字资料,分析汇总资料,选取有效部分加工使用,利用画图软件最后绘制出专题地图。
二、分析方法与成图过程
、专题的分析方法
专题地图的类型很多,其内容都是由地理基础和专题要素组成的。
专题地图按照地图主题的要求,一般突出反映一种或几种主体要素,其中作为主题的要素表示的很详细,其他的要素则围绕表达主题的需要,作为地理基础概略表示。
目前专题地图的表示方法一般有:定点符号法,线状符号法,质底法,等直线法,定位图表法,范围法,点数法,统计图表法动态线法。
用到了质底法,分区统计图表法。
我运用软件,选择质底法、分区与分级统计图法绘制了哈尔滨市年月降水量分布专题地图。
软件的“图面配置”是通过一个叫做“版面设计”的过程完成的。
版面设计可以将项目中除了自身之外的所有组件(由视图,图表,表格,脚本等),以及一般专题地图的必备要素:图名,图例,比例尺,等,经过整饰而组合成内容充实,表现方式多样,易于编辑修改与动态更新能力强的专题地图。
、专题地图的成图过程
()地理底图的编制
①比例尺:依据地图内容、用途选用等比例尺底图。
由于是对整个哈尔滨市进行降水分布的专题地图的绘画,所以应该选用比例尺较小的比例尺,因此我选用了万的比例尺。
②边界线:根据专题地图需要选取市、县、镇边界,线性符号选用与设计。
对边界进行勾勒,使得线转弧段利于对区的颜色填充。
高德企业地图 产品操作手册说明书

高德企业地图产品操作手册v1.0发布日期2020年3月产品操作手册目录1.高德企业地图产品简介 (3)1.1基础功能模块 (3)1.2地图工具 (3)1.3组织内部协作 (4)2.登录高德企业地图 (5)3.产品功能介绍 (6)3.1点位上图 (6)3.2区块上图 (12)3.3空间检索 (20)1.高德企业地图产品简介首先,欢迎您使用高德企业地图产品。
高德企业地图,全称Map Enterprise,是基于高德自主研发的核心算法能力、及丰富多元的活地图数据之上,面向企业(或政府)提供的一套空间数据叠加分析及可视化服务能力,产品形态以在线SaaS组件、PaaS接口、或离线部署等能力输出,能够将企业的业务数据(指与点、线、面等空间位置相关的业务数据),以GIS 空间多图层叠加的方式呈现出来,帮助政企客户进行便捷的可视化查询、计算和分析。
高德企业地图产品是一套安全、可靠、灵活的产品服务。
1.1 基础功能模块高德企业地图的基础功能模块如下:点位上图 -将企业的点位数据(包括网点、商户、企业、用户、门店等),进行空间多图层叠加显示,包括对点位数据和属性字段的存储、编辑,点位纠偏、可视化样式设置(颜色/大小/透明度、自定义图标、单色图、海量点、聚合、热力、格网等)等,支持通过名称快速查询具体点位。
区块上图-将企业所需的区块数据(包括网点辐射范围、小区AOI、商圈、标准四级行政区划、自定义圆形、自定义矩形、自定义多边形、沿路自定义区块等),进行空间多图层叠加显示,包括对区块数据的围栏编辑、合并拆分,以及属性字段的存储、编辑,可视化样式设置(填充色、边框色、标签)等,支持通过名称快速查询具体区块。
空间检索–基于地图空间视图的拉框查询,支持通过圆选、框选、多边形选、四级行政区划选等,对客户一方数据或高德POI分类数据进行检索、并且支持基于客户点位数据的周边检索等。
1.2 地图工具底图切换–支持不同风格底图之间的切换,以及高德自定义地图的接入,不影响地图上的点线面数据展示。
设计更好的地图:GIS用户的指南说明书

ContentsPreface to the second edition xi Preface to the first edition xv Chapter 1: Planning maps 1Designing for map purpose 2Audience 2Visual hierarchy in layout 3Planning a layout 6Balancing empty spaces 6Refining a layout 11Experimentation and critique 15Map projections in design 16Shape within layout 16Projections affect scale 18Choosing projection properties 19 Chapter 2: Basemap basics 21Landforms 22Elevation 22T errain shading 24Curvature 25Chapter 2 continuedLand use 26Imagery 26Land cover 28Property 30Vector base 32Water 32Boundaries 33Transportation 34Point data 34Customizing base to purpose 35Mapping through scale 37T errain through scale 37Hydro through scale 40Place data through scale 40Generalization recap 44Chapter 3: Explaining maps 47Map legends 48Data legends 48Choropleth 48Qualitative area fills 48Dot (density) 49Isolines 49Proportioned symbols 50Segmented symbols 50Basemap legends 50Customized legends 51Wise wording 52Hierarchy in text content 53Describing mapped calculations 57Attending to line logic 60Refining marginal elements 62Scale indicators 62Direction indicators 64Overdoing decoration 64vi Designing Better Maps: A Guide for GIS UsersChapter 4: Publishing and sharing maps 67Designing for map media 68Resolution 68Map size and viewing distance 70Color quality 71Choosing export options 73Raster export formats 74Vector export formats 76Transparency 78Map images on the web 79Tiled maps and caching 79Section 508 compliance 80Copyright in cartography 80Original work in cartography 80Rights and permissions 81Public licenses and open data 82Chapter 5: Type basics 85Fonts 86Font anatomy 86Categories of fonts 87Font choice 90Type styles and font families 91Special characters 92Font formats and permissions 93Label size 94Character size 94Kerning, tracking, and character spacing 95Line spacing 96Type effects 98Callouts 98Shadows 99Halos 100Contents viiChapter 6: Labeling maps 103Map text 104Graphic map text 104Dynamic labeling 106Annotation 108Labels as symbols 109Indicators of feature category 109Indicators of feature hierarchy 111Ambiguity and contradiction in classification with type 113Transparency and anti-aliasing 115Label placement 116Point label placement 116Line label placement 121Area label placement 124Dense label placement and trade-offs between rules 127Chapter 7: Color basics 129Perceptual dimensions 130Hue 130Lightness 133Saturation 134Perceptual color systems 138Three-dimensional color spaces 138Not HSV 140Color cubes 142How to mix color 144General guidelines 144CMYK mixing 147RGB mixing 149Chapter 8: Color on maps 151Color schemes for maps 152Sequential schemes 152Diverging schemes 154Qualitative schemes 157viii Designing Better Maps: A Guide for GIS UsersChapter 8 continuedBivariate color schemes 160Transparent combinations 160Sequential-sequential 161Diverging-diverging 162Qualitative-sequential 164Adjusting color selections 165Unexpected color changes 165Colors for the color-blind 169Custom color ramps 174Chapter 9: Customizing symbols 179Point symbols 180Point symbol size 180Point symbol shapes 183Point symbol angle 185Line and area symbols 187Line symbol size 187Line symbol patterns 189Area patterns 192Eight visual variables 194Visual variables for ordered data 194Visual variables for qualitative data 195Multivariate map symbols 195Overlaid symbols 196Bivariate symbols 198Visual variable pairs 200Put it all together 204Appendix 205Abbreviations 220Resources 222About the author 225Index 227Contents ix。
电子地图符号线型库设计说明书

第一章测区概况第二章介绍电子地图的大体概念,分析电子地图的要紧特点第三章第一论述电子地图符号线型库的整体设计思想,接下来描述符号线型库的设计方式及原那么,介绍了电子地图符号线型库的应用情形第四章详尽论述在Microstation下符号线型的设计与实现。
第一,简单介绍测区概况,第二提出电子地图条件下符号线型制作的一些原那么,接下来讨论符号线型制作的具体实现,最后展现了这次设计的符号线型库功效第五章总结论文所做的工作和其中的不足,得出结论第六章参考文献附表一毕业设计任务书附表二毕业设计开题报告附表三毕业设计中期检查报告附表四毕业设计的评判意见内容摘要电子地图具有地图的内涵,是数字地图在运算机屏幕上的符号化显示。
电子地图符号线型设计是电子地图生产中十分重要的环节,一个完整的符号线型库对电子地图的编辑会带来极大的方便。
本文第一对电子地图的大体概念、电子地图设计的一样理论进行了较为深切的探讨,在此基础上介绍了电子地图符号线型设计的思想、大体理论及相关技术,探讨了电子地图制作和应用的现实情形及前景展望。
本文重点讨论了屏幕上电子地图显示的特殊要求,和在电子地图条件下符号制作的方式和应该注意的问题,提出了电子地图条件下符号设计的原那么,在此基础上以microstation为例,完成了电子地图符号库的设计,并以符号库为基础,在山西平朔测区1:2000航测地形图中试应用,大大提高了航摄搜集和编辑的效率。
最后,简述了电子地图的应用和前景分析,并针对电子地图在导航、计划和前沿技术的应用,完成了电子地图符号线型库的设计。
关键词:电子地图、线型、符号、符号库、设计、应用。
引言本文讨论了屏幕上电子地图显示的特殊要求,和在电子地图条件下符号制作的方式和应该注意的问题,提出了电子地图条件下符号设计的原那么,在此基础上以microstation 为例,完成了电子地图符号库的设计,并以符号库为基础,在山西平朔测区1:2000航测地形图中试应用,大大提高了航摄搜集和编辑的效率。
导航系统地图尺度调整指南说明书
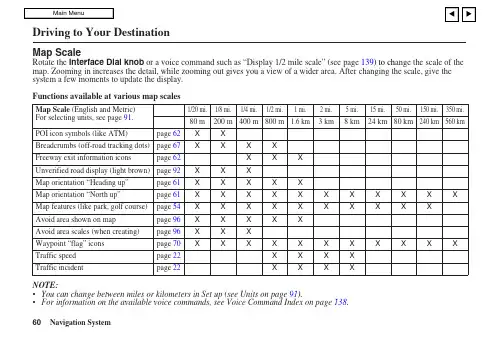
Map ScaleRotate the Interface Dial knob or a voice command such as “Display 1/2 mile scale” (see page 139) to ch ange the scale of the map. Zooming in increases the detail, while zooming out gives you a view of a wider area. After changing the scale, give the system a few moments to update the display.Functions available at various map scalesNOTE:• You can change between miles or kilometers in Set up (see Units on page 91).• For information on the available voice commands, see Voice Command Index on page 138.Map Scale (English and Metric)For selecting units, see page 91.1/20 mi. 1/8 mi. 1/4 mi. 1/2 mi. 1 mi. 2 mi. 5 mi. 15 mi. 50 mi. 150 mi. 350 mi.80 m 200 m 400 m 800 m 1.6 km 3 km 8 km 24 km 80 km 240 km 560 kmPOI icon symbols (like ATM) page 62 X X Breadcrumbs (off-road tracking dots) page 67 X X X X Freeway exit information icons page 62 XXXUnverified road display (light brown) page 92 X X X Map orientation “Heading up” page 61 X X X X X Map orientation “North up” page 61 X X X X X X X X X X XMap features (like park, golf course) page 54 X X X X X XXXXXAvoid area shown on map page 96 X X X XXAvoid area scales (when creating) page 96 X X X Waypoint “flag” icons page 70 X XXX X X X XXXXTraffic speed page 22 XX X X Traffic incidentpage 22XXXXMap OrientationThe map can be oriented two ways:• North-up: North pointing up as youwould normally view a paper map.• Heading-up: The map constantly rotates so the road you are driving on always points up (as you see the road through your front windshield).The red arrow in both heading symbols always shows the direction north. Select Heading-up or North-up to switch the map orientation from the map menu, or say, "Display heading up," or "Display north up."You can switch between the two bysaying “Display North-up.” or “DisplayHeading-up.” You can also push in onthe Interface Dial on the map orguidance screen and select North-upor Heading-up to switch them.In the larger map scales (above 2 mile or3 kilometer), the map is always orientedwith north facing upward. You cannotchange the orientation.To view other areas on the map, movethe Interface Dial left, right, up, ordown. The map will shift in thatdirection. To return the map to yourcurrent location, press either the MAP/GUIDE, the CANCEL, or the NAVIBACK button on the steering wheel.The display automatically changes tothe map screen when you reach yourdestination. Press the MENU button toreturn to the Enter destination byscreen.NOTE:• For information on the availablevoice commands, see VoiceCommand Index on page 138.•If you are on a route and theInterface Dial is moved, the “Timeto Destination” and “Distance toDestination” indications arereplaced with an indicator showingdistance from the current vehiclelocation.“North Up”“Heading Up”Destination IconThe destination icon only shows the approximate location of the destination. This occurs because a city block can have as many as 100 possible addresses (for example, the 1400 block is followed by the 1500 block.) Since most cities use only a portion of the 100 possible addresses (for example, in the 1400 block, the addresses may only go up to 1425 before the 1500 block starts). Therefore, an address if 1425 will be shown a quarter of the way down the block by the system instead of near the end of the block where the destination is actually located.Tip:When on a route, you can view a map showing your destination. Using voice control, say “Display destination map.”Landmark and IncidentIconsLandmark icons are shown in the mapscreen on 1/20 and 1/8 mile scale, or 80and 200 meter scale. The Freeway exitinformation is displayed on the 1/4, 1/2,and 1 mile scales. Incident icons aredisplayed on the 1/2 through 5 milescales. The icons are:Landmark iconIncident iconSome icons can be turned on or off;you can either display them or hidethem by pushing in on the InterfaceDial on the map or guidance screenand select Show Icon on Map (seepage 65), or by using voice commands(see page 138).You can select most landmark andincident icons with the Interface Dialto display the icon’s information. Seethe table on the following page forexceptions.NOTE:• The same icon list can be viewed onthe screen by selecting Map Legendfrom the Information screen.• When there are overlappinglandmark icons, a list of the points ofinterest (POIs) is displayed.• For information on the availablevoice commands, see VoiceCommand Index on page 138.Acura DealerSchoolRestaurantATMParking LotPost OfficeHonda DealerHospitalGrocery StoreGas StationHotel/LodgingParking GarageFreeway exit informationWeatherAccident / Incident (other)ConstructionFor some icons you can choose either to show or hide them on the map, while others like Acura Dealers, are always shown. The table below shows the features for each icon type. Some Points of Interest (POIs) like Police Stations are not shown as an icon, but you can still locate the nearest one with the voice command, “Find nearest Police station.”Landmark iconPOI type Icon can bedisplayed onthe mapIcon can behidden onthe mapIconselection byvoiceIcon can be selected asa destination on themap screen with theInterface DialPOI can be found onthe map screen usingvoice command“Find...”Honda/Acura dealer Yes, always No No Yes Yes Hospital Yes Yes Yes Yes Yes School Yes Yes Yes Yes Yes ATM Yes Yes Yes Yes Yes Gas station *1Yes Yes Yes Yes Yes Restaurants *2Yes Yes Yes Yes Yes Post office Yes Yes Yes Yes Yes Grocery store Yes Yes Yes Yes Yes Hotel/ Lodging Yes Yes Yes Yes Yes Police station No icon No icon No No Yes Shopping, Tourist attraction, Bank No icon No icon No No Yes Parking garage Yes Yes Yes Yes Yes Parking lot Yes Yes Yes Yes Yes Freeway exit information Yes Yes Yes Yes (choose POI)NoIncident icon*1. When gas station icons are selected for view on the map, some icons are shown as “brand icons.”*2. When selecting Restaurant on the Select category for icon settings screen (see Icon Options on page 65), specialty typesof restaurants, like Chinese or Italian, can be individually displayed or hidden. See Show Icon on Map on page 137. Als o see the Voice Command Index on page 138 for the “Display,” “Hide,” and “Find” commands.*3.You can display the nearest traffic incidents by saying, “Display traffic incidents.”POI type Icon can be displayed on the map Icon can be hidden on the map Iconselection by voice Icon can be selected as a destination on the map screen with the Interface Dial POI can be found on the map screen using voice command “Find...”Traffic Speed Yes Yes Yes No No Traffic IncidentYesYesYesNoYes *3。
Esri的实时数据地图制作指南说明书

Real-time data is as current as the data source that is updating it, whether that data is being updated every second, minute, or hour, or daily. Real time is a concept that typically refers to the awareness of events at the same rate or at the same time as they unfold (without significant delay).Build skills in these areasAccessing the Landscape Layers in Esri’s Living AtlasConstructing a map with several real-time servicesWhat you needAn ArcGIS Online organization accountEstimated time: under 30 minutesScenarioYour county government has asked you to construct a USA flood map that can be made available to the public to provide real-time data of the following:• Streams• Flood status• National Weather Service precipitation forecast Making a real-time map1. Sign in to ArcGIS Online organizationalaccount.2. Click Map.3. Change the Basemap to Light Gray.4. On the top menu go to Add>>Browse Livingand type Esri_Hydro_Reference_Overlay in thesearch pane.Constructing a map with real-time data Combine streams, flood status, and 72-Hour precipitation forecast5. Click Add.6. Click DONE ADDING LAYERS.7. On the top ribbon, go to Add>>Browse Living Atlas>>Earth Observations>>Live Stream Gauges(Flooding).8. Click Add as a layer.9. Click CLOSE.10. On the top ribbon, go to Add>>Browse Living Atlas>>Earth Observations>>National WeatherService Precipitation Forecast.11. Click Add as a layer.12. Click CLOSE.Notice at the bottom a time slider appears. The data is time enabled and shows the predicted values at six-hour intervals for the next three days.13. On the top ribbon, click Save As and save your map with the following metadata:• Title: USA Flood Map.• T ags: IGARC2_flood_yourinitials.W• Summary: This map shows real-time flood conditions across the US.14. SAVE MAP.Make a story mapA story map allows you to present your map with navigation tools and backgrounds.1. Click share on the top menu bar and share with your organization.2. After sharing your map, click CREATE A WEB APP.3. Click Build a Story Map.4. Click Story Map Basic.5. Click CREATE WEB APP.6. Change the title to US Flood Map.7. Summary: This map shows real-time flood conditions across the US.8. Click DONE.9. To allow public access, check the subscriber content boxes:• Click USA Stream Gauges (Flooding).• Click National Weather Service Precipitation Forecast.10. Select Web Map.11. Click Save.12. Click Launch.In this lesson, you have constructed a map with real-time data and used a web application to display the data. This map will satisfy the county government.。
纬地使用说明书

3.2平面线形设计方法之一“曲线设计法”公路路线与立交的线形可由三种基本曲线段相互搭接组成,圆曲线、缓和曲线(回旋线)和直线。
每一基本曲线段由以下几项参数来加以确定描述:Z&Y 曲线在前进方向上向左或向右P 曲线在横向错移值S 曲线段的长度,正值表示曲线的弦长,负值表示曲线弧长A 曲线段回旋线参数值,直线和圆曲线为0RO 曲线段起始曲率半径,为非零值,9999表示曲率半径为无穷大(输入0或负值也均被认为是无穷大)RD 曲线段终点的曲率半径,为非零值,9999表示曲率半径为无穷大这里为了便于说明,将所有曲线类型归为以下几类,见表3-1,括号内为各参数的取值范围。
表3-1平面线形由以上三种基本曲线相互搭接组合而成,而起点接线约束和终点的接线约束确定了本立交线形与其他立交匝道或主线之间的相对关系。
说明:①本手册所述之缓和曲线均指回旋曲线。
②本章节所述及公路路线与立交设计方法(两种)仅是本系统中线形设计方法的一种划分和描述。
③用户在使用本系统绘图时,请切记:不要手工修改AutoCAD的系统单位(Units)设置,HintCAD在加载之后会自动设置该项控制;确保系统成图所要用到的各个图层处于打开和非加锁状态;确保关闭所有自动捕捉方式;如需控制系统生成图表中数据小数点后是否出现“.000”或“.00”,请修改AutoCAD系统变量“DIMZIN”值。
④本系统中曲线、坐标、长度等单位均采用“米”为单位;边坡、横坡等坡度均采用1:X,只输入其中的X。
⑤AutoCAD是双精度图形平台,所以用户在精确绘图的同时已完成一定的数据计算工作,所需要的许多数据,可以直接从图形屏幕上读取,其精度一般不低于计算得到的结果。
例如:对缓和曲线的计算,对复杂线形曲线加宽或平移后坐标、距离及长度的计算等,不过请您注意“曲线模拟步长”这一控制的影响。
3.5平面曲线数据导入/导出该功能用于将已完成的公路项目的平面设计数据(特别是未使用交点坐标,而使用交点间距(或桩号)加转角的方式进行的低等级公路项目)导入到纬地项目中,将其转化为纬地专用的平面交点数据文件(*.jd)。
在线动态地图平台 用户手册说明书
在线动态地图平台用户手册二〇二〇年12月I 在线动态地图平台目录目录 (I)1 前言 (1)2 手册内容 (1)3 运行环境 (1)4 平台系统概述 (1)4.1 系统功能和技术特点 (2)4.2 数据资源模块 (2)4.3 制作地图模块 (3)4.4 出图打印模块 (4)5 系统操作指南 (4)5.1 数据资源操作说明 (4)5.1.1 公共数据管理 (5)5.1.1.1 公共数据查询 (6)5.1.1.2 公共数据预览 (6)5.1.2 我的数据管理 (7)5.1.2.1 我的数据上传 (7)5.1.2.2 我的数据预览 (8)5.2 制作地图操作说明 (8)5.2.1 自定义地图制作 (9)5.2.1.1 选择数据 (9)5.2.1.2 选择底图 (10)5.2.1.3 选择纸张 (11)5.2.1.4 地图编辑 (11)5.2.2 示例模板地图制作 (16)5.3 出图打印操作说明 (17)5.3.1 整幅导出 (17)5.3.2 分幅导出 (18)1 前言本手册为在线制图平台用户操作手册,手册将详细介绍平台所包括的上传数据、数据查看、制作地图、出图打印等的操作流程,旨在为用户熟悉系统功能、进行业务操作、提高工作效率提供帮助。
2 手册内容本手册内容主要为平台功能模块介绍及其操作流程。
3 运行环境支持IE、Google Chrome、360安全浏览器、Safari、Mozilla Firefox等主流浏览器浏览。
4 平台系统概述在线制图平台是为了克服弱GIS行业地图制图难、传统地图平台难以满足需求等问题所研发的,主要是具有数据改造发布、无极缩放、模板丰富、快速成图、不同尺寸纸张打印、分幅打印等功能的在线动态制图平台。
为方便用户操作、简化登录流程、本平台只需微信扫描二维码即可登录系统,如图4-1所示。
图4-1 在线制图平台入口页面4.1 系统功能和技术特点在线制图平台的硬件环境主要包括有服务器不低于2.3GHZ的4核Inter(R) Xeon(R) 处理器,不低于8G系统内存,不低于100GB存储容量。
3D打印全球任意地点的Topo地图的手册说明书
How to 3D Print a Topo Map with 3D Features Anywhere in the WorldPosted on Aug. 27, 2013 by Roy Smith - Guest ContributorRoy (aka "The SmithBot") presents us with a hands-on guide to turning your neighborhood, city, state, or favorite National Park into a 3D printable relief map.A few months ago my friend Barney said, “Can you print Thousand Palms Canyon?”I knew what he meant: all the hills and gulleys and landscape features we’re familiar with. “No,”I said. “That’s impossible.” But the idea kept bugging me. Why not? So I did what any of you would do in the middle of a sleepless night: I went online. Huh! Not impossible, but maybe a little bit tricky. Below are the step-by-step instructions.Author's Note: I’m using Photoshop and 3DS Max on a PC to edit files and export them to my MakerBot Replicator 2, so this procedure might be different for you if you’re using other software. I bet it will be similar enough for this info to be useful, though.1. Download and install Google Earth.2. Download and install MicroDEM - a free application available through the U.S. Naval Academy website. Install involves two steps - download and run the installer first, then replace the executable with the latest version (available as a separate download).3. Download and install the srtm4.1 plugin for Google Earth (Note: clicking on this link may automatically download the srtm4.1 plugin, depending on your browser).A. Selecting a topographic region in Google Earth4. In Google Earth, the SRTM4.1 will appear under “My Places” in the navigation on the left. Click on the small “Elevation” square, an d a grid of boxes should appear on the globe image (Image “A”);5. Click on one of the boxes that includes topography you want to print;B. Topographic data - download options6. A window will appear (You might need to scroll down). Click on the link as in Image “B”;C. Topographic data - the direct download url7. The auto-download probably won’t work, so copy the url as suggested, and paste it into your browser, as shown in Image “C.” This download may take a few minutes;8. Unzip the downloaded archive. The only file you need is the .asc file. Put it somewhere you can find it easily. Toss the rest;9. You need to use MicroDEM to interpret the altitude data. (Do n’t try using any of the other “helpful” tools on the Internet to open this kind of file – some of them are nasty viruses!);10. In MicroDEM, go to File>Open>Open DEM and locate your file;D. Using MicroDEM to preview your topographic data11. Here’s the tricky part: You probably have no idea what you’re looking at. No highway s, no names of cities, no identifiers of any kind! So you’ll need to reference back-and-forth with some other map to narrow down the area you want to print. When you figure out which part of the map you want to zoom in on, use the “Subset & zoom” tool (dot ted border) from upper left to lower right to zoom in (Image “D”);12. Right-click on the map and choose “Legends/marginalia,” and make sure none of the boxes is selected (don't forget to remove the gridlines);E. Exporting topographic data in greyscale13. Right-click again, select Display parameter>Elevation>Gray scale. This is the image you will use in your 3D program to create a displacement map in order to print your topographical 3D model (Image “E”);14. Select File>Save image, and choose whatever image format works best in your 3D program(I use jpeg);F. Checking the image size in Photoshop15. Quit out of MicroDEM and open Photoshop or whatever image-editing program you use. Open the file you just saved. Check to determine image size, and jot it down. Mine happened to be 860x650 pixels. That means, when I create a plane object in 3DS Max it will be, like, 8.6in x 6.5in o r 860mm x 650mm or whatever units you prefer (Image “F”). Close the file;Editor's Note: If you don't have Photoshop there are plenty of other options for checking the dimensions of an image. In Windows Explorer single-clicking a picture file will display the dimensions in the info panel at the bottom of the window.G. Creating a plane in 3D Studio Max16. Open your 3D program, create a plane with similar dimensions (You might need to switch width for length), and give that plane LOTS of segments, like, 430x325. I divided dimensions in half (Image “G”);H. Creating a displacement map from your grayscale elevation image17. In 3DS Max (or whatever you’re using), select the plane, go to the Modifier List, scro ll down to “Displace,” and add your grayscale map to create the terrain you want. Adjust “strength” to exaggerate the height of the mountains however you prefer. Problem is, a plane has only two dimensions, so you can’t print it with a 3D printer no matter how many mountains it has (Image "H");Editor's Note: If you don't have access to 3D Studio Max, fear not! Using Roy's instructions as a general guideline we completed these steps with Blender (a free 3D editing tool).J. Converting your plane into a 3D printable object18. Convert the plane to an Editable Poly, select only the outermost vertices (“select border” in 3DS Max), and drag them all down pretty far on the Z axis till they’re clear of everything else. Then “Make Planar” on “Z,” which should line up all the vertices you selected to have equal “Z” values. With that border still selected, click on “Cap.” That completes a 3D printable object (Image “J”);19. Move the bottom “cap” up near to the lowest point of your topography, but not too close, or you risk breaking your printed map when you pry it off your build surface at the end of this process;20. Select your topo map object and export it as a StereoLitho (STL) file;K. Topographic map imported into MakerWare21. Open MakerWare, MatterControl, or whatever you’re using to drive your printer, and add your STL object, scaling it to fit your print bed comfortably (Image “K”);L. The final product - a 3D printed topographic map22. Print it! This will take a long time to print. My map took almost four hours, but the detail is amazing. This printed object is only about 4.75in x 3.5in (Image “L”).This may look like a long, difficult process, but it’s actually pretty straightforward if you follow every step to the letter. Believe me: It will be a lot easier for you to go through these steps than it was for me to figure them out.If you find any mist akes in this article, please point them out, and I’ll do my best to fix them.Good printing!Roy SmithThe Smithbot27 CommentsIt looks kind of hairyuhuh - August 29th, 2013 at 12:12p.m.@uhuh - There are some pretty technical aspects so it is definitely not for the faint of heart, but once you get the hang of the tools involved it is very repeatable.If you try it out and run into problems just post your question here - we'll attempt to improve the instructions over time.kevin.pope[Moderator] - August 29th, 2013 at 12:19p.m.Yes, I mean there's hairs on it.uhuh - August 30th, 2013 at 9:37a.m.Hahaha - I'm pretty sure those are filament strands.Update: New photo shows the final product with a tiny bit of clean-upkevin.pope[Moderator] - August 31st, 2013 at 8:47a.m.Hi, can you describe step by step the proces in blender? Thanks!pimpom - September 2nd, 2013 at 7:49a.m.@pimpom Yes, we will work on describing the process in blender.kevin.pope[Moderator] - September 3rd, 2013 at 9:23p.m.I'm wondering how tree coverage would impact the ability to map different areas. For instance, if an area has dense tree coverage, how is Google Earth getting these measurements?Alex - October 19th, 2013 at 12:47p.m.I'm having some trouble getting from step 4 to step 5, where I can't figure out how to "click" on one of the boxes. Any input as to how you get to the topographic data download section would be greatly appreciated!Thanks!AlexAlex - October 19th, 2013 at 12:59p.m.@AlexTo be a little more clear - in order to select a topographic data set you'll want to 'fly' to the area you want an look for a label called 'Data for: srtm_xx_xx', clicking on the icon near that label will pop up the dialog in figure b.There are some methods of gathering topographic that ignore tree coverage - such as Airborne Laser Scanning (aka lidar). Not sure if that was part of the collection method for this particular data set though.kevin.pope[Moderator] - October 19th, 2013 at 1:42p.m.Hello. I'm having a bit of an issue. I was able to download everything and open up Google Earth, but when I click on the elevation box for SRTM4.1, no white boxes appear and I'm not sure how to proceed. Is there a setting that would be hiding them?Thanks!heolson - December 4th, 2013 at 5:41a.m.I'm not aware of any settings that would hide the data. The grid squares are fairly large so if you are zoomed in you may not see them. Here is a picture of what it should look like with the plugin installed:kevin.pope[Moderator] - December 6th, 2013 at 2:33p.m.The same thing is happening to me. No white lines appear when I click on the "elevation" setting. I've pulled out, zoomed in: nothing. I can't select anything.Christian Probasco - December 6th, 2013 at 6:19p.m.What model/size 3d printer did you use?Guest - December 23rd, 2013 at 8:43a.m.It was the Airwolf3D XLcselph[Moderator] - December 24th, 2013 at 11:28a.m.I am also not able to see any squares, i zoomed in to the exactly same spot and size as the comment of kevin.pope but i don't see anything.I just donwloaded it and i am using version 7.1.2.2041. I don't know if it has to do anything withit but maybe it is because of an update in google maps? or am I doing something wrong? I hope someone knows a solution i so want this maps printed ;)Thanks for help and this topic is so nice thanks for sharing this!Guest/Roeland22896 - December 26th, 2013 at 2:00p.m.Ok i noticed something hope that will help a bit more to find the problem.you have the "lamp" symbol on the elevation map and yours is green in the picture but and mine is orange, i tried to right click and then click on refresh, is moves a few times (now it is grey) from left to right and then it stand still in the middle and goes back to orange.Guest/Roeland22896 - December 26th, 2013 at 2:06p.m.If i click propreties, then this is the link i get:/portal/srtm41/elevation.kmzBox is selected from allow settings to be expandedBox is empty from Show content as optionIn description there is nothingIn view everything is on NA and date/time is NONEI don't know what refresh was (played a while but nono of the settings changed anything) but box was empty from fly to vieuw refresh.Sorry for these 3 fast commments but just wanted to give some more information.Guest/Roeland22896 - December 26th, 2013 at 2:12p.m.Interesting, could be that the plug in isn't compatible with the new version of Google Earth. I will download a fresh copy and give it a try.kevin.pope[Moderator] - December 29th, 2013 at 1:03p.m.I could not get the grid to show up either for 7.1.xxx version (latest). I downloaded the older7.0.xxx version and now it works...FYIGuest/Mitch Frankel - December 31st, 2013 at 12:08p.m.^^^ I was wrong, the grids that appear for version 7.0.xxx were not for elevation data. I cannot get srtm4.1 to work for any version of Google earth 32-bit Windows 7 OS.Guest/Mitch Frankel - December 31st, 2013 at 12:13p.m.I was able to get a greyscale heightmap image from microdem using data from the srtm website (/SELECTION/inputCoord.asp), import the plane into blender, and displace the plane so that my topo is visible. I now have a 2D map and have not been able to figure out how to make a 3D solid to export to stl (using Blender). Any help in doing steps 18-20 above in Blender would be greatly appreciated.Guest/Mitch Frankel - December 31st, 2013 at 2:20p.m.Sorry for so many posts - Use this tutorial for Blender (see comments for extruding the plane) - /tutorial/make-mountains-blender-height-maps. Between that tutorial and this one, I've gotten an awesome 3D print of the Wasatch!Guest/Mitch Frankel - December 31st, 2013 at 2:44p.m.I HAVE THE SAME PROBLEM AS Guest/Roeland22896 ANYONE GOT AN ANSWER?SUZ - March 6th, 2014 at 6:59a.m.There appears to currently be a problem with the servers that provide the SRTM data to google earth, so the plugin does not currently function (see the upper left part of this page:/srtm: "Status Technical problems. Servers being rebuilt.")Your best bet is probably what Mitch Frankel suggested... get the data (without using google earth) from /SELECTION/inputCoord.aspGuest - April 22nd, 2014 at 10:32a.m.I'm doing this for French alps, using the data from CGIAR as in the hint above. I can make a nice map, and even extrude it. But I can't do step 18 to make a flat base for 3D printing. Can someone offer me a noobie walkthrough for step 18 above, but in Blender?Big J - June 16th, 2014 at 11:05p.m.Thanks for the tutorial. I have a question, I'm working with a jpg of a map, it's not greyscale, it's red and blue shading. How can I convert that to a 3d displacement map in Maya or Sketchup?Thanks.T - June 21st, 2014 at 10:57a.m.Cheer Roy!Every step has been perfect, absolutely perfect.Worked out well, I ended up using Blender for the Displacement, then 3DS Max for the base forming. The SRTM Google plugin is still giving me issues though, but hopefully i'll fix that soon.Best Regards,AndrewAndrew - August 10th, 2014 at 6:49p.m.Add a Comment*italics* italics**bold** bold [MatterHackers]() MatterHackers* item 1 * item 2 * item 3 ∙item 1 ∙item 2 ∙item 3> quoted text quoted text ∙Related Articles• Your new source for 3D printing supplies• Working To Add Automatic Printer Calibration• Automatic Printer Calibration: Update• 3D Printing A Wooden Glider• Southern California 3D Printing Meetup• Great Turnout For Jan 2013, 3D Printing Meetup• A 3D Printed Valentine• How To Succeed When Printing In PLA• Have Printer – Will Travel• 3D Printing Workshop - Southern California• 3D Printers for Peace Contest Announces Winners• How to Make Your Friends into Flakes• Lars Brubaker presents at the 2014 3D Printer World Expo • Sneak Peak: MatterControl 1.1• How To Succeed When Printing With ABS• Printing Tips & Tricks: ABS Bed Adhesion• Printing with Nylon• MatterCAD - Design Your 3D Parts In C#• MatterCAD API Documentation。
CASS-9.0使用说明书
目录第一章CASS 9.0安装1.1 CASS 9.0的运行环境1.2 CASS 9.0的安装1.3 CASS 9.0更新卸载第二章 CASS 9.0快速入门第三章测制地形图3.1 准备3.2 绘制平面图3.3 绘制等高线3.4 编辑与整饰第四章测制地籍图4.1 绘制地籍图4.2 宗地属性处理4.3 绘制宗地图4.4 绘制地籍表格第五章土地详查与勘测定界5.1 土地详查5.2 勘测定界中块状工程作业一般流程5.3 勘测定界中线状工程作业一般流程5.4 土地勘测定界成果第六章 CASS在数据入库中的应用6.1属性结构设置与编辑6.2图形实体检查6.3数据输出第七章 CASS 9.0在工程中的应用7.1 基本几何要素的查询7.2土方量的计算7.3 断面图的绘制7.4 公路曲线设计7.5 面积应用7.6 图数转换第八章数字地图管理8.1 数字地图管理概述8.2 图幅管理第九章 CASS在市政监管中的应用9.1数字市政监管概述9.2 CASS在城市部件调查中的应用9.3 CASS中市政监管操作流程第十章白纸图数字化10.1 用手扶跟踪法进行老图数字化10.2用CASS 9.0进行扫描矢量化10.3用CASSCAN进行扫描矢量化第十一章电子平板成图11.1 准备工作11.2 电子平板测图11.3 总结第十二章.. CASS 9.0打印指南12.1打印出图的操作附录A CASS 9.0的野外操作码第二章 CASS 9.0快速入门本章将介绍一个简单完整的实例,通过学习这个例子,初级用户就可以轻轻松松的进入CASS 9.0的大门。
高级用户可以跳过本章。
CASS 9.0安装之后,我们就开始学习如何做一幅简单的地形图。
本章以一个简单的例子来演示地形图的成图过程;CASS 9.0成图模式有多种,这里主要介绍“点号定位”的成图模式。
例图的路径为C:\CASS9.0\demo\study.dwg(以安装在C:盘为例)。
初学者可依照下面的步骤来练习,可以在短时间内学会作图。
ESRI地质地图模板说明书
– Data Model ≠ Solution – Our data model is informed by our expertise in
FGDC Model: Representation Class Structure
• Representation class structure modeled after Appendix A of the Standard
Review
• Essentials
– Organize your data – Create a template database – Add data to template database – Symbolize data – Label features – Customizing symbols
/maptemplates
Road Ahead for the Geologic Mapping Template
• More fill patterns • Additional marker symbols • Web edition
Questions?
• Set of ArcGIS Resources
• Includes:
– Template geodatabases
– Cartographic designs
– Tools and documentation
– Example maps & databases
What is the Geologic Mapping Template?